
We could not find any results for:
Make sure your spelling is correct or try broadening your search.

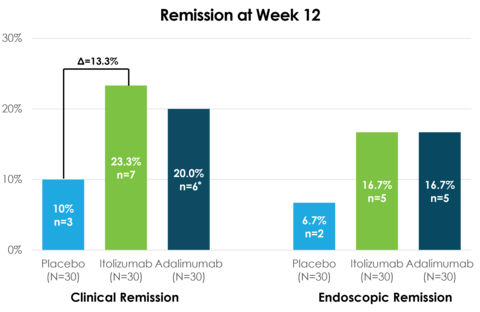
Equillium Inc is a biotechnology developing therapies to treat autoimmune and inflammatory disorders. Its pipeline includes itolizumab, a first-in-class antibody targeting the CD6-ALCAM pathway which plays a key role in the modulation of effector T cells - currently in a Ph 3 study for patients with... Equillium Inc is a biotechnology developing therapies to treat autoimmune and inflammatory disorders. Its pipeline includes itolizumab, a first-in-class antibody targeting the CD6-ALCAM pathway which plays a key role in the modulation of effector T cells - currently in a Ph 3 study for patients with acute graft-versus-host disease and a Ph 1b study for patients with lupus nephritis. EQ101, a first-in-class cytokine inhibitor that selectively targets IL-2, IL-9, and IL-15 is Ph 2 ready and expected to begin enrolling patients in an alopecia areata study in 2H 2022. EQ102, a cytokine inhibitor that selectively targets IL-15 and IL-21, is ready for clinical development and expected to begin enrolling patients in a Ph 1study including patients with celiac disease. Show more

| Period | Change | Change % | Open | High | Low | Avg. Daily Vol | VWAP | |
|---|---|---|---|---|---|---|---|---|
| 1 | -0.0864 | -9.39334637965 | 0.9198 | 0.96 | 0.79 | 110770 | 0.90065854 | CS |
| 4 | 0.1414 | 20.4335260116 | 0.692 | 1.03 | 0.6334 | 2260102 | 0.93607313 | CS |
| 12 | 0.0834 | 11.12 | 0.75 | 1.03 | 0.493 | 889403 | 0.90991778 | CS |
| 26 | -0.2466 | -22.8333333333 | 1.08 | 1.5 | 0.493 | 491776 | 0.91750963 | CS |
| 52 | -1.7766 | -68.0689655172 | 2.61 | 3.25 | 0.493 | 370571 | 1.07554245 | CS |
| 156 | -2.5166 | -75.1223880597 | 3.35 | 4.04 | 0.45 | 224760 | 1.19956169 | CS |
| 260 | -4.1766 | -83.3652694611 | 5.01 | 30.2 | 0.45 | 473101 | 12.84649197 | CS |
 green maschine
3 weeks ago
green maschine
3 weeks ago
 tw0122
3 weeks ago
tw0122
3 weeks ago
 glenn1919
3 weeks ago
glenn1919
2 months ago
tw0122
2 months ago
tw0122
2 months ago
glenn1919
3 weeks ago
glenn1919
2 months ago
tw0122
2 months ago
tw0122
2 months ago
 Monksdream
6 months ago
rbl100
9 months ago
Monksdream
10 months ago
Monksdream
1 year ago
rbl100
1 year ago
glenn1919
1 year ago
Monksdream
6 months ago
rbl100
9 months ago
Monksdream
10 months ago
Monksdream
1 year ago
rbl100
1 year ago
glenn1919
1 year ago
 AKATITUS
1 year ago
rbl100
1 year ago
AKATITUS
1 year ago
rbl100
1 year ago
 AJ Freely
2 years ago
Awl416
2 years ago
jerseyboy
4 years ago
jerseyboy
4 years ago
AJ Freely
2 years ago
Awl416
2 years ago
jerseyboy
4 years ago
jerseyboy
4 years ago
 eastunder
4 years ago
eastunder
4 years ago
 Actualfactual
4 years ago
eastunder
4 years ago
eastunder
4 years ago
jimmy667
4 years ago
jimmy667
4 years ago
Actualfactual
4 years ago
eastunder
4 years ago
eastunder
4 years ago
jimmy667
4 years ago
jimmy667
4 years ago
 ClayTrader
4 years ago
shurtha2000
4 years ago
eastunder
4 years ago
eastunder
4 years ago
ClayTrader
4 years ago
shurtha2000
4 years ago
eastunder
4 years ago
eastunder
4 years ago
 MiamiGent
4 years ago
RNsidersbuying
4 years ago
Roadtojourney
4 years ago
MiamiGent
4 years ago
RNsidersbuying
4 years ago
Roadtojourney
4 years ago
 Penny chatter
4 years ago
Penny chatter
4 years ago
 LQMT_Monster
4 years ago
Drexqd
4 years ago
Roadtojourney
4 years ago
quito_yume
4 years ago
Roadtojourney
4 years ago
Roadtojourney
4 years ago
otcmoneydoubler
4 years ago
LQMT_Monster
4 years ago
Drexqd
4 years ago
Roadtojourney
4 years ago
quito_yume
4 years ago
Roadtojourney
4 years ago
Roadtojourney
4 years ago
otcmoneydoubler
4 years ago
 crudeoil24
4 years ago
crudeoil24
4 years ago
crudeoil24
4 years ago
crudeoil24
4 years ago
PAC
4 years ago
otcmoneydoubler
4 years ago
PAC
4 years ago
crudeoil24
4 years ago
crudeoil24
4 years ago
crudeoil24
4 years ago
crudeoil24
4 years ago
PAC
4 years ago
otcmoneydoubler
4 years ago
PAC
4 years ago
 BostonSportsNut
5 years ago
Amatuer17
5 years ago
weedtrader420
5 years ago
eastunder
5 years ago
BostonSportsNut
5 years ago
Amatuer17
5 years ago
weedtrader420
5 years ago
eastunder
5 years ago

It looks like you are not logged in. Click the button below to log in and keep track of your recent history.
Support: +44 (0) 203 8794 460 | support@advfn.com
By accessing the services available at ADVFN you are agreeing to be bound by ADVFN's Terms & Conditions

 Hot Features

