Investors Title Company (NASDAQ: ITIC) today announced its
results for the quarter ended March 31, 2012. The Company reported
net income of $1,432,139, or $0.67 per diluted share, compared with
$1,019,207, or $0.46 per diluted share, for the prior year
period.
Total revenues increased 11.9% versus the prior year period to
$22,414,274, primarily due to a 10.1% increase in net premiums
written. Historically low interest rates drove a substantial
increase in refinance activity versus the prior year period.
Purchase activity was up as well, although to a lesser extent. New
industry-wide premium charges for North Carolina that went into
effect during the quarter also contributed to growth in premium
revenue.
Total expenses increased 9.6% versus the prior year period,
primarily due to increases in variable expenses such as commissions
and the provision for claims, which fluctuate with premium volumes.
The provision for claims as a percentage of net premiums written
was 8.3% versus 4.0% in the prior year period due to an increase in
volume in states with a higher average loss ratio, and an
abnormally low claims expense in the prior year period. In
addition, the Company continues to benefit from long-term
reductions in operating expenses such as occupancy and operating
costs in its branches due to an emphasis on expense control over
the past few years.
Chairman J. Allen Fine added, “We are pleased with the uptick in
mortgage lending activity and our first quarter results. Operating
expenses were largely in line with recent quarterly trends
adjusting for the improvement in activity levels, although we
expect them to trend higher as we increase our investment in a
number of software development initiatives. Our balance sheet
remains very strong, and we continue to focus on long-term
opportunities to enhance our competitive strengths and market
presence.”
Investors Title Company is engaged through its subsidiaries in
the business of issuing and underwriting title insurance policies.
The Company also provides investment management services to
individuals, companies, banks and trusts, as well as services in
connection with tax-deferred exchanges of like-kind property.
Certain statements contained herein may constitute
forward-looking statements within the meaning of the Private
Securities Litigation Reform Act of 1995. Such statements include,
among other statements, any predictions regarding future agency
expansion or increasing operational efficiency. These statements
involve a number of risks and uncertainties that could cause actual
results to differ materially from anticipated and historical
results. Such risks and uncertainties include, without limitation:
the cyclical demand for title insurance due to changes in the
residential and commercial real estate markets; the occurrence of
fraud, defalcation or misconduct; variances between actual claims
experience and underwriting and reserving assumptions; declines in
the performance of the Company’s investments; government
regulation; and other considerations set forth under the caption
“Risk Factors” in the Company’s Annual Report on Form 10-K for the
year ended December 31, 2011, as filed with the Securities and
Exchange Commission, and in subsequent filings.
Investors Title Company and Subsidiaries
Consolidated Statements of Income For the Three Months
Ended March 31, 2012 and 2011 (Unaudited)
Three Months Ended March 31
2012
2011
Revenues: Net premiums written $
19,667,420 $
17,865,588 Investment income - interest and dividends
977,261 899,372 Net realized gain (loss) on investments
192,881 (26,160 ) Other
1,576,712
1,283,220 Total Revenues
22,414,274
20,022,020
Operating Expenses: Commissions to
agents
11,192,127 10,879,586 Provision for claims
1,631,359 721,626 Salaries, employee benefits and payroll
taxes
4,990,632 4,691,996 Office occupancy and operations
927,038 963,927 Business development
393,447 387,547
Filing fees, franchise and local taxes
351,922 214,113
Premium and retaliatory taxes
414,794 405,473 Professional
and contract labor fees
400,537 308,524 Other
167,279 103,021 Total Operating Expenses
20,469,135 18,675,813
Income
Before Income Taxes 1,945,139 1,346,207
Provision For Income Taxes
513,000 327,000
Net Income $
1,432,139 $ 1,019,207
Basic Earnings Per
Common Share $
0.68 $ 0.46
Weighted
Average Shares Outstanding - Basic 2,100,835
2,234,480
Diluted Earnings Per Common
Share $
0.67 $ 0.46
Weighted Average
Shares Outstanding - Diluted 2,128,788
2,239,500
Investors Title Company and Subsidiaries Consolidated
Balance Sheets As of March 31, 2012 and December 31,
2011 (Unaudited) March
31, 2012 December 31, 2011
Assets Investments in
securities: Fixed maturities, available-for-sale, at fair value $
87,142,860 $ 85,407,365 Equity securities,
available-for-sale, at fair value
26,824,431 22,549,975
Short-term investments
8,571,468 14,112,262 Other
investments
5,628,864 3,631,714 Total
investments
128,167,623 125,701,316 Cash and cash
equivalents
16,465,383 18,042,258 Premiums and fees
receivable, net
7,143,066 6,810,000 Accrued interest and
dividends
962,560 1,108,156 Prepaid expenses and other
assets
2,713,752 2,743,517 Property, net
3,469,310 3,553,216
Total Assets $
158,921,694 $ 157,958,463
Liabilities and
Stockholders' Equity Liabilities: Reserves for claims $
38,285,000 $ 37,996,000 Accounts payable and accrued
liabilities
10,513,737 12,330,383 Current income taxes
payable
148,262 640,533 Deferred income taxes, net
1,445,108 479,363 Total liabilities
50,392,107 51,446,279
Stockholders'
Equity: Common stock - no par value (shares authorized
10,000,000; 2,097,564 and 2,107,681 shares issued and outstanding
as of March 31, 2012 and December 31, 2011, respectively, excluding
291,676 shares for 2012 and 2011 of common stock held by the
Company's subsidiary)
1 1 Retained earnings
99,841,101 99,003,018 Accumulated other comprehensive income
8,688,485 7,509,165 Total stockholders' equity
108,529,587 106,512,184
Total
Liabilities and Stockholders' Equity $
158,921,694 $ 157,958,463
Investors Title Company and Subsidiaries Net Premiums
Written By Branch and Agency For the Three Months Ended
March 31, 2012 and 2011 (Unaudited)
Three Months Ended March 31
2012
% 2011 %
Branch $
4,822,792 24.5 $ 3,696,280 20.7
Agency
14,844,628 75.5
14,169,308 79.3
Total $
19,667,420 100.0 $ 17,865,588
100.0
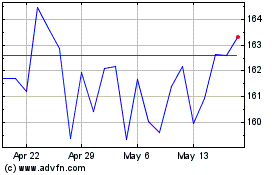
Investors Title (NASDAQ:ITIC)
Historical Stock Chart
From Jun 2024 to Jul 2024

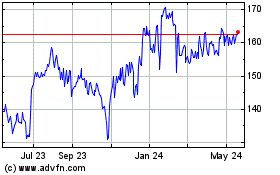
Investors Title (NASDAQ:ITIC)
Historical Stock Chart
From Jul 2023 to Jul 2024
