Understanding a Double Bottom and the Beauty of Fundamentals and Technicals Coming Together
17 November 2022 - 10:10AM
AllPennyStocks.com
In technical analysis, a stock bouncing upward off a similar
area is deemed a “multiple bottom,” a support pattern that is
highly sought by technical traders with little regard
for...
To read the full story on AllPennyStocks.com, click
here.
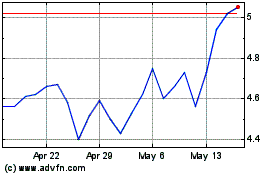
Eastman Kodak (NYSE:KODK)
Historical Stock Chart
From Apr 2024 to May 2024

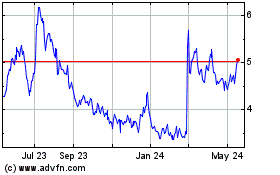
Eastman Kodak (NYSE:KODK)
Historical Stock Chart
From May 2023 to May 2024
