UNITED STATES
SECURITIES AND EXCHANGE COMMISSION
Washington D.C. 20549
Form 6-K
REPORT OF FOREIGN PRIVATE ISSUER PURSUANT TO
RULE 13A-16 OR 15D-16
UNDER THE SECURITIES EXCHANGE ACT OF 1934
For the month of September 2023
Commission File Number: 001-41641
SHL
TELEMEDICINE LTD.
(Translation of registrant’s
name into English)
90 Yigal Alon Street
Tel Aviv 67891, Israel
(Address of principal executive offices)
Indicate by check mark whether the registrant
files or will file annual reports under cover Form 20-F or Form 40-F.
Form 20-F
x Form 40-F
¨
EXPLANATORY NOTE
On September 21, 2023,
SHL Telemedicine Ltd. (the “Company”) issued a press release and an investor presentation with respect to its half-year
2023 fiscal results, copies of which are furnished herewith as Exhibits 99.1 and 99.2, respectively, and are incorporated by reference
herein. The press release and investor presentation contain forward-looking statements and include cautionary statements identifying important
factors that could cause actual results to differ materially from those in the forward-looking statements.
In addition, on the same day,
the Company issued a report (the “Report”) with respect to its half-year 2023 fiscal results, which contains unaudited
interim condensed consolidated financial statements as of and for the six months ended June 30, 2023. A copy of the Report is
furnished herewith as Exhibit 99.3 and incorporated by reference herein. The Report contains forward-looking statements and includes
cautionary statements identifying important factors that could cause actual results to differ materially from those in the forward-looking
statements.
This
Form 6-K is incorporated by reference into the Company's Registration Statement on Form S-8 filed with the Securities and Exchange Commission on June 9, 2023 (Registration No. 333-272546).
SIGNATURE
Pursuant to the requirements
of the Securities Exchange Act of 1934, the registrant has duly caused this report to be signed on its behalf by the undersigned, thereunto
duly authorized.
| By: | /s/ Amir Hai |
| | | Amir Hai |
| | | Chief Financial
Officer |
September 21, 2023
Exhibit 99.1

Press release
Ad hoc announcement pursuant to Art. 53 LR
SHL announces half-year results 2023 – strategic moves to
accelerate growth
Tel Aviv / Zurich
/ New York, 21 September 2023 – SHL Telemedicine Ltd. (NASDAQ: SHLT; SIX Swiss Exchange: SHLTN) (“SHL”
or the “Company”), a leading provider and developer of advanced personal telemedicine solutions, announced today its
results for half-year 2023, emphasizing stable revenues and strategic growth initiatives.
In H1 2023, SHL
maintained stable revenues while making significant strategic advancements across all operations. The Company made substantial investments
in Germany, where it launched the Doctors’ Virtual Visits services and then witnessed a steady increase in the adoption of the service.
In the US, the Company witnessed the growing utilization and distribution of the SmartHeart® ECG platform by top-tier strategic
customers, with ongoing rollouts to CVS MinuteClinic locations. Moreover, the Company’s long-standing operations in Israel remained
robust and profitable.
H1 2023 Financial Highlights:
*All comparable
previous periods figures are in constant currency1.
| · | Total revenues rose to USD 29.0m, a slight increase from USD 28.8m in 1HY2022. |
| · | Revenues from the Company’s operation in Israel increased by 3% compared
to 1HY2022, with revenues standing at USD 21.6m. |
| · | Revenues from the Company’s operation in Germany amounted to USD 6.8m,
slightly down from USD 7.0m in 1HY2022 but up from USD 6.7m in 2HY2022. |
| · | Adjusted EBITDA2 for the
Company was USD 0.4m, similar to USD 0.6m in 2HY2022 and down from USD 3.1m in 1HY2022, mainly due to increased investment in Germany
and in USA as well as Nasdaq® listing expenses. |
| · | Cash on hand and short-term cash investments as of June 30, 2023, remain
robust at USD 29.4m. |
| · | Net loss was USD 2.1m, compared to a net loss of USD 0.1m in 1HY2022. |
1 Constant currency – to enable
meaningful comparison between 1HY2023 and 2022 results, 2022 results are also presented at 1HY2023 exchange rates which are calculated
as annual average based on the average monthly exchange rates of each of the USD and the EUR versus the NIS, as published by the Bank
of Israel. The management believes that this presentation enables a more meaningful comparison between the periods due to the significant
fluctuations in NIS/USD/EUR exchange rates during the period.
2 Please see the EBITDA, Adjusted EBITDA and Adjusted EBIT
Table below, and Reconciliation Table of Adjusted EBITDA and Adjusted EBIT to net profit each presented below as required by the rules
of the U.S. Securities and Exchange Commission with respect to non-GAAP financial measures.
Strategic Developments and Upcoming Highlights:
| · | In the US, SHL has adjusted its strategy to prioritize direct-to-consumer
sales of the SmartHeart® ECG, viewing it as a move of considerable strategic importance. The direct-to-consumer sales are anticipated
to begin in the second half of 2023, and SHL will utilize its extensive network of US cardiologists for remote ECG evaluations. In parallel,
the Company is optimistically awaiting the results from the HELP-MI clinical trial conducted by Mayo Clinic which they believe will hold
significant value for its B2B plan of introducing the SmartHeart® platform to hospital systems. |
| · | The Company continues to see growing utilization
of its SmartHeart® platform by its Tier1 strategic customers including through the deployment of SmartHeart® in the CVS Minute
Clinics. |
| · | The Company is eagerly anticipating the outcomes
of clinical trials led by Mayo Clinic and Imperial College London, both relating to the utilization of SmartHeart® 12-lead ECG technology
for remote monitoring of post-MI (heart attack) patients at home, examining the reduction in the rate of visits to Emergency Department
and hospital readmissions. Preliminary results showcased at the Imperial Vulnerable Plaque and Patient Meeting 2023 (VPM) indicate significant
benefits, reinforcing SHL's position in the field. |
| · | In Israel, SHL's B2C subscription activity is
showing growth, and the Company has begun introducing new products and services this year, despite local political challenges, thus expanding
the use of both its B2C and B2B infrastructures. |
| · | The Company recently launched the Doctors’ Virtual Visit service in
Germany providing this offering to approximately 12.4 million individuals insured by BARMER and AOK Plus. The Company continues to witness
a consistent increase in the adoption of the service and believes it will serve as promising new growth engine for its operation in the
German market. |
| · | During April 2023, the Company’s ADR’s commenced trading
on the Nasdaq®. |
Erez Nachtomy,
CEO of SHL, commented: “This half-year showcases our resilience and adaptability in the face of market challenges. Our consistent
performance in Israel, the promising Virtual Visit growth engine in Germany, alongside our strategy prioritization in the US underline
our commitment to innovation and excellence. Our investments in technology and strategic relationships, especially with esteemed entities
like CVS, Henry Schein, and the Mayo Clinic, position us at the forefront of telemedicine. As we navigate the evolving healthcare landscape,
our primary focus remains delivering unparalleled value to our customers and stakeholders while championing the transformative power of
telemedicine."
Conference Call at 4 pm CET
The Company will host a conference call for investors, journalists
and analysts to discuss the Half-Year 2023 results today at 4 pm CET. The conference call will be hosted by Erez Nachtomy, CEO, and Amir
Hai, CFO and will be held in English.
Dial-in numbers:
From Europe: +41 (0)58 310 50 00
From UK: +44 (0) 207 107 06 13
From USA: +1 (1) 631 570 56 13
From Israel: Toll free: 1 80 921 44 27 / Local:
+972 3763 1173
The conference call is scheduled to last approximately 45 minutes.
The presentation is available on: www.shl-telemedicine.com/reports
The Half-Year Report 2023 is available
on: www.shl-telemedicine.com/reports
SEC submission of the Half-Year Report and presentation is available
on:
https://www.shl-telemedicine.com/sec-filing/
About SHL Telemedicine
SHL Telemedicine is engaged in developing
and marketing personal telemedicine systems and the provision of medical call center services, with a focus on cardiovascular and related
diseases, to end users and to the healthcare community. SHL Telemedicine offers its services and personal telemedicine devices to subscribers
utilizing telephonic and Internet communication technology. SHL is listed on the SIX Swiss Exchange (SHLTN, ISIN: IL0010855885, Security
No.: 1128957) and on the Nasdaq Stock Exchange (SHLT, ISIN: US78423T2006, CUSIP: 78423T200). For more information, please visit our
web site at www.shl-telemedicine.com.
Financial calendar
7 December 2023, Annual General Meeting.
Tel Aviv, Israel
For more financial information:
For a comprehensive
understanding of the Company’s financial reports and related management’s discussion and analysis for applicable periods,
please visit the Company’s profile at https://www.sec.gov/edgar or the Company’s full report on its site: www.shl-telemedicine.com/reports
For further information please contact:
Fabienne Farner, IRF, Phone :
+41 43 244 81 42, farner@irf-reputation.ch
Key Figures for 1H2023
Key figures (as reported):
| in USD million (except per share amounts) | |
HY2023 | | |
HY2022 | | |
% change | |
| Revenues for the period | |
| 29.0 | | |
| 30.9 | | |
| (6 | ) |
| Revenues | |
| | | |
| | | |
| | |
| Revenues | |
| | | |
| | | |
| | |
| · Germany | |
| 6.8 | | |
| 7.1 | | |
| (4 | ) |
| · Israel | |
| 21.6 | | |
| 23.0 | | |
| (6 | ) |
| · Rest of the World | |
| 0.6 | | |
| 0.8 | | |
| (25 | ) |
| EBIT | |
| (4.4 | ) | |
| (1.0 | ) | |
| | |
| EBITDA* | |
| (0.9 | ) | |
| 2.4 | | |
| | |
| Net profit (loss) | |
| (2.1 | ) | |
| 0.1 | | |
| | |
| EPS (Basic loss) | |
| (0.14 | ) | |
| 0.00 | | |
| | |
| Operating cash flow | |
| (3.3 | ) | |
| 1.7 | | |
| | |
* EBITDA: operating profit excluding depreciation
and amortization expenses of USD 3.5m, and USD 3.4m in the comparable period
Adjusted key figures (in constant currency):
In the table below, HY2022 results have been presented
at HY2023 exchange rates. Management believes that this presentation enables a more meaningful comparison between the periods due to the
significant fluctuations in NIS/USD/EUR exchange rates during the period.
| In USD million | |
HY2023 | | |
HY2022 | | |
% change | |
| Revenues | |
| 29.0 | | |
| 28.8 | | |
| 1 | |
| Revenues | |
| | | |
| | | |
| | |
| · Germany | |
| 6.8 | | |
| 7.0 | | |
| (3 | ) |
| · Israel | |
| 21.6 | | |
| 21.0 | | |
| 3 | |
| · Rest of the World | |
| 0.6 | | |
| 0.8 | | |
| (25 | ) |
| Adjusted EBIT** | |
| (3.1 | ) | |
| (0.1 | ) | |
| | |
| Adjusted EBITDA *** | |
| 0.4 | | |
| 3.1 | | |
| | |
**Adjusted EBIT: Please see the EBITDA, Adjusted
EBITDA and Adjusted EBIT Table below.
***Adjusted EBITDA: Please see the EBITDA, Adjusted EBITDA and Adjusted
EBIT Table below.
EBITDA, Adjusted EBITDA and Adjusted EBIT Tables (HY2022 results
are presented in HY2023 exchange rates)
| EBITDA: | |
| | |
| |
| in USD Thousand | |
HY2023 | | |
HY2022 | |
| Operating loss | |
| (4.4 | ) | |
| (1.1 | ) |
| Plus: | |
| | | |
| | |
| Depreciation and amortization expenses | |
| 3.5 | | |
| 3.2 | |
| | |
| | | |
| | |
| EBITDA | |
| (0.9 | ) | |
| 2.1 | |
| | |
HY2023 | | |
HY2022 | |
| Operating loss – EBIT | |
| (4.4 | ) | |
| (1.1 | ) |
| Plus: | |
| | | |
| | |
| Cost of share-based payments | |
| 0.8 | | |
| 0.9 | |
| Non-recurring expenses | |
| 0.5 | | |
| 0.1 | |
| Adjusted EBIT | |
| (3.1 | ) | |
| (0.1 | ) |
| | |
HY2023 | | |
HY2022 | |
| EBITDA | |
| (0.9 | ) | |
| 2.1 | |
| Plus: | |
| | | |
| | |
| Cost of share based payments | |
| 0.8 | | |
| 0.9 | |
| Non-recurring expenses | |
| 0.5 | | |
| 0.1 | |
| Adjusted EBITDA | |
| 0.4 | | |
| 3.1 | |
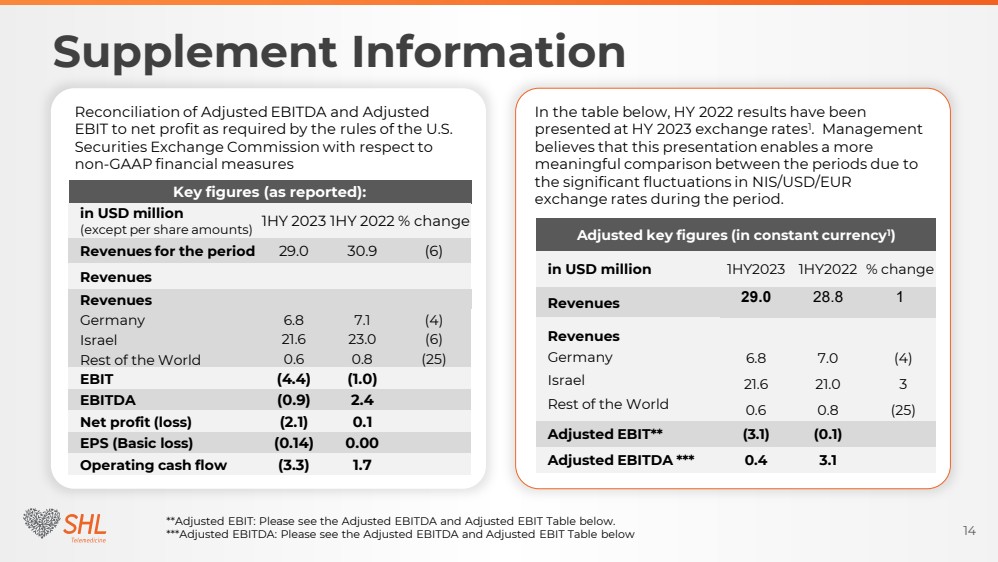
Reconciliation of Adjusted EBITDA and Adjusted
EBIT to net profit as required by the rules of the U.S. Securities and Exchange Commission with respect to non-GAAP financial measures
(HY2022 results are presented also in HY2023 exchange rates)
| | |
HY2023 | | |
HY2022 | | |
HY2022(CC) | |
| Net profit (loss) | |
| (2.1 | ) | |
| 0.1 | | |
| (0.1 | ) |
| Financial income, net | |
| (3.0 | ) | |
| (1.3 | ) | |
| (1.2 | ) |
| Tax expenses | |
| 0.7 | | |
| 0.2 | | |
| 0.2 | |
| Depreciation and amortization expenses | |
| 3.5 | | |
| 3.4 | | |
| 3.2 | |
| | |
| | | |
| | | |
| | |
| EBITDA | |
| (0.9 | ) | |
| 2.4 | | |
| 2.1 | |
| | |
| | | |
| | | |
| | |
| Cost of share-based payment | |
| 0.8 | | |
| 1.0 | | |
| 0.9 | |
| Non- recurring expenses | |
| 0.5 | | |
| 0.1 | | |
| 0.1 | |
| | |
| | | |
| | | |
| | |
| Adjusted EBITDA | |
| 0.4 | | |
| 3.5 | | |
| 3.1 | |
The Company believes Adjusted EBITDA and Adjusted EBIT provide useful information regarding the Company’s financial and operating
performance. Adjusted EBITDA and Adjusted EBIT are not U.S. GAAP measures. You should not construe Adjusted EBITDA and Adjusted EBIT as
alternatives to operating profit or cash flows from operating activities determined in accordance with U.S. GAAP or as a measure of liquidity.
Adjusted EBITDA and Adjusted EBIT are not defined in the same manner by all companies and may not be comparable to other similarly titled
measures of other companies.
Forward Looking Statements:
This announcement contains “forward-looking
statements” within the meaning of the U.S. Private Securities Litigation Reform Act of 1995, specifically Section 27A of the
U.S. Securities Act of 1933, as amended, and Section 21E of the U.S. Securities Exchange Act of 1934, as amended. All statements,
other than statements of historical facts, are forward-looking statements, including, the Company’s anticipation with respect to
changes in its results of operations from prior periods. Readers are cautioned that forward-looking statements are not guarantees of future
performance and involve known and unknown risks, uncertainties and other factors that could cause actual results to differ materially
from historical results or any future results expressed or implied by forward-looking statements. Factors that can cause actual results
to differ from expectations and those contained in forward-looking statements include those risks described in Item 3.D. “Key Information—Risk
Factors” contained in the Company’s Registration Statement on Form 20-F filed with the U.S. Securities Exchange Commission
(the “SEC”) on March 28, 2023 and in its subsequent filings and submissions with the SEC, including, but not limited
to, the Company’s ability to operate and comply with the complex and evolving regulations in the highly regulated healthcare industry;
the continued development, consumer acceptance and market adoption of the Company’s products and services in the relatively new,
unproven and volatile and rapidly changing telehealth market; the Company’s ability to develop and introduce new products and solutions
and enhancements to existing ones; the significant and increasing levels of competition in the telemedicine market; the impacts of COVID-19
and future pandemics and epidemics; the Company’s ability to continue to attract and retain key employees and personal in the highly
competitive healthcare industry; the loss or breach of the Company’s proprietary rights and data security and privacy risks; political,
judicial, legal, economic and military conditions in Israel and the surrounding region; global economic and financial market conditions
and the Company’s ability to adapt to and comply with the different business and market factors, conditions, requirements and laws
and regulations in the various countries in which the Company operates internationally; currency fluctuations; labor disputes; the Company’s
ability to manage growth and integrate acquired businesses and expanding operations; the Company’s ability to obtain adequate levels
of insurance to cover potential losses; the Company’s dependence on key suppliers and sub-contractors and other third parties; and
other matters and risks not yet known to the Company or not currently considered material by it. You should not place undue reliance on
these forward-looking statements. All written and oral forward-looking statements, attributable to the Company, or persons acting on its
behalf, are qualified in their entirety by these cautionary statements. Unless required by law, the Company undertakes no obligation to
publicly update or revise any forward-looking statements.
Exhibit 99.2

| SHL
Telemedicine
HY Results 2023
Presentation
1 |
| Forward looking statements
2
This presentation was prepared for the purpose of providing and presenting information in a summary only and cannot replace a review of the reports of SHL
Telemedicine (hereinafter: "the Company"). Many of the statements included in this presentation, as well as oral statements that may be made by us or by officers,
directors or employees acting on behalf of us, contain “forward-looking statements” within the meaning of the U.S. Private Securities Litigation Reform Act of 1995,
specifically Section 27A of the U.S. Securities Act of 1933, as amended, and Section 21E of the U.S. Securities Exchange Act of 1934, as amended. All statements, other than
statements of historical facts, are forward-looking statements. Readers are cautioned that forward-looking statements are not guarantees of future performance and
involve known and unknown risks, uncertainties and other factors that could cause actual results to differ materially from historical results or any future results expressed
or implied by forward-looking statements. Factors that can cause actual results to differ from expectations and those contained in forward-looking statements include
those risks described in Item 3.D. “Key Information—Risk Factors” contained in the Company’s Registration Statement on Form 20-F or most recent Annual Report on
Form 20-F filed with the U.S. Securities Exchange Commission (the “SEC”) and in its subsequent filings and submissions with the SEC, including, but not limited to, the
Company’s ability to operate and comply with the complex and evolving regulations in the highly regulated healthcare industry; continued development, consumer
acceptance and market adoption in the relatively new, unproven and volatile and rapidly changing telehealth market; the Company’s ability to develop and introduce
new products and solutions and enhancements to existing ones; the significant and increasing levels of competition in the telemedicine market; the impacts of COVID-19
and future pandemics and epidemics; the Company’s ability to continue to attract and retain key employees and personal in the highly competitive healthcare industry;
the loss or breach of the Company’s proprietary rights and data security and privacy risks; political, judicial, legal, economic and military conditions in Israel and the
surrounding region; global economic and financial market conditions and the Company’s ability to adapt to and comply with the different business and market factors,
conditions, requirements and laws and regulations in the various countries in which the Company operates internationally; currency fluctuations; labor disputes; the
Company’s ability to manage growth and integrate acquired businesses and expanding operations; the Company’s ability to obtain adequate levels of insurance to cover
potential losses; the Company’s dependence on key suppliers and sub-contractors and other third parties; and other matters and risks not yet known to the Company or
not currently considered material by it. You should not place undue reliance on these forward-looking statements. All written and oral forward-looking statements,
attributable to the Company, or persons acting on its behalf, are qualified in their entirety by these cautionary statements.
For the avoidance of doubt, it is clarified that the company does not undertake to update the information, in whole or in part, contained in this presentation, whether as a
result of new information, a future event or for other reasons, except as required by law. It is also clarified that the company's plans and strategy contained in this
presentation are correct at the time of their publication and can and will change in accordance with the decisions of the company's board of directors, as they will be
from time to time, and/or due to their being dependent, in whole or in part, on third parties that are not under the control of the company as well as on additional risk
factors to which the company is exposed .
This presentation contains trade names, trademarks and service marks of other companies. The trade names, trademarks, and service marks of other parties are not used
or displayed to imply a relationship with, or endorsement or sponsorship of, those other parties. |
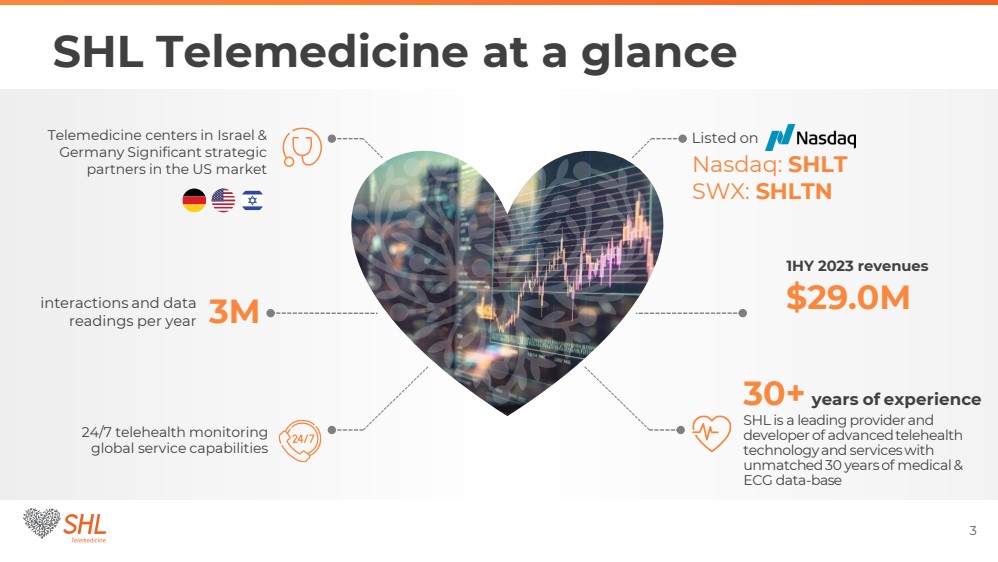
| SHL Telemedicine at a glance
3
Nasdaq: SHLT
SWX: SHLTN
Listed on
$29.0M
1HY 2023 revenues
30+ years of experience
SHL is a leading provider and
developer of advanced telehealth
technology and services with
unmatched 30 years of medical &
ECG data-base
24/7 telehealth monitoring
global service capabilities
interactions and data
readings per year 3M
Telemedicine centers in Israel &
Germany Significant strategic
partners in the US market |

| R&D Gross Expenses
$3.6M
REVENUES Operational CASH Flow
$29.0M
Adjusted EBITDA(*)
$ 0.4M
CASH On Hand
~$28.6M
Currently
CASH On HAND
$29.4M
30 June 2023
(*) Please see Supplemental Information at end of presentation for a reconciliation of Adjusted EBITDA and Adjusted EBIT to net profit as required by the
rules of the U.S. Securities Exchange Commission with respect to non-GAAP financial measures
HY 2023 Overview Financial Data(*)
4
$ (3.3)M |

| Germany:
A promising new growth engine
5
Remote medical services such as: Virtual Visit and
Monitoring of chronic patients, are becoming the
Standard of Care
The company has agreements with leading health
insurers, covering about 30% of the German health
insurance market (about 25 million insured)
SHL is the market leader in Germany and operates
in a B2B model - managing and stabilizing chronic
patients and saving costs for health insurers
1HY2022 2HY2022 1HY2023
REVENUES
$6.8M
Adjusted
EBITDA(**)
$(1.2)M
REVENUES(*)
$6.7M
Adjusted
EBITDA(**)
$(0.3)M
REVENUES(*)
$7.0M
Adjusted
EBITDA(**)
$(0.1)M
(*) compared to 1HY 2022 in constant currency, Please see Supplemental Information at end of presentation for a description of the basis of presentation of the
constant currency amount calculations as required by the rules of the U.S. Securities Exchange Commission with respect to non-GAAP financial measures
(**) Please see Supplemental Information at end of presentation for a reconciliation of Adjusted EBITDA and Adjusted EBIT to net profit as required by the rules of
the U.S. Securities Exchange Commission with respect to non-GAAP financial measures |
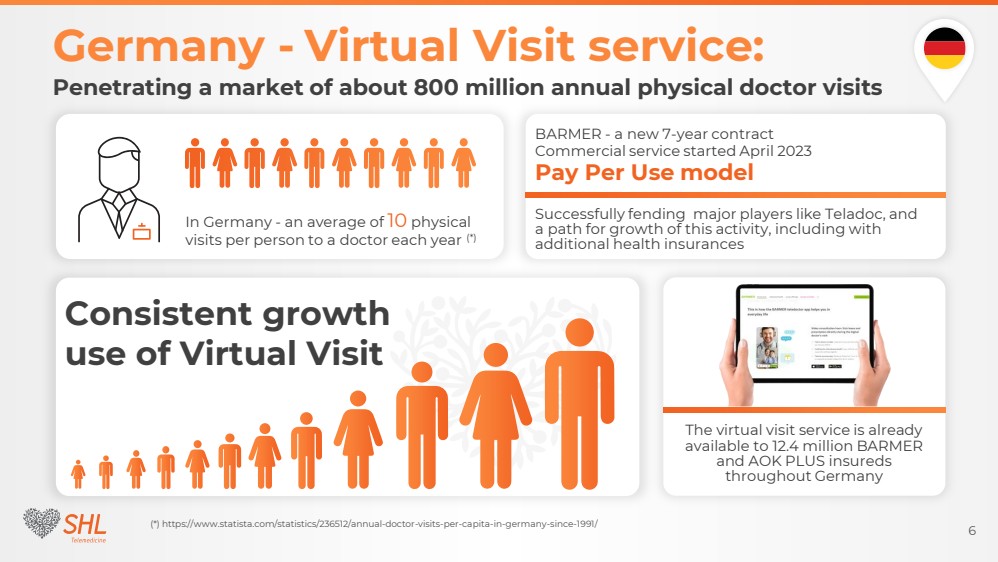
| Germany - Virtual Visit service:
6
Penetrating a market of about 800 million annual physical doctor visits
(*) https://www.statista.com/statistics/236512/annual-doctor-visits-per-capita-in-germany-since-1991/
The virtual visit service is already
available to 12.4 million BARMER
and AOK PLUS insureds
throughout Germany
Successfully fending major players like Teladoc, and
a path for growth of this activity, including with
additional health insurances
BARMER - a new 7-year contract
Commercial service started April 2023
In Germany - an average of 10 physical
visits per person to a doctor each year (*)
Consistent growth
use of Virtual Visit
Pay Per Use model |
| ECG
repository
Cloud
based
24/7 ECG
review center
24/7 USA
cardiologist
network
Provider
portal
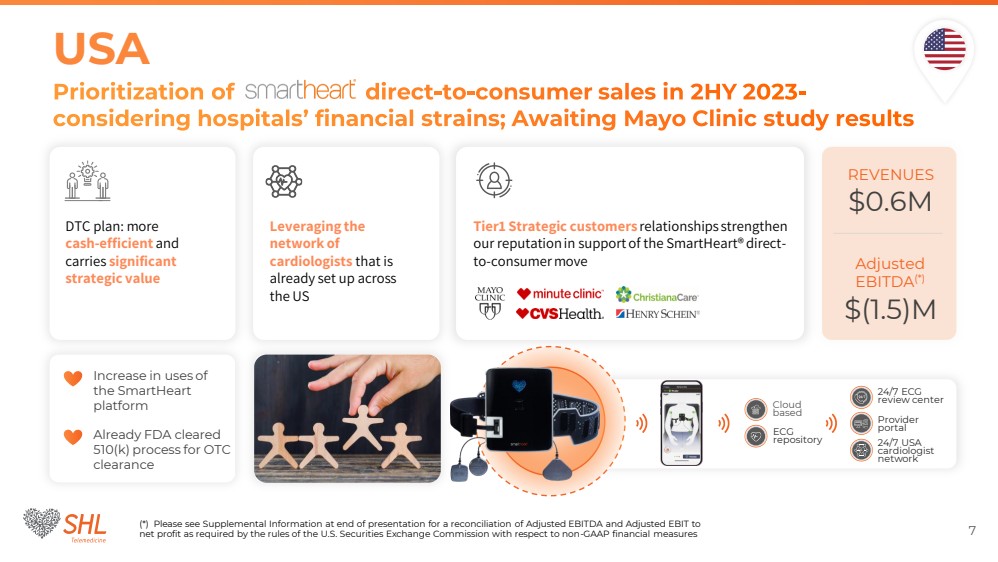
USA
7
Prioritization of direct-to-consumer sales in 2HY 2023-
considering hospitals’ financial strains; Awaiting Mayo Clinic study results
Increase in uses of
the SmartHeart
platform
DTC plan: more
cash-efficient and
carries significant
strategic value
(*) Please see Supplemental Information at end of presentation for a reconciliation of Adjusted EBITDA and Adjusted EBIT to
net profit as required by the rules of the U.S. Securities Exchange Commission with respect to non-GAAP financial measures
REVENUES
$0.6M
Adjusted
EBITDA(*)
$(1.5)M
Tier1 Strategic customers relationships strengthen
our reputation in support of the SmartHeart® direct-to-consumer move
Leveraging the
network of
cardiologists that is
already set up across
the US
Already FDA cleared
510(k) process for OTC
clearance |
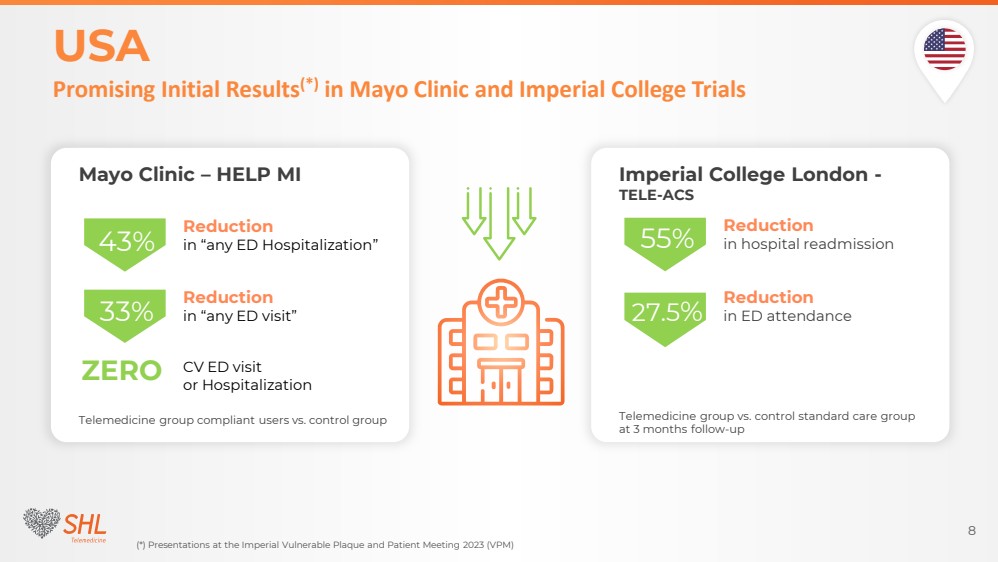
| USA
8
Promising Initial Results(*) in Mayo Clinic and Imperial College Trials
(*) Presentations at the Imperial Vulnerable Plaque and Patient Meeting 2023 (VPM)
Mayo Clinic – HELP MI
Reduction
in “any ED Hospitalization”
Reduction
in “any ED visit”
CV ED visit
or Hospitalization
Telemedicine group compliant users vs. control group
43%
ZERO
33%
Imperial College London -
TELE-ACS
Reduction
in hospital readmission
Reduction
in ED attendance
Telemedicine group vs. control standard care group
at 3 months follow-up
55%
27.5% |
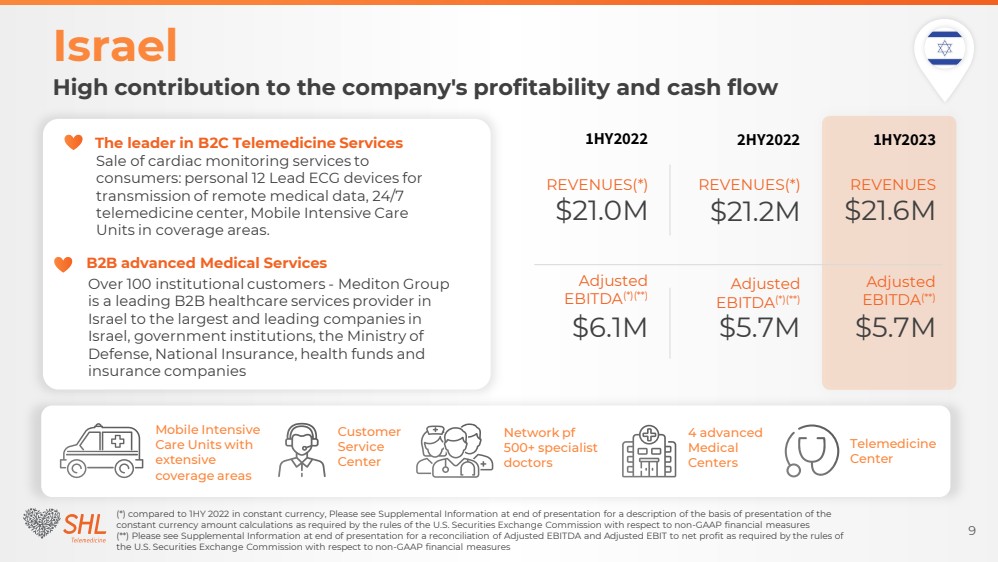
| Israel
9
High contribution to the company's profitability and cash flow
The leader in B2C Telemedicine Services
B2B advanced Medical Services
Sale of cardiac monitoring services to
consumers: personal 12 Lead ECG devices for
transmission of remote medical data, 24/7
telemedicine center, Mobile Intensive Care
Units in coverage areas.
Over 100 institutional customers - Mediton Group
is a leading B2B healthcare services provider in
Israel to the largest and leading companies in
Israel, government institutions, the Ministry of
Defense, National Insurance, health funds and
insurance companies
(*) compared to 1HY 2022 in constant currency, Please see Supplemental Information at end of presentation for a description of the basis of presentation of the
constant currency amount calculations as required by the rules of the U.S. Securities Exchange Commission with respect to non-GAAP financial measures
(**) Please see Supplemental Information at end of presentation for a reconciliation of Adjusted EBITDA and Adjusted EBIT to net profit as required by the rules of
the U.S. Securities Exchange Commission with respect to non-GAAP financial measures
Telemedicine
Center
4 advanced
Medical
Centers
Network pf
500+ specialist
doctors
Customer
Service
Center
Mobile Intensive
Care Units with
extensive
coverage areas
1HY2022 2HY2022 1HY2023
REVENUES
$21.6M
Adjusted
EBITDA(**)
$5.7M
REVENUES(*)
$21.2M
Adjusted
EBITDA(*)(**)
$5.7M
REVENUES(*)
$21.0M
Adjusted
EBITDA(*)(**)
$6.1M |
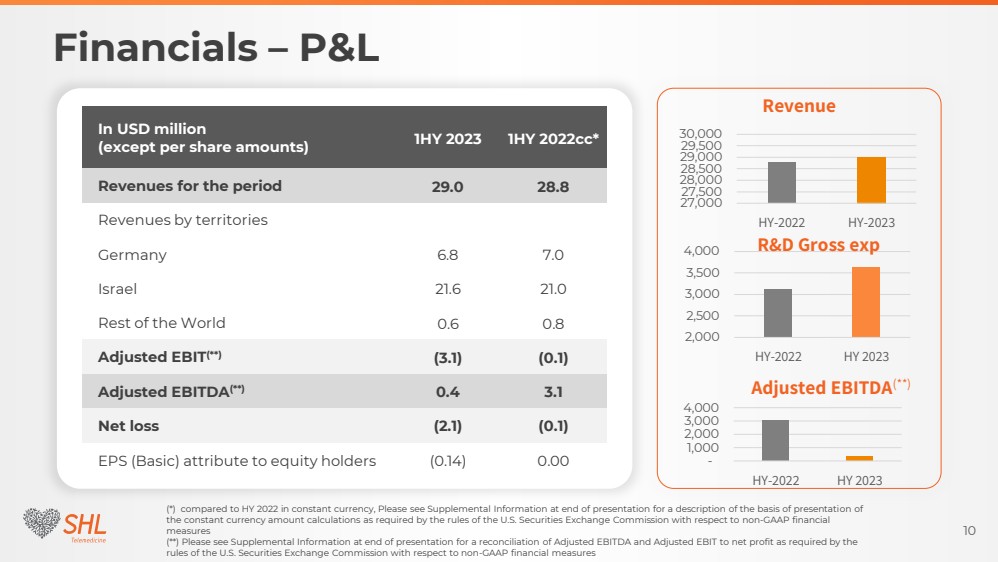
| Financials – P&L
10
(*) compared to HY 2022 in constant currency, Please see Supplemental Information at end of presentation for a description of the basis of presentation of
the constant currency amount calculations as required by the rules of the U.S. Securities Exchange Commission with respect to non-GAAP financial
measures
(**) Please see Supplemental Information at end of presentation for a reconciliation of Adjusted EBITDA and Adjusted EBIT to net profit as required by the
rules of the U.S. Securities Exchange Commission with respect to non-GAAP financial measures
In USD million
(except per share amounts) 1HY 2023 1HY 2022cc*
Revenues for the period 29.0 28.8
Revenues by territories
Germany 6.8 7.0
Israel 21.6 21.0
Rest of the World 0.6 0.8
Adjusted EBIT(**) (3.1) (0.1)
Adjusted EBITDA(**) 0.4 3.1
Net loss (2.1) (0.1)
EPS (Basic) attribute to equity holders (0.14) 0.00
27,000
27,500
28,000
28,500
29,000
29,500
30,000
HY-2022 HY-2023
Revenue
2,000
2,500
3,000
3,500
4,000
HY-2022 HY 2023
R&D Gross exp
-
1,000
2,000
3,000
4,000
HY-2022 HY 2023
Adjusted EBITDA(**) |

| Financials – Balance sheet & Cash flow
11
In USD million 1HY 2023 1HY 2022
Cash and cash equivalents 10.4 16.4
Short term investments 19.0 8.7
Total cash and short-term investments 29.4 25.1
Short term bank debt 2.1 2.2
Long term bank debt 11.3 14.2
Total bank debt 13.4 16.4
Capital and reserves 151.8 125.0
Accumulated deficit (75.3) (73.0)
Total Equity 76.5 52.0
Increase (Decrease) in cash and short-term investments 10.7 (6.9)
Operational cash flow (3.3) 1.7
100
110
120
130
HY-2022 HY 2023
Total Assets |
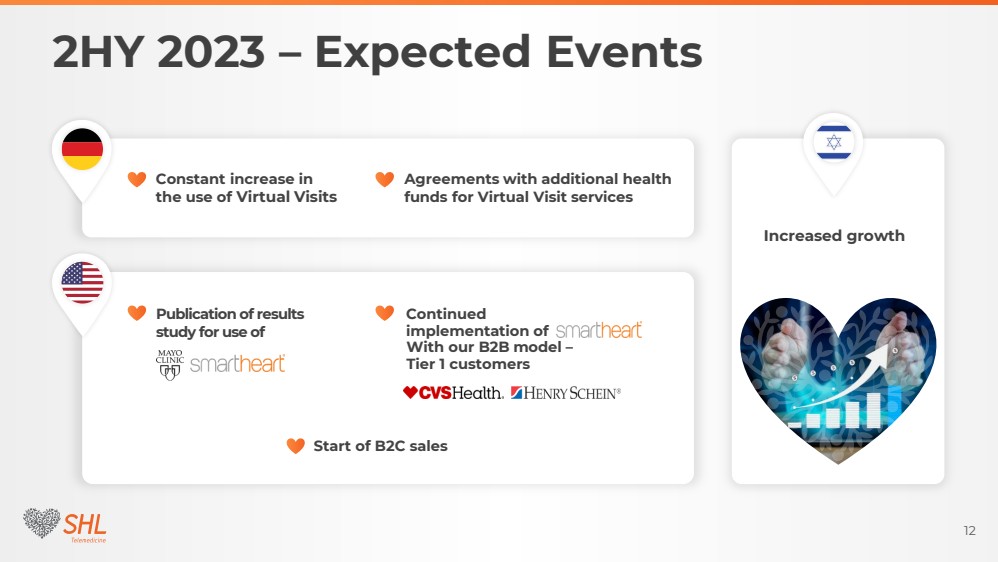
| 2HY 2023 – Expected Events
12
Constant increase in
the use of Virtual Visits
Agreements with additional health
funds for Virtual Visit services
With our B2B model –
Tier 1 customers
Start of B2C sales
Publication of results
study for use of
Continued
implementation of
Increased growth |

| Thank You
SHL Telemedicine
13 |
| Supplement Information
14
**Adjusted EBIT: Please see the Adjusted EBITDA and Adjusted EBIT Table below.
***Adjusted EBITDA: Please see the Adjusted EBITDA and Adjusted EBIT Table below
In the table below, HY 2022 results have been
presented at HY 2023 exchange rates1
.. Management
believes that this presentation enables a more
meaningful comparison between the periods due to
the significant fluctuations in NIS/USD/EUR
exchange rates during the period.
Adjusted key figures (in constant currency1
)
in USD million 1HY2023 1HY2022 % change
Revenues 29.0 28.8 1
Revenues
Germany
Israel
Rest of the World
6.8 7.0 (4)
21.6 21.0 3
0.6 0.8 (25)
Adjusted EBIT** (3.1) (0.1)
Adjusted EBITDA *** 0.4 3.1
Key figures (as reported):
in USD million
(except per share amounts) 1HY 2023 1HY 2022 % change
Revenues for the period 29.0 30.9 (6)
Revenues
Revenues
Germany
Israel
Rest of the World
6.8 7.1 (4)
21.6 23.0 (6)
0.6 0.8 (25)
EBIT (4.4) (1.0)
EBITDA (0.9) 2.4
Net profit (loss) (2.1) 0.1
EPS (Basic loss) (0.14) 0.00
Operating cash flow (3.3) 1.7
Reconciliation of Adjusted EBITDA and Adjusted
EBIT to net profit as required by the rules of the U.S.
Securities Exchange Commission with respect to
non-GAAP financial measures |
| Supplement Information
15
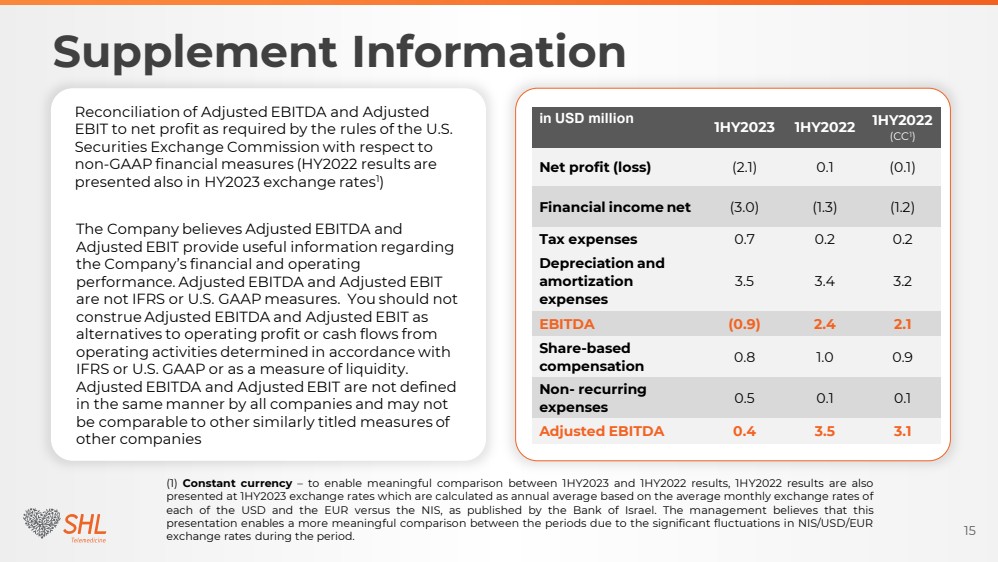
(1) Constant currency – to enable meaningful comparison between 1HY2023 and 1HY2022 results, 1HY2022 results are also
presented at 1HY2023 exchange rates which are calculated as annual average based on the average monthly exchange rates of
each of the USD and the EUR versus the NIS, as published by the Bank of Israel. The management believes that this
presentation enables a more meaningful comparison between the periods due to the significant fluctuations in NIS/USD/EUR
exchange rates during the period.
Reconciliation of Adjusted EBITDA and Adjusted
EBIT to net profit as required by the rules of the U.S.
Securities Exchange Commission with respect to
non-GAAP financial measures (HY2022 results are
presented also in HY2023 exchange rates1
)
The Company believes Adjusted EBITDA and
Adjusted EBIT provide useful information regarding
the Company’s financial and operating
performance. Adjusted EBITDA and Adjusted EBIT
are not IFRS or U.S. GAAP measures. You should not
construe Adjusted EBITDA and Adjusted EBIT as
alternatives to operating profit or cash flows from
operating activities determined in accordance with
IFRS or U.S. GAAP or as a measure of liquidity.
Adjusted EBITDA and Adjusted EBIT are not defined
in the same manner by all companies and may not
be comparable to other similarly titled measures of
other companies
in USD million 1HY2023 1HY2022 1HY2022
(CC1
)
Net profit (loss) (2.1) 0.1 (0.1)
Financial income net (3.0) (1.3) (1.2)
Tax expenses 0.7 0.2 0.2
Depreciation and
amortization
expenses
3.5 3.4 3.2
EBITDA (0.9) 2.4 2.1
Share-based
compensation 0.8 1.0 0.9
Non- recurring
expenses
0.5 0.1 0.1
Adjusted EBITDA 0.4 3.5 3.1 |
Exhibit 99.3

| Half Year Report 2023 |

| 2
SHL Telemedicine Ltd.
1 January - 30 June, 2023
Letter to Shareholders
Dear Shareholders
Looking at the first half of 2023, we maintained
stable revenues while making significant
strategic advancements across all operations,
while maintaining a robust cash position,
despite challenging market conditions and
shifts in the financial markets.
The prevailing macro challenges in the
healthcare industry underscore the growing
demand for telemedicine technology and
services. Our solutions not only enhance access
and care outcomes but also reduce costs for our
customers. With a robust foundation in Israel,
promising infrastructure in Germany, and key
collaborations in the US with Tier 1 customers
including CVS, Henry Schein and Mayo Clinic,
our financial position remains strong. We are
steadfast in our balanced growth strategy.
During the period, the company commenced
trading of the Nasdaq® and the Company’s
American Depositary Shares (“ADRs”), trade
on Nasdaq® (symbol “SHLT”), in parallel to the
company’s ordinary shares continuing to be
listed on the Swiss Stock Exchange.
Overall, revenues for the period were USD 29.0
million, a slight increase compared to USD 28.8
million observed in the first half of 2022 when
adjusted for constant currency. Adjusted EBITDA1
for the period was USD 0.4 million, a decrease
compared to USD 3.1 million in the first half
of 2022 when adjusted for constant currency,
and similar compared to USD 0.6 million in the
second half of 2022 when adjusted for constant
currency. The decrease is mainly related to
increased investment in Germany and the USA as
well as Nasdaq listing expenses. This resulted in a
negative operating cash flow of USD 3.3 million,
compared to positive operating cash flow of
USD 1.7 million in the first half of 2022. Net loss
for the period was USD 2.1 million, compared to a
small net loss of USD 0.1 million in the first half of
2022 when adjusted for constant currency.
Germany
Revenues were USD 6.8 million, slightly down
from USD 7.0 million in the first half of 2022
when adjusted for constant currency, but up
from USD 6.7 million in the second half of
2022 in constant currency. The commercial
service of the Virtual Visits to the BARMER
insureds across Germany started during April
2023. Barmer is one of the three largest health
insurers in Germany serving about 8.7 million
1 EBITDA excluding stock base compensation expenses and
extraordinary expenses.
Letter to Shareholders |

| Letter to Shareholders
3
insured, and AOK PLUS is another large health
insurer in Germany serving about 3.5 million
insureds, which together brings SHL to over
12.5 million insureds in Germany who can
now use this service. The investments in the
German operation during the period, mainly
in R&D costs related to the Virtual Visit service
resulted in a negative contribution of about
USD 1.2 million. We are witnessing a steady
increase in the adoption of the Doctors’ Virtual
Visit services and believe it is a promising new
growth engine for the German operation.
USA
In the US revenues in the first half of 2023
were USD 0.6 million. We adjusted our strategy
to prioritize direct-to-consumer sales of the
SmartHeart® ECG, viewing it as a move of
considerable strategic importance. The direct-to-consumer sales of SmartHeart® will start already
during the second half of 2023 and will utilize the
infrastructure of a network of cardiologists that
is already set up across the US and is available
to perform a remote review and interpretation of
SmartHeart® ECG from anywhere. In parallel, we
are optimistically awaiting the results from the
HELP-MI clinical trial conducted by Mayo Clinic
which we believe will hold significant value for
our B2B plan of introducing the SmartHeart®
platform to hospital systems. We continue to see
growing utilization of our SmartHeart® platform
by Tier1 strategic customers including through
the deployment of SmartHeart® in the CVS
MinuteClincs. These relationships will bolster our
credibility and augment our SmartHeart® direct-to-consumer move.
During the second part of 2023 the company
expects results from the HELP-MI clinical trial
conducted by Mayo Clinic, as well as from
another clinical trial conducted by Imperial
College London. Both trials relate to the
utilization of the SmartHeart® 12-lead ECG
technology for remote monitoring of post-MI
(heart attack) patients at home. Very positive
and strong initial results from these trials were
recently presented at the highly regarded
Imperial Vulnerable Plaque and Patient Meeting
2023 (VPM) showing meaningful reduction in
the rate of readmissions and visits to Emergency
Department of post-ACS (Acute Coronary
Syndrome) patients that are telemonitored at
home with SmartHeart®. These initial results
reflect our accumulated experience in this field,
will lead to material cost savings to hospital
systems and will support a compelling business
case for SmartHeart® with hospital systems.
Israel
Revenues increased by 3% to USD 21.6 million,
compared to USD 21.0 in the first half of 2022
when adjusted for constant currency. Our B2C
private-pay subscription activity is stable with
moderate growth compared to the first half of
2022 as well as the second half of 2022. We
began expanding the use of both the B2C and
B2B operations and infrastructures, and expect
to add new products and services in all sectors
of our activity in Israel, already this year.
On behalf of the Board of Directors and the
management team, we thank all employees for
their hard work and our business partners and
shareholders for the trust they have placed in SHL.
Sincerely,
Ehud Barak Yariv Alroy Erez Nachtomy
Co-Chairman Co-Chairman CEO
of the Board of the Board |

| Financial Statements
4
INDEX
5 | Review of Interim Condensed Consolidated Financial Statements
6 | Consolidated Balance Sheets
8 | Consolidated Statements of Comprehensive Income
9 | Consolidated Statements of Changes in Equity
11 | Consolidated Statements of Cash Flows
13 | Notes to Interim Condensed Consolidated Financial Statements |

| Financial Statements
5
The Shareholders and Board of Directors
SHL Telemedicine Ltd.
Auditors’ review report to the shareholders and board of directers of SHL Telemedicine Ltd.
Introduction
We have reviewed the accompanying interim
condensed consolidated financial statements of
SHL Telemedicine Ltd. (“the Company”) and its
subsidiaries as of June 30, 2023, which comprise
the interim consolidated balance sheet as of June
30, 2023, and the related interim consolidated
statements of comprehensive income, changes in
equity and cash flows for the six month period
then ended and explanatory notes. Management is
responsible for the preparation and presentation
of this interim financial information in accordance
with International Accounting Standard 34,
“Interim Financial Reporting” (“IAS 34”). Our
responsibility is to express a conclusion on this
interim financial information based on our review.
Scope of review
We conducted our review in accordance with
International Standard on Review Engagements
2410, “Review of Interim Financial Information
Performed by the Independent Auditor of the
Entity”. A review of interim financial information
consists of making inquiries, primarily of
persons responsible for financial and accounting
matters, and applying analytical and other
review procedures. A review is substantially less
in scope than an audit conducted in accordance
with International Standards on Auditing and
consequently does not enable us to obtain
assurance that we would become aware of all
significant matters that might be identified in an
audit. Accordingly, we do not express an audit
opinion.
Conclusion
Based on our review, nothing has come to
our attention that causes us to believe that the
accompanying interim condensed consolidated
financial statements are not prepared, in all
material respects, in accordance with IAS 34.
Tel-Aviv, Israel
September 20, 2023
KOST FORER GABBAY & KASIERER
A Member of Ernst & Young Global |

| Financial Statements
6
CONSOLIDATED BALANCE SHEETS U.S. dollars in thousands
June 30, December 31,
2023 2022 2022
Unaudited Audited
ASSETS
CURRENT ASSETS:
Cash and cash equivalents 10,435 16,416 4,483
Short-term investments 19,004 8,718 14,217
Trade receivables 8,788 7,293 7,797
Inventory 3,995 4,954 3,879
Other accounts receivable 2,176 1,213 1,912
44,398 38,594 32,288
NON-CURRENT ASSETS:
Inventory 1,572 - 1,731
Prepaid expenses 3,234 3,299 3,364
Call option to non-controlling interests, net - 379 245
Long-term deposits 334 408 423
Right-of-use assets 10,695 10,947 11,038
Deferred taxes 2,213 3,659 2,872
Other financial assets - 250 -
18,048 18,942 19,673
PROPERTY AND EQUIPMENT, NET 4,814 4,120 4,652
GOODWILL 32,320 33,433 33,745
INTANGIBLE ASSETS, NET 20,244 19,235 20,425
Total assets 119,824 114,324 110,783
The accompanying notes are an integral part of the interim condensed consolidated financial statements. |
| Financial Statements
7
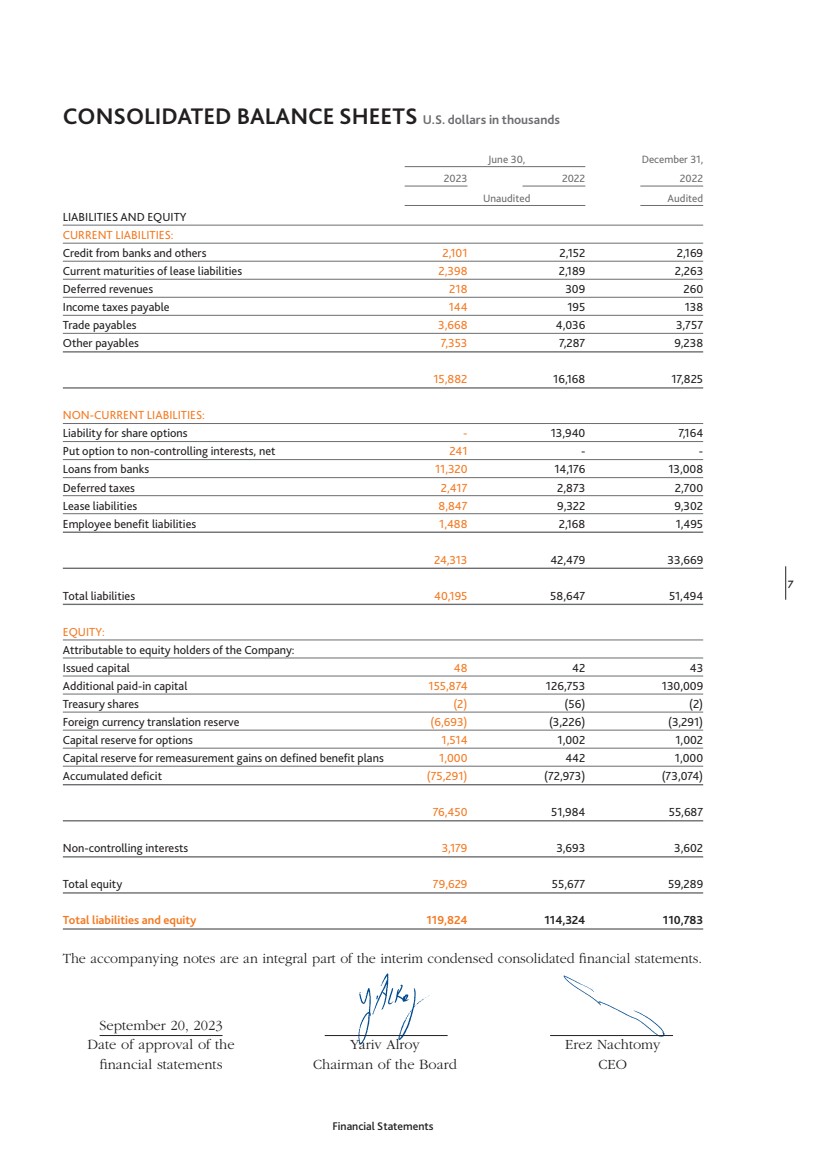
CONSOLIDATED BALANCE SHEETS U.S. dollars in thousands
June 30, December 31,
2023 2022 2022
Unaudited Audited
LIABILITIES AND EQUITY
CURRENT LIABILITIES:
Credit from banks and others 2,101 2,152 2,169
Current maturities of lease liabilities 2,398 2,189 2,263
Deferred revenues 218 309 260
Income taxes payable 144 195 138
Trade payables 3,668 4,036 3,757
Other payables 7,353 7,287 9,238
15,882 16,168 17,825
NON-CURRENT LIABILITIES:
Liability for share options - 13,940 7,164
Put option to non-controlling interests, net 241 - -
Loans from banks 11,320 14,176 13,008
Deferred taxes 2,417 2,873 2,700
Lease liabilities 8,847 9,322 9,302
Employee benefit liabilities 1,488 2,168 1,495
24,313 42,479 33,669
Total liabilities 40,195 58,647 51,494
EQUITY:
Attributable to equity holders of the Company:
Issued capital 48 42 43
Additional paid-in capital 155,874 126,753 130,009
Treasury shares (2) (56) (2)
Foreign currency translation reserve (6,693) (3,226) (3,291)
Capital reserve for options 1,514 1,002 1,002
Capital reserve for remeasurement gains on defined benefit plans 1,000 442 1,000
Accumulated deficit (75,291) (72,973) (73,074)
76,450 51,984 55,687
Non-controlling interests 3,179 3,693 3,602
Total equity 79,629 55,677 59,289
Total liabilities and equity 119,824 114,324 110,783
The accompanying notes are an integral part of the interim condensed consolidated financial statements.
September 20, 2023
Date of approval of the Yariv Alroy Erez Nachtomy
financial statements Chairman of the Board CEO |
| Financial Statements
8
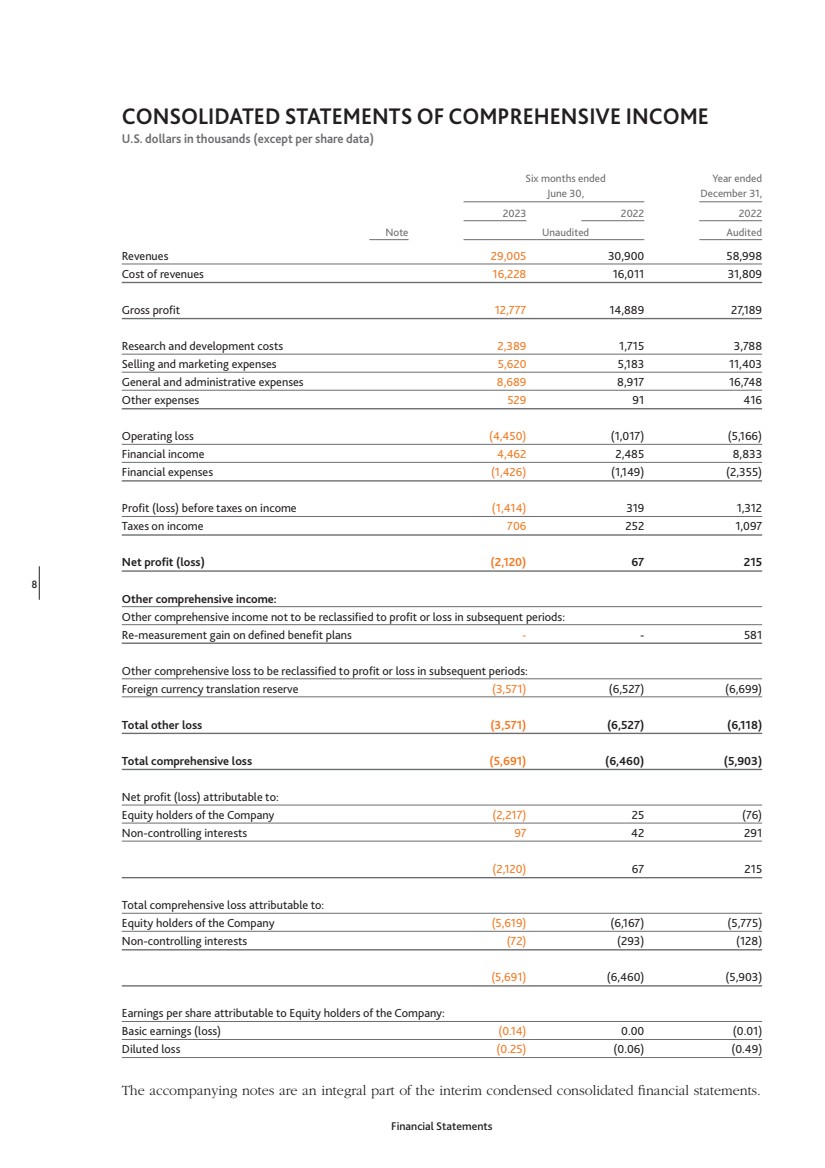
CONSOLIDATED STATEMENTS OF COMPREHENSIVE INCOME
U.S. dollars in thousands (except per share data)
Six months ended Year ended
June 30, December 31,
2023 2022 2022
Note Unaudited Audited
Revenues 29,005 30,900 58,998
Cost of revenues 16,228 16,011 31,809
Gross profit 12,777 14,889 27,189
Research and development costs 2,389 1,715 3,788
Selling and marketing expenses 5,620 5,183 11,403
General and administrative expenses 8,689 8,917 16,748
Other expenses 529 91 416
Operating loss (4,450) (1,017) (5,166)
Financial income 4,462 2,485 8,833
Financial expenses (1,426) (1,149) (2,355)
Profit (loss) before taxes on income (1,414) 319 1,312
Taxes on income 706 252 1,097
Net profit (loss) (2,120) 67 215
Other comprehensive income:
Other comprehensive income not to be reclassified to profit or loss in subsequent periods:
Re-measurement gain on defined benefit plans - - 581
Other comprehensive loss to be reclassified to profit or loss in subsequent periods:
Foreign currency translation reserve (3,571) (6,527) (6,699)
Total other loss (3,571) (6,527) (6,118)
Total comprehensive loss (5,691) (6,460) (5,903)
Net profit (loss) attributable to:
Equity holders of the Company (2,217) 25 (76)
Non-controlling interests 97 42 291
(2,120) 67 215
Total comprehensive loss attributable to:
Equity holders of the Company (5,619) (6,167) (5,775)
Non-controlling interests (72) (293) (128)
(5,691) (6,460) (5,903)
Earnings per share attributable to Equity holders of the Company:
Basic earnings (loss) (0.14) 0.00 (0.01)
Diluted loss (0.25) (0.06) (0.49)
The accompanying notes are an integral part of the interim condensed consolidated financial statements. |

| Financial Statements
9
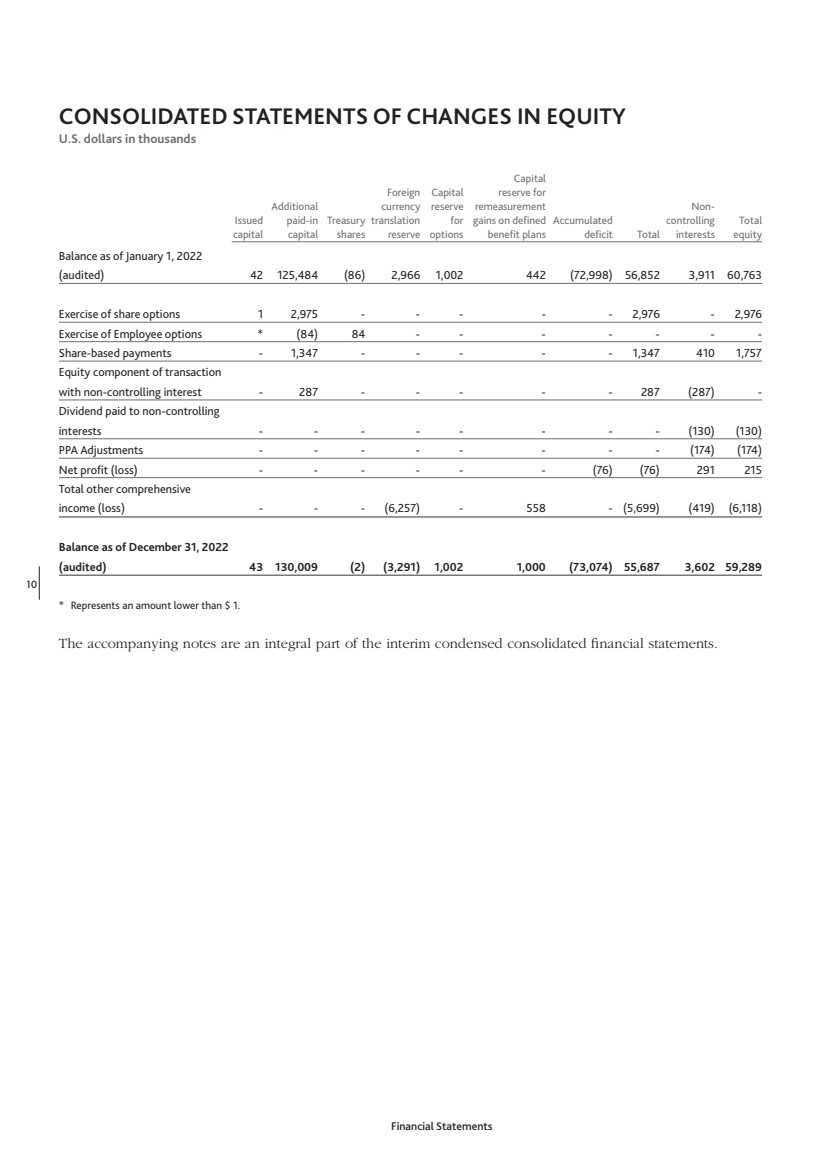
CONSOLIDATED STATEMENTS OF CHANGES IN EQUITY
U.S. dollars in thousands
Capital
Foreign Capital reserve for
Additional currency reserve remeasurement Non-Issued paid-in Treasury translation for gains on defined Accumulated controlling Total
capital capital shares reserve options benefit plans deficit Total interests equity
Balance as of January 1, 2023
(audited) 43 130,009 (2) (3,291) 1,002 1,000 (73,074) 55,687 3,602 59,289
Exercise of share options 5 25,114 - - 512 - - 25,631 - 25,631
Share-based payments - 691 - - - - - 691 85 776
Equity component of transaction
with non-controlling interest - 60 - - - - - 60 (60) -
Net profit (loss) - - - - - - (2,217) (2,217) 97 (2,120)
Total other comprehensive loss - - - (3,402) - - - (3,402) (169) (3,571)
Dividend to non-controlling interests - - - - - - - - (376) (376)
Balance as of June 30, 2023
(unaudited) 48 155,874 (2) (6,693) 1,514 1,000 (75,291) 76,450 3,179 79,629
Capital
Foreign Capital reserve for
Additional currency reserve remeasurement Non-Issued paid-in Treasury translation for gains on defined Accumulated controlling Total
capital capital shares reserve options benefit plans deficit Total interests equity
Balance as of January 1, 2022
(audited) 42 125,484 (86) 2,966 1,002 442 (72,998) 56,852 3,911 60,763
Exercise of share options *- 402 - - - - - 402 - 402
Share-based payments - 720 - - - - - 720 252 972
Exercise of Employee options - (30) 30 - - - - - - -
Equity component of transaction
with non-controlling interest - 177 - - - - - 177 (177) -
Net profit - - - - - - 25 25 42 67
Total other comprehensive loss - - - (6,192) - - - (6,192) (335) (6,527)
Balance as of June 30, 2022
(unaudited) 42 126,753 (56) (3,226) 1,002 442 (72,973) 51,984 3,693 55,677
* Represents an amount lower than $ 1.
The accompanying notes are an integral part of the interim condensed consolidated financial statements. |
| Financial Statements
10
CONSOLIDATED STATEMENTS OF CHANGES IN EQUITY
U.S. dollars in thousands
Capital
Foreign Capital reserve for
Additional currency reserve remeasurement Non-Issued paid-in Treasury translation for gains on defined Accumulated controlling Total
capital capital shares reserve options benefit plans deficit Total interests equity
Balance as of January 1, 2022
(audited) 42 125,484 (86) 2,966 1,002 442 (72,998) 56,852 3,911 60,763
Exercise of share options 1 2,975 - - - - - 2,976 - 2,976
Exercise of Employee options * (84) 84 - - - - - - -
Share-based payments - 1,347 - - - - - 1,347 410 1,757
Equity component of transaction
with non-controlling interest - 287 - - - - - 287 (287) -
Dividend paid to non-controlling
interests - - - - - - - - (130) (130)
PPA Adjustments - - - - - - - - (174) (174)
Net profit (loss) - - - - - - (76) (76) 291 215
Total other comprehensive
income (loss) - - - (6,257) - 558 - (5,699) (419) (6,118)
Balance as of December 31, 2022
(audited) 43 130,009 (2) (3,291) 1,002 1,000 (73,074) 55,687 3,602 59,289
* Represents an amount lower than $ 1.
The accompanying notes are an integral part of the interim condensed consolidated financial statements. |

| Financial Statements
11
CONSOLIDATED STATEMENTS OF CASH FLOWS
U.S. dollars in thousands
Six months ended Year ended
June 30, December 31,
2023 2022 2022
Unaudited Audited
Cash flows from operating activities:
Net profit (loss) (2,120) 67 215
Adjustments required to reconcile net profit (loss) to net cash
provided by (used in) operating activities:
Income and expenses not involving operating cash flows:
Depreciation and amortization 3,512 3,412 7,134
Capital loss from sale of property and equipment 16 50 51
Change in employee benefit liabilities, net 69 56 90
Financial income, net (2,432) (1,925) (7,443)
Valuation loss (gain) of short-term investments (723) 589 769
Cost of share-based payments 776 972 1,757
Taxes on income 706 252 1,097
1,924 3,406 3,455
Changes in operating assets and liabilities:
Increase in trade receivables, net (1,413) (73) (641)
Increase in inventory (411) (1,503) (2,544)
Decrease (increase) in prepaid expenses (35) 68 (21)
Increase in other accounts receivable (368) (169) (471)
Increase in trade payables 98 1,575 1,264
Decrease in deferred revenues (30) (201) (246)
Increase (decrease) in other accounts payable (460) (367) 845
(2,619) (670) (1,814)
Cash paid and received:
Interest received 566 153 429
Interest paid (709) (394) (1,010)
Income tax received 9 23 87
Income taxes paid (344) (864) (1,435)
(478) (1,082) (1,929)
Net cash provided by (used in) operating activities (3,293) 1,721 (73)
The accompanying notes are an integral part of the interim condensed consolidated financial statements. |

| Financial Statements
12
CONSOLIDATED STATEMENTS OF CASH FLOWS
U.S. dollars in thousands
Six months ended Year ended
June 30, December 31,
2023 2022 2022
Unaudited Audited
Cash flows from investing activities:
Purchase of property and equipment (578) (1,030) (1,661)
Investment in intangible assets (2,196) (2,157) (5,243)
Investment in long-term deposits (9,783) - (5,705)
Proceeds from long-term deposits 5,900 - -
Purchase of short-term investments (963) (4,056) (5,588)
Proceeds from sale of short-term investments 1,022 10,449 11,764
Net cash provided by (used in) investing activities (6,598) 3,206 (6,433)
Cash flows from financing activities:
Dividend paid to non-controlling interests (376) - (130)
Payment of lease liabilities (1,237) (1,250) (2,447)
Payment of liability to underwriter (1,124) - -
Exercise of share options 20,298 239 1,961
Payment of long-term loans (1,055) (566) (1,665)
Other 12 - -
Net cash provided by (used in) financing activities 16,518 (1,577) (2,281)
Effect of exchange rate changes on cash and cash equivalents (675) (1,779) (1,575)
Increase (decrease) in cash and cash equivalents 5,952 1,571 (10,362)
Cash and cash equivalents at the beginning of the period 4,483 14,845 14,845
Cash and cash equivalents at the end of the period 10,435 16,416 4,483
Non-cash transactions:
Right-of-use asset recognized with corresponding lease liability 1,065 368 1,658
Liability derecognized and recorded in equity
upon exercise of share options 5,333 163 1,015
The accompanying notes are an integral part of the interim condensed consolidated financial statements. |
| Financial Statements
13
NOTE 1 | GENERAL
a. These consolidated financial statements
have been prepared in a condensed format as
of June 30, 2023, and for the six months then
ended. These condensed consolidated financial
statements should be read in conjunction with
the annual consolidated financial statements
and accompanying notes of SHL Telemedicine
Ltd. (“the Company”) as of December 31,
2022 and for the year then ended (“the annual
financial statements”).
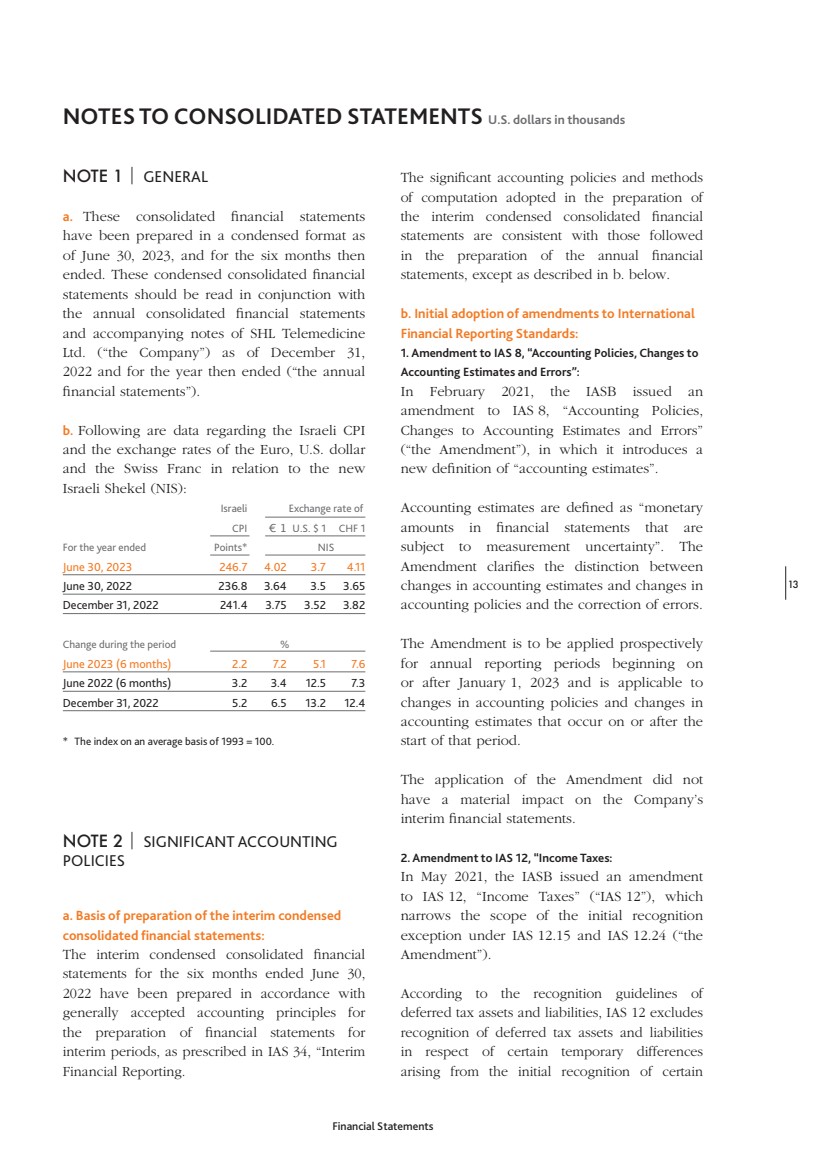
b. Following are data regarding the Israeli CPI
and the exchange rates of the Euro, U.S. dollar
and the Swiss Franc in relation to the new
Israeli Shekel (NIS):
Israeli Exchange rate of
CPI € 1 U.S. $ 1 CHF 1
For the year ended Points* NIS
June 30, 2023 246.7 4.02 3.7 4.11
June 30, 2022 236.8 3.64 3.5 3.65
December 31, 2022 241.4 3.75 3.52 3.82
Change during the period %
June 2023 (6 months) 2.2 7.2 5.1 7.6
June 2022 (6 months) 3.2 3.4 12.5 7.3
December 31, 2022 5.2 6.5 13.2 12.4
* The index on an average basis of 1993 = 100.
NOTE 2 | SIGNIFICANT ACCOUNTING
POLICIES
a. Basis of preparation of the interim condensed
consolidated financial statements:
The interim condensed consolidated financial
statements for the six months ended June 30,
2022 have been prepared in accordance with
generally accepted accounting principles for
the preparation of financial statements for
interim periods, as prescribed in IAS 34, “Interim
Financial Reporting.
The significant accounting policies and methods
of computation adopted in the preparation of
the interim condensed consolidated financial
statements are consistent with those followed
in the preparation of the annual financial
statements, except as described in b. below.
b. Initial adoption of amendments to International
Financial Reporting Standards:
1. Amendment to IAS 8, “Accounting Policies, Changes to
Accounting Estimates and Errors”:
In February 2021, the IASB issued an
amendment to IAS 8, “Accounting Policies,
Changes to Accounting Estimates and Errors”
(“the Amendment”), in which it introduces a
new definition of “accounting estimates”.
Accounting estimates are defined as “monetary
amounts in financial statements that are
subject to measurement uncertainty”. The
Amendment clarifies the distinction between
changes in accounting estimates and changes in
accounting policies and the correction of errors.
The Amendment is to be applied prospectively
for annual reporting periods beginning on
or after January 1, 2023 and is applicable to
changes in accounting policies and changes in
accounting estimates that occur on or after the
start of that period.
The application of the Amendment did not
have a material impact on the Company’s
interim financial statements.
2. Amendment to IAS 12, “Income Taxes:
In May 2021, the IASB issued an amendment
to IAS 12, “Income Taxes” (“IAS 12”), which
narrows the scope of the initial recognition
exception under IAS 12.15 and IAS 12.24 (“the
Amendment”).
According to the recognition guidelines of
deferred tax assets and liabilities, IAS 12 excludes
recognition of deferred tax assets and liabilities
in respect of certain temporary differences
arising from the initial recognition of certain
NOTES TO CONSOLIDATED STATEMENTS U.S. dollars in thousands |

| Financial Statements
14
transactions. This exception is referred to as the
“initial recognition exception”. The Amendment
narrows the scope of the initial recognition
exception and clarifies that it does not apply
to the recognition of deferred tax assets and
liabilities arising from transactions that are not a
business combination and that give rise to equal
taxable and deductible temporary differences,
even if they meet the other criteria of the initial
recognition exception.
The Amendment is effective for annual
reporting periods beginning on or after
January 1, 2023. In relation to leases and
decommissioning obligations, the Amendment
is applied commencing from the earliest
reporting period presented in the financial
statements in which the Amendment is initially
applied. The cumulative effect of the initial
application of the Amendment is recognized
as an adjustment to the opening balance of
retained earnings (or another component of
equity, as appropriate) at that date.
The application of the Amendment did not
have a material impact on the Company’s
interim financial statements.
NOTE 3 | REVENUES
Six months ended Year ended
June 30, December 31,
2023 2022 2022
Unaudited Audited
Revenues for services
performed during
the period 28,195 30,234 57,869
Revenues from sale
of devices 810 666 1,129
29,005 30,900 58,998
NOTES TO CONSOLIDATED STATEMENTS U.S. dollars in thousands
NOTE 4 | MATERIAL EVENTS DURING THE
REPORTING PERIOD
a. During January 2023 and February 2023 the
Company received proceeds of approximately
CHF 18.7 million (USD 20.3 million) from
exercises of 1,703,908 share options granted
in the private placements in January 2021
and February 2021 and 29,967 options were
forfeited. In addition, the underwriters received
a cash payment of approximately CHF 1.1
million (USD 1.1 million) derived from cash
received by the Company from the exercise
of the Share Options and 58,498 Units of
securities. This payment was offset from the
liability to the underwriters recorded in the
balance sheet. See also Note 4e. below.
b. In April, 2023 the Company’s Board of
Directors approved the appointment of Bernd
Altpeter as Co-Managing Director of SHL
German Operation.
c. During the period, the Company’s Board of
Directors approved the grant of 423,500 options
to Senior managers, under the 2021 Executive and
Key Employee Israeli Share Incentive Plan. The
options shall vest over a period of 3 years (25%
after 1 year, and 9.375% each quarter thereafter).
The fair value of options granted ranges from
CHF 3.37 to 4.66 ($ 3.76-5.05). The fair value was
estimated based on the binomial model using the
following data and assumptions: share price range
- CHF 9.70-14.80; exercise price range – CHF 9.36-
15.56; expected volatility range – 43.87%-46.57%;
risk free interest rate range – 0.89%-1.50%;
expected dividend – 0%; and expected average
life of options range – 3.43-3.49 years.
d. On March 31, 2023 the Company announced
that the U.S. Securities and Exchange
Commission (the “SEC”) declared effective the
Company’s registration statement of its securities
under the U.S. Securities Exchange Act of 1934,
as amended (the “Exchange Act“), in connection
with the NASDAQ Listing of its American
Depositary Shares (“ADRs”), each representing |
| Financial Statements
15
one ordinary share of the Company. The ADRs
commenced trading on The NASDAQ Capital
Market (the “Nasdaq”), on April 3 2023 under
the ticker symbol “SHLT”, in parallel to its
ordinary shares continuing to be listed on the
Swiss Stock Exchange.
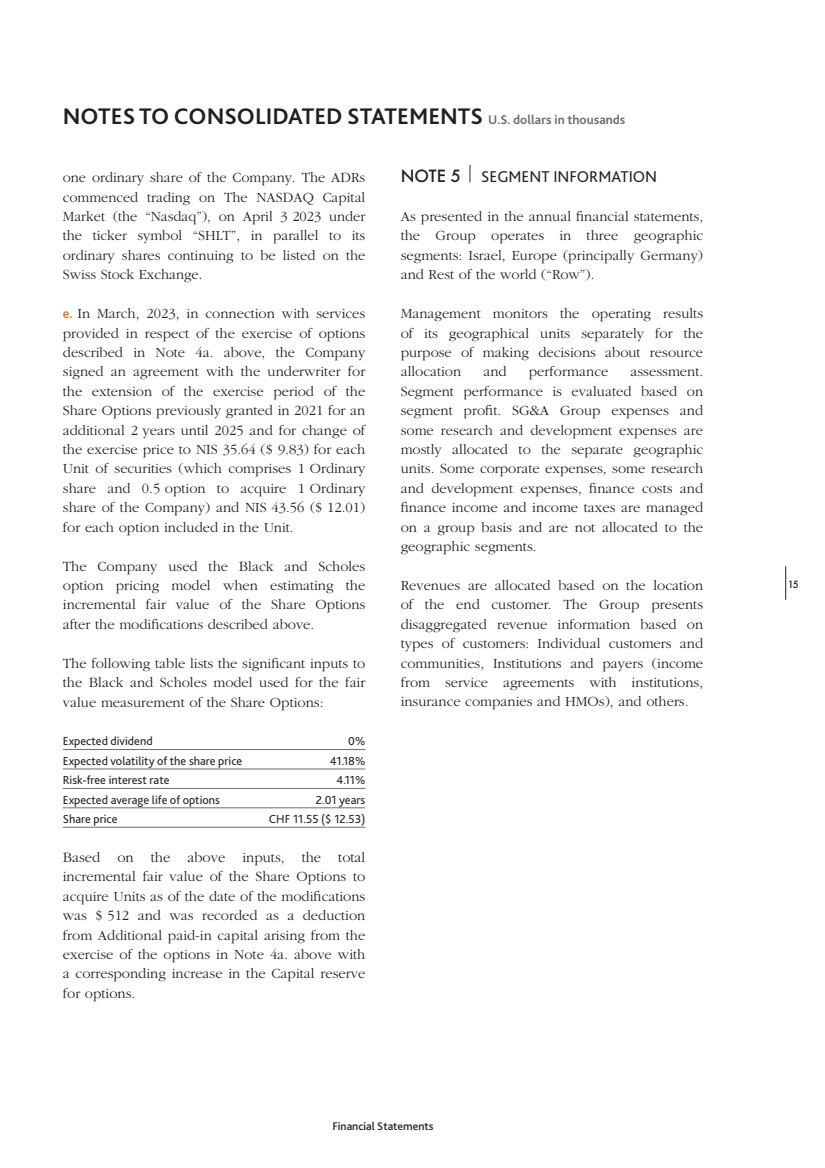
e. In March, 2023, in connection with services
provided in respect of the exercise of options
described in Note 4a. above, the Company
signed an agreement with the underwriter for
the extension of the exercise period of the
Share Options previously granted in 2021 for an
additional 2 years until 2025 and for change of
the exercise price to NIS 35.64 ($ 9.83) for each
Unit of securities (which comprises 1 Ordinary
share and 0.5 option to acquire 1 Ordinary
share of the Company) and NIS 43.56 ($ 12.01)
for each option included in the Unit.
The Company used the Black and Scholes
option pricing model when estimating the
incremental fair value of the Share Options
after the modifications described above.
The following table lists the significant inputs to
the Black and Scholes model used for the fair
value measurement of the Share Options:
Expected dividend 0%
Expected volatility of the share price 41.18%
Risk-free interest rate 4.11%
Expected average life of options 2.01 years
Share price CHF 11.55 ($ 12.53)
Based on the above inputs, the total
incremental fair value of the Share Options to
acquire Units as of the date of the modifications
was $ 512 and was recorded as a deduction
from Additional paid-in capital arising from the
exercise of the options in Note 4a. above with
a corresponding increase in the Capital reserve
for options.
NOTE 5 | SEGMENT INFORMATION
As presented in the annual financial statements,
the Group operates in three geographic
segments: Israel, Europe (principally Germany)
and Rest of the world (“Row”).
Management monitors the operating results
of its geographical units separately for the
purpose of making decisions about resource
allocation and performance assessment.
Segment performance is evaluated based on
segment profit. SG&A Group expenses and
some research and development expenses are
mostly allocated to the separate geographic
units. Some corporate expenses, some research
and development expenses, finance costs and
finance income and income taxes are managed
on a group basis and are not allocated to the
geographic segments.
Revenues are allocated based on the location
of the end customer. The Group presents
disaggregated revenue information based on
types of customers: Individual customers and
communities, Institutions and payers (income
from service agreements with institutions,
insurance companies and HMOs), and others.
NOTES TO CONSOLIDATED STATEMENTS U.S. dollars in thousands |
| Financial Statements
16
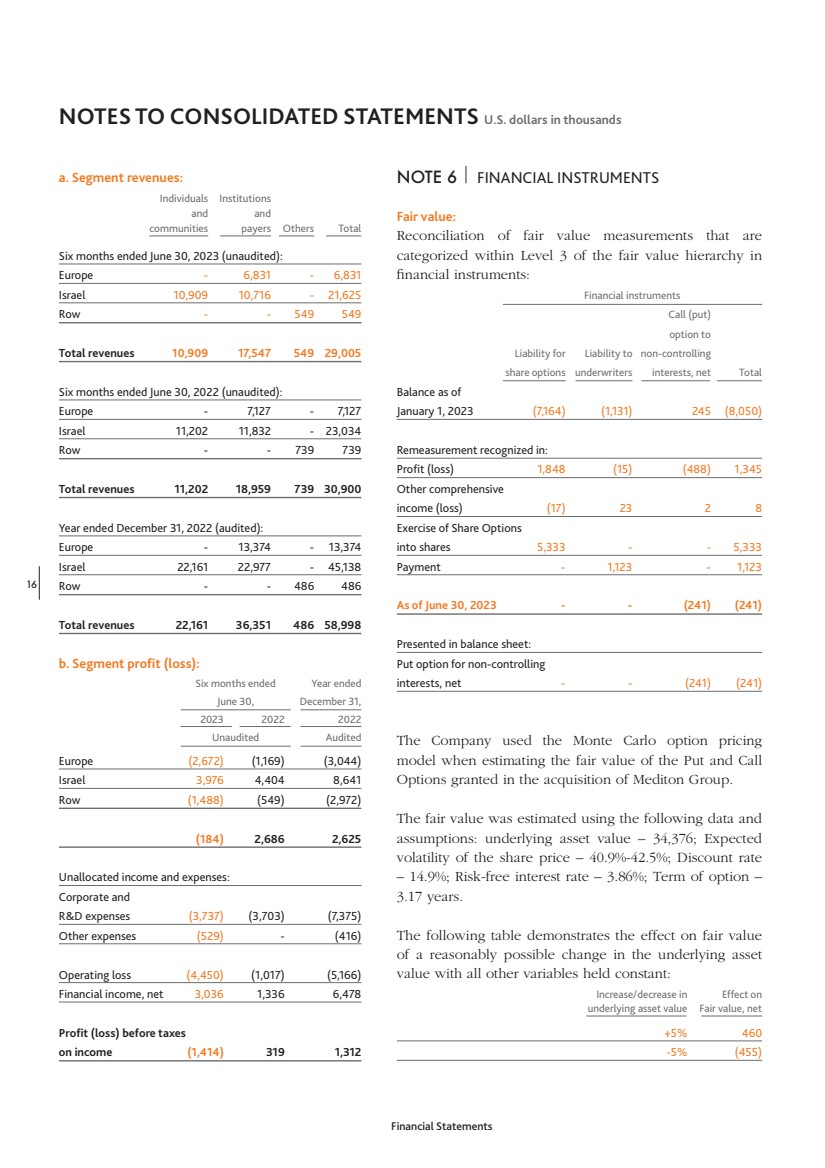
a. Segment revenues:
Individuals Institutions
and and
communities payers Others Total
Six months ended June 30, 2023 (unaudited):
Europe - 6,831 - 6,831
Israel 10,909 10,716 - 21,625
Row - - 549 549
Total revenues 10,909 17,547 549 29,005
Six months ended June 30, 2022 (unaudited):
Europe - 7,127 - 7,127
Israel 11,202 11,832 - 23,034
Row - - 739 739
Total revenues 11,202 18,959 739 30,900
Year ended December 31, 2022 (audited):
Europe - 13,374 - 13,374
Israel 22,161 22,977 - 45,138
Row - - 486 486
Total revenues 22,161 36,351 486 58,998
b. Segment profit (loss):
Six months ended Year ended
June 30, December 31,
2023 2022 2022
Unaudited Audited
Europe (2,672) (1,169) (3,044)
Israel 3,976 4,404 8,641
Row (1,488) (549) (2,972)
(184) 2,686 2,625
Unallocated income and expenses:
Corporate and
R&D expenses (3,737) (3,703) (7,375)
Other expenses (529) - (416)
Operating loss (4,450) (1,017) (5,166)
Financial income, net 3,036 1,336 6,478
Profit (loss) before taxes
on income (1,414) 319 1,312
NOTES TO CONSOLIDATED STATEMENTS U.S. dollars in thousands
NOTE 6 | FINANCIAL INSTRUMENTS
Fair value:
Reconciliation of fair value measurements that are
categorized within Level 3 of the fair value hierarchy in
financial instruments:
Financial instruments
Call (put)
option to
Liability for Liability to non-controlling
share options underwriters interests, net Total
Balance as of
January 1, 2023 (7,164) (1,131) 245 (8,050)
Remeasurement recognized in:
Profit (loss) 1,848 (15) (488) 1,345
Other comprehensive
income (loss) (17) 23 2 8
Exercise of Share Options
into shares 5,333 - - 5,333
Payment - 1,123 - 1,123
As of June 30, 2023 - - (241) (241)
Presented in balance sheet:
Put option for non-controlling
interests, net - - (241) (241)
The Company used the Monte Carlo option pricing
model when estimating the fair value of the Put and Call
Options granted in the acquisition of Mediton Group.
The fair value was estimated using the following data and
assumptions: underlying asset value – 34,376; Expected
volatility of the share price – 40.9%-42.5%; Discount rate
– 14.9%; Risk-free interest rate – 3.86%; Term of option –
3.17 years.
The following table demonstrates the effect on fair value
of a reasonably possible change in the underlying asset
value with all other variables held constant:
Increase/decrease in Effect on
underlying asset value Fair value, net
+5% 460
-5% (455) |
| Financial Statements
17
Information For Investors
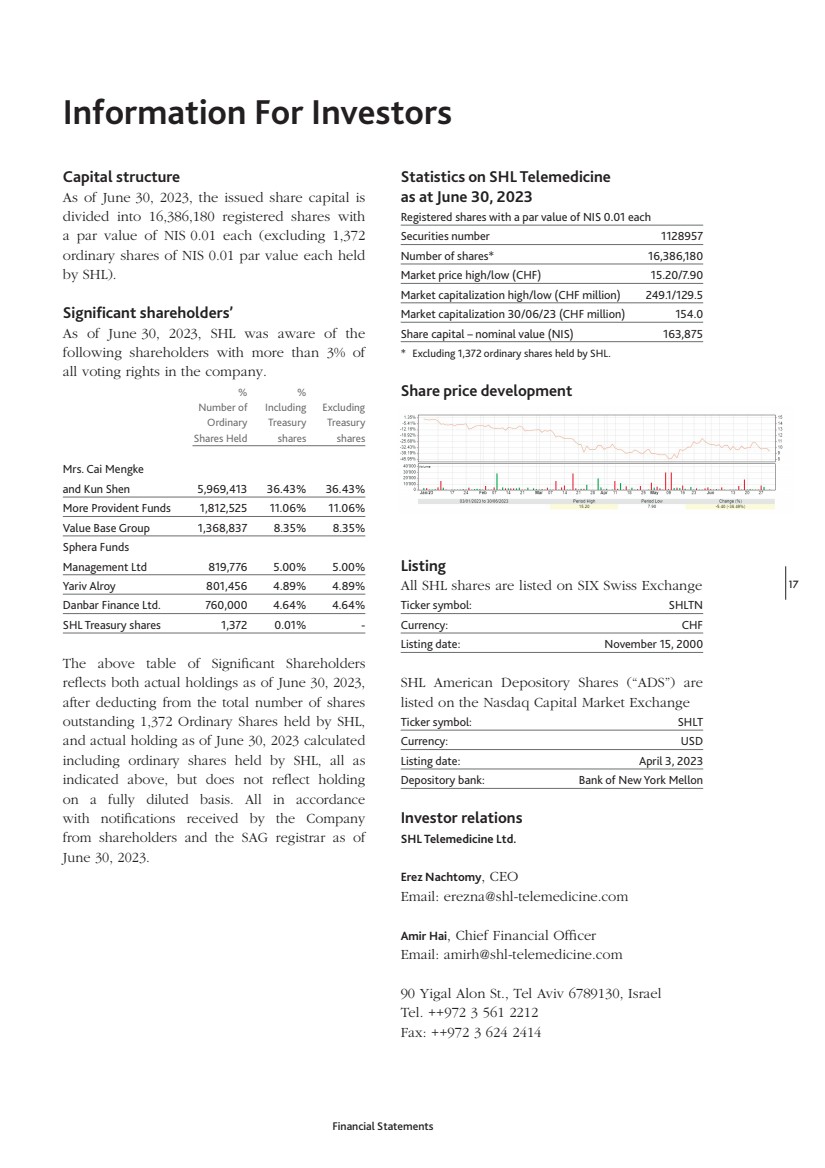
Capital structure
As of June 30, 2023, the issued share capital is
divided into 16,386,180 registered shares with
a par value of NIS 0.01 each (excluding 1,372
ordinary shares of NIS 0.01 par value each held
by SHL).
Significant shareholders’
As of June 30, 2023, SHL was aware of the
following shareholders with more than 3% of
all voting rights in the company.
% %
Number of Including Excluding
Ordinary Treasury Treasury
Shares Held shares shares
Mrs. Cai Mengke
and Kun Shen 5,969,413 36.43% 36.43%
More Provident Funds 1,812,525 11.06% 11.06%
Value Base Group 1,368,837 8.35% 8.35%
Sphera Funds
Management Ltd 819,776 5.00% 5.00%
Yariv Alroy 801,456 4.89% 4.89%
Danbar Finance Ltd. 760,000 4.64% 4.64%
SHL Treasury shares 1,372 0.01% -
The above table of Significant Shareholders
reflects both actual holdings as of June 30, 2023,
after deducting from the total number of shares
outstanding 1,372 Ordinary Shares held by SHL,
and actual holding as of June 30, 2023 calculated
including ordinary shares held by SHL, all as
indicated above, but does not reflect holding
on a fully diluted basis. All in accordance
with notifications received by the Company
from shareholders and the SAG registrar as of
June 30, 2023.
Statistics on SHL Telemedicine
as at June 30, 2023
Registered shares with a par value of NIS 0.01 each
Securities number 1128957
Number of shares* 16,386,180
Market price high/low (CHF) 15.20/7.90
Market capitalization high/low (CHF million) 249.1/129.5
Market capitalization 30/06/23 (CHF million) 154.0
Share capital – nominal value (NIS) 163,875
* Excluding 1,372 ordinary shares held by SHL.
Share price development
Listing
All SHL shares are listed on SIX Swiss Exchange
Ticker symbol: SHLTN
Currency: CHF
Listing date: November 15, 2000
SHL American Depository Shares (“ADS”) are
listed on the Nasdaq Capital Market Exchange
Ticker symbol: SHLT
Currency: USD
Listing date: April 3, 2023
Depository bank: Bank of New York Mellon
Investor relations
SHL Telemedicine Ltd.
Erez Nachtomy, CEO
Email: erezna@shl-telemedicine.com
Amir Hai, Chief Financial Officer
Email: amirh@shl-telemedicine.com
90 Yigal Alon St., Tel Aviv 6789130, Israel
Tel. ++972 3 561 2212
Fax: ++972 3 624 2414 |
| Financial Statements
18
This announcement contains “forward-looking statements” within the meaning of
the U.S. Private Securities Litigation Reform
Act of 1995, specifically Section 27A of the
U.S. Securities Act of 1933, as amended, and
Section 21E of the U.S. Securities Exchange
Act of 1934, as amended. All statements,
other than statements of historical facts,
are forward-looking statements, including,
the Company’s anticipation with respect to
changes in its results of operations from prior
periods. Readers are cautioned that forward-looking statements are not guarantees of future
performance and involve known and unknown
risks, uncertainties and other factors that could
cause actual results to differ materially from
historical results or any future results expressed
or implied by forward-looking statements.
Factors that can cause actual results to differ
from expectations and those contained in
forward-looking statements include those risks
described in Item 3.D. “Key Information—
Risk Factors” contained in the Company’s
Registration Statement on Form 20-F filed with
the U.S. Securities Exchange Commission (the
“SEC”) on March 28, 2023 and in its subsequent
filings and submissions with the SEC, including,
but not limited to, the Company’s ability
to operate and comply with the complex
and evolving regulations in the highly
regulated healthcare industry; the continued
development, consumer acceptance and
market adoption of the Company’s products
and services in the relatively new, unproven
and volatile and rapidly changing telehealth
market; the Company’s ability to develop and
Forward Looking Statements
introduce new products and solutions and
enhancements to existing ones; the significant
and increasing levels of competition in the
telemedicine market; the impacts of COVID-19
and future pandemics and epidemics; the
Company’s ability to continue to attract and
retain key employees and personal in the
highly competitive healthcare industry; the loss
or breach of the Company’s proprietary rights
and data security and privacy risks; political,
judicial, legal, economic and military conditions
in Israel and the surrounding region; global
economic and financial market conditions
and the Company’s ability to adapt to and
comply with the different business and market
factors, conditions, requirements and laws and
regulations in the various countries in which
the Company operates internationally; currency
fluctuations; labor disputes; the Company’s
ability to manage growth and integrate
acquired businesses and expanding operations;
the Company’s ability to obtain adequate levels
of insurance to cover potential losses; the
Company’s dependence on key suppliers and
sub-contractors and other third parties; and
other matters and risks not yet known to the
Company or not currently considered material
by it. You should not place undue reliance
on these forward-looking statements. All
written and oral forward-looking statements,
attributable to the Company, or persons acting
on its behalf, are qualified in their entirety by
these cautionary statements. Unless required by
law, the Company undertakes no obligation to
publicly update or revise any forward-looking
statements. |
SHL Telemedicine (PK) (USOTC:SMDCF)
Historical Stock Chart
From May 2024 to Jun 2024
 Charts.")
SHL Telemedicine (PK) (USOTC:SMDCF)
Historical Stock Chart
From Jun 2023 to Jun 2024
 Charts.")