Profit for the
 year                    -            -         -         -            -     3,010        3,010          718     3,728
Other
 comprehensive
 income                  -            -         -     (126)      (1,518)         -      (1,644)        (739)   (2,383)
Total
 comprehensive
 income for the
 year                    -            -         -     (126)      (1,518)     3,010        1,366         (21)     1,345
Equity-settled
 share-based
 payment (note
 25)                     -            -         -         -            -        82           82            -        82
Options exercised
 (note 22)              58          118         -         -            -         -          176            -       176
Equity dividends
 paid                    -            -         -         -            -         -            -      (1,014)   (1,014)
At 31 March 2014     2,896        4,776    17,164     (577)        (672)    29,925       53,512        3,649    57,161
Merger reserve
The merger reserve comprises premium on shares issued in
relation to business combinations.
Capital redemption reserve
The capital redemption reserve comprises amounts transferred
from retained earnings in relation to the redemption of preference
shares. For ease of presentation, the amount of GBP1.34 million
relating to the capital redemption reserve has been included within
the column of share premium and capital redemption reserve in the
balances at both the beginning and end of each year, with no
movements.
Hedging reserve
The hedging reserve comprises the effective portion of the
cumulative net change in the fair value of cash flow hedging
instruments related to hedged transactions that have not yet
occurred.
Translation reserve
The translation reserve comprises all foreign currency
differences arising from the translation of the financial
statements of foreign operations.
Shareholders' equity
Shareholders' equity represents total equity attributable to
owners of the Parent Company.
Consolidated balance sheet
as at 31 March 2014
                                                                As at     As at
                                                             31 March  31 March
                                                                 2014      2013
                                                      Notes    GBP000    GBP000
----------------------------------------------------  -----  --------  --------
Non-current assets
Property, plant and equipment                         11       32,049    29,993
Intangible assets                                     12       31,950    32,795
Deferred tax assets                                   13        3,665     4,250
----------------------------------------------------  -----  --------  --------
Total non--current assets                                      67,664    67,038
----------------------------------------------------  -----  --------  --------
Current assets
Inventory                                             14       48,460    50,114
Trade and other receivables                           15       19,690    23,285
Cash and cash equivalents                             16        8,111     2,301
----------------------------------------------------  -----  --------  --------
Total current assets                                           76,261    75,700
----------------------------------------------------  -----  --------  --------
Total assets                                                  143,925   142,738
----------------------------------------------------  -----  --------  --------
Equity
Share capital                                         22        2,896     2,838
Share premium                                                   3,436     3,318
Reserves                                                       17,255    18,899
Retained earnings                                              29,925    26,833
----------------------------------------------------  -----  --------  --------
Equity attributable to owners of the Parent Company            53,512    51,888
----------------------------------------------------  -----  --------  --------
Non-controlling interests                                       3,649     4,684
----------------------------------------------------  -----  --------  --------
Total equity                                                   57,161    56,572
----------------------------------------------------  -----  --------  --------
Non-current liabilities
Loans and borrowings                                  17       28,145    29,479
Deferred income                                       18        1,592     1,329
Provisions                                            19          860       862
Other financial liabilities                           20        4,202     1,803
----------------------------------------------------  -----  --------  --------
Total non-current liabilities                                  34,799    33,473
----------------------------------------------------  -----  --------  --------
Current liabilities
Bank overdraft                                        16        2,529       336
Loans and borrowings                                  17        9,695    12,847
Deferred income                                       18        1,202       550
Provisions                                            19          165       107
Income tax payable                                              2,052       904
Trade and other payables                              21       25,818    28,995
Other financial liabilities                           20       10,504     8,954
----------------------------------------------------  -----  --------  --------
Total current liabilities                                      51,965    52,693
----------------------------------------------------  -----  --------  --------
Total liabilities                                              86,764    86,166
----------------------------------------------------  -----  --------  --------
Total equity and liabilities                                  143,925   142,738
----------------------------------------------------  -----  --------  --------
These financial statements were approved by the Board of
Directors on 19 June 2014 and were signed on its behalf by:
 Paul Fineman         Director
 Anthony Lawrinson    Director
 Company number       1401155
Consolidated cash flow statement
year ended 31 March 2014
                                                                                           2014      2013
                                                                                Notes    GBP000    GBP000
-----------------------------------------------------------------------------  ------  --------  --------
 Cash flows from operating activities
 Profit for the year                                                                      3,728     4,076
 Adjustments for:
 Depreciation                                                                   11        5,032     3,807
 Amortisation of intangible assets                                              12          576       494
 Finance expenses                                                               8,10      3,616     3,466
 Income tax charge                                                              9         1,459     1,601
 Loss/profit on sales of property, plant and equipment and intangible assets    5             4     (252)
 Equity-settled share-based payment                                             25           82        22
-----------------------------------------------------------------------------  ------  --------  --------
 Operating profit after adjustments for non-cash items                                   14,497    13,214
 Change in trade and other receivables                                                    1,520   (1,965)
 Change in inventory                                                                      (722)   (7,171)
 Change in trade and other payables                                                        (48)     4,356
 Change in provisions and deferred income                                                  (84)     (901)
-----------------------------------------------------------------------------  ------  --------  --------
 Cash generated from operations                                                          15,163     7,533
 Tax paid                                                                                  (60)     (937)
 Interest and similar charges paid                                                      (3,221)   (3,285)
-----------------------------------------------------------------------------  ------  --------  --------
 Net cash inflow from operating activities                                               11,882     3,311
-----------------------------------------------------------------------------  ------  --------  --------
 Cash flow from investing activities
 Proceeds from sale of property, plant and equipment                                        140       421
 Acquisition of intangible assets                                                         (206)     (242)
 Acquisition of property, plant and equipment (a)                                       (5,085)   (1,884)
 Receipt of government grants                                                             1,049         -
-----------------------------------------------------------------------------  ------  --------  --------
 Net cash outflow from investing activities                                             (4,102)   (1,705)
-----------------------------------------------------------------------------  ------  --------  --------
 Cash flows from financing activities
 Proceeds from issue of share capital                                                       176       266
 Repayment of secured borrowings                                                        (5,646)   (4,060)
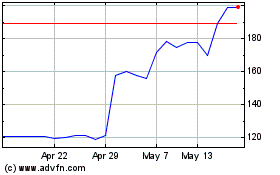
Ig Design (LSE:IGR)
Historical Stock Chart
From Jun 2024 to Jul 2024

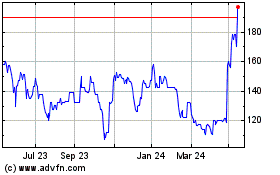
Ig Design (LSE:IGR)
Historical Stock Chart
From Jul 2023 to Jul 2024
