Maven Income & Growth VCT PLC Net Asset Value(s) (3555K)
06 July 2017 - 11:19PM
UK Regulatory
TIDMMIG1
RNS Number : 3555K
Maven Income & Growth VCT PLC
06 July 2017
Maven Income and Growth VCT PLC
Net Asset Value
The Directors confirm:
-- Net asset value (NAV)(1) of 62.80p per Ordinary Share as at
31 May 2017, after payment of the second interim dividend of 3.60p
on 26 May 2017, compared to 65.84p at 28 February 2017;
-- NAV total return(2) of 139.50p per Ordinary Share as at 31
May 2017, compared to 138.94p at 28 February 2017; and
-- Second interim dividend of 3.60p per Ordinary Share in
respect of the year ended 28 February 2017, paid on 26 May
2017.
Notes:
(1) The NAV at 31 May 2017 is unaudited and reflects the closing
bid price of quoted securities as at that date. Investments in
unlisted companies are normally valued on a six monthly basis and
the NAV incorporates the Directors' valuation of unlisted
investments as at 28 February 2017, adjusted for subsequent events
where appropriate. There have been no material changes in the
valuations of any of the unlisted investments during the period
from 28 February 2017 to the date of this announcement.
(2) NAV total return is the sum of NAV per share and dividends
paid per share since launch.
Issued on behalf of the Board
Maven Capital Partners UK LLP
Secretary
6 July 2017
This information is provided by RNS
The company news service from the London Stock Exchange
END
NAVUGURGMUPMGWQ
(END) Dow Jones Newswires
July 06, 2017 09:19 ET (13:19 GMT)
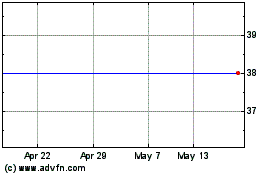
Maven Income & Growth Vct (LSE:MIG1)
Historical Stock Chart
From Apr 2024 to May 2024

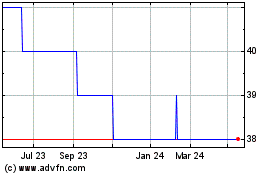
Maven Income & Growth Vct (LSE:MIG1)
Historical Stock Chart
From May 2023 to May 2024
