Australian Shares End Week Higher, Lifted by Resources Stocks
24 December 2015 - 3:13PM
Dow Jones News
By Robb M. Stewart
MELBOURNE, Australia--A Christmas Eve rally has pushed
Australia's equities market to its highest close since the start of
the month, buoyed by resources stocks as oil and other commodities
recover some of this year's lost ground.
In a holiday-shortened trading day, the S&P/ASX 200 finished
65.8 points, or 1.3%, higher at 5207.6.
After seven straight gains, the index is at its highest level
since Dec. 3, having advanced 2% for the week. Still, it remains
down 3.8% in 2015.
The baskets of energy and materials stocks each rose by more
than 3%, while the heavily-weighed financials sector gained
1.2%.
"Sentiment toward the commodity sector was helped by a
surprisingly large drop in U.S. oil inventories last week as well
as recent signalling from Chinese authorities that more stimulus is
on the way," said Ric Spooner, chief market analyst at CMC Markets,
adding that the rally left some investors scrambling after finding
themselves on the wrong side of recent moves in commodity prices
and resources stocks.
Still, trading volumes have been thin all week in the run up to
the holidays, and were about 50% below the 30-day average on
Thursday, IG market analyst Angus Nicholson said.
Woodside Petroleum climbed 2.1%, Oil Search rose 3.8%, Santos
added 2.7% and Origin Energy gained 6.2%.
Among mining shares, BHP Billiton jumped 5.3%, Rio Tinto was
4.4% higher and Fortescue Metals Group rose 5%.
The four largest banks were each up more than 1%, led by a 1.6%
gain in Commonwealth Bank of Australia.
For the day, 1.1 billion shares valued at 2.14 billion
Australian dollars (US$1.55 billion) were traded, Commonwealth
Securities said.
Write to Robb M. Stewart at robb.stewart@wsj.com
(END) Dow Jones Newswires
December 23, 2015 22:58 ET (03:58 GMT)
Copyright (c) 2015 Dow Jones & Company, Inc.
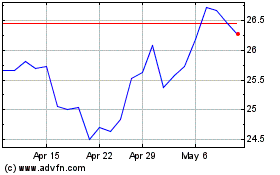
Fortescue (ASX:FMG)
Historical Stock Chart
From Nov 2024 to Dec 2024

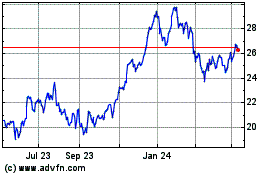
Fortescue (ASX:FMG)
Historical Stock Chart
From Dec 2023 to Dec 2024
