XRP Price Ready For 4x Jump To $2.6 As Major Bullish Pattern Breaks Occurs
01 October 2024 - 5:00AM
NEWSBTC
The XRP recent price movements have caused a major stir in the
crypto market, with the cryptocurrency experiencing a significant
price surge and breaking out of crucial resistance levels. Driven
by its recent bullish momentum, XRP has succeeded in breaking a key
bullish pattern, as a result, a crypto analyst has predicted that
it could potentially jump 4X to new highs of $2.6. XRP Price
Set Sights On Midterm Target At $2.3 After experiencing slow growth
and bearish momentum in the past few weeks, XRP has sparked renewed
confidence amongst investors with its latest price surge. Over the
last seven days, XRP has skyrocketed by 8.93% and is showing signs
of more gains in the future. Related Reading: PEPE Confirms
Breakout From Symmetrical Triangle: How Far Can It Go? This bullish
outlook is shared by prominent crypto analyst, Captain Faibik, who
disclosed in an X (formerly Twitter) post on September 28, that XRP
has just broken a unique bullish pattern, indicating a potential
for a major price rally. In Faibik’s XRP price chart, a
multi-year bullish symmetrical triangle pattern can be seen. This
triangle pattern began forming in October 2021 and has extended
through to September 2024, with XRP undergoing significant price
fluctuations throughout this period. After experiencing its
first substantial price surge in weeks, XRP successfully broke out
of this bullish triangle pattern. The extent of XRP’s recent price
increase is evident in CoinMarketCap’s data, which indicates that
the cryptocurrency has jumped by 4.73% in the last 24 hours.
This significant price increase suggests that XRP may be aiming to
push significantly above its previous consolidation levels of
around $0.5. As of writing, XRP is trading at $0.64, underscoring a
possible rise in investor interest and demand for the
cryptocurrency. By breaking out of this bullish triangle
pattern, Faibik believes that XRP could be on track for a massive
rally that could push its price by 4X. The analyst has declared
that XRP is currently heating up for a massive breakout to mid-term
targets at $2.3. XRP Breaks Critical Trendline A crypto and
Elliott Wave analyst, identified as ‘XForceGlobal’ on X has
highlighted a unique trendline in XRP’s price chart. According to
the analyst, XRP has just broken the “multilayer BD trendline,’ and
may be heading towards a price increase. Related Reading:
Ripple Vs. SEC Battle Far From Over As Regulator Opposes Court’s
Decision XForceGlobal has suggested that if XRP can maintain a
price above this trendline for a few more weeks, it could witness a
price increase between $7 to $10. The analyst has expressed
confidence in his bullish forecast, indicating that a surge within
this range was inevitable if the right conditions were met.
To be more precise, the analyst predicts via a detailed chart that
XRP’s price could potentially rise to $8.67, marking a 1,482%
increase from its current price of $0.6. Featured image
created with Dall.E, chart from Tradingview.com
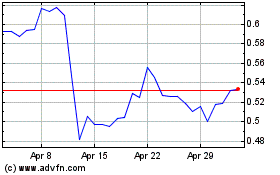
Ripple (COIN:XRPUSD)
Historical Stock Chart
From Oct 2024 to Nov 2024

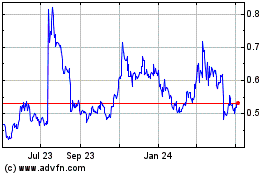
Ripple (COIN:XRPUSD)
Historical Stock Chart
From Nov 2023 to Nov 2024
