false
0001083446
0001083446
2024-01-10
2024-01-10
iso4217:USD
xbrli:shares
iso4217:USD
xbrli:shares
UNITED STATES
SECURITIES AND EXCHANGE COMMISSION
Washington,
DC 20549
FORM 8-K
CURRENT REPORT
Pursuant to Section 13 or 15(d)
of the
Securities Exchange Act of 1934
Date of report (Date of earliest event reported): January 10, 2024
APOLLO MEDICAL HOLDINGS, INC.
(Exact Name of Registrant as Specified in its
Charter)
| Delaware |
001-37392 |
95-4472349 |
| (State or Other Jurisdiction |
(Commission |
(I.R.S. Employer |
| of Incorporation) |
File Number) |
Identification No.) |
1668 S. Garfield Avenue, 2nd Floor, Alhambra, California 91801
(Address of Principal Executive Offices) (Zip Code)
(626) 282-0288
Registrant’s Telephone Number, Including
Area Code
(Former Name or Former Address, if Changed Since
Last Report)
Check the appropriate box below if the Form 8-K filing is intended to simultaneously satisfy the filing obligation of the registrant under any of the following provisions:
| ¨ |
Written communications pursuant to Rule 425 under the Securities Act (17 CFR 230.425) |
| ¨ |
Soliciting material pursuant to Rule 14a-12 under the Exchange Act (17 CFR 240.14a-12) |
| ¨ |
Pre-commencement communications pursuant to Rule 14d-2(b) under the Exchange Act (17 CFR 240.14d-2(b)) |
| ¨ |
Pre-commencement communications pursuant to Rule 13e-4(c) under the Exchange Act (17 CFR 240.13e-4(c)) |
Securities registered pursuant to Section 12(b) of the Act:
| Title of each class |
Trading Symbol(s) |
Name of each exchange on which registered |
| Common Stock |
AMEH |
The Nasdaq Stock Market LLC |
Indicate by check mark whether the registrant is an emerging growth
company as defined in Rule 405 of the Securities Act of 1933 (§230.405 of this chapter) or Rule 12b-2 of the Securities Exchange
Act of 1934 (§240.12b-2 of this chapter).
Emerging growth company ¨
If an emerging growth company, indicate by check mark if the registrant has elected not to use the extended transition period for complying with any new or revised financial accounting standards provided pursuant to Section 13(a) of the Exchange Act. ¨
| Item 7.01 | Regulation FD Disclosure. |
Attached as Exhibit 99.1 to this Current
Report on Form 8-K is a series of slides reflecting financial information about Apollo Medical Holdings, Inc. (the “Company”)
for use by the Company in connection with potential meetings with investors and/or analysts. The Company does not undertake to update
the information contained in the attached presentation materials.
The information contained in this Current Report on Form 8-K, including
the exhibit referenced herein, is being furnished and shall not be deemed “filed” for purposes of Section 18 of the Securities
Exchange Act of 1934, as amended (the “Exchange Act”), or otherwise subject to the liabilities of that section. Such information
shall not be incorporated by reference into any filing under the Securities Act of 1933, as amended, or the Exchange Act, whether made
before or after the date hereof, regardless of any general incorporation language in such filing. The furnishing of this information
will not be deemed an admission as to the materiality of any information contained herein.
| Item 9.01 | Financial Statements and Exhibits. |
(d) Exhibits.
Forward-Looking Statements
This Current Report on Form 8-K contains forward-looking statements
within the meaning of Section 27A of the Securities Act of 1933, as amended, and Section 21E of the Exchange Act. These statements include
words such as “forecast,” “guidance,” “projects,” “estimates,” “anticipates,”
“believes,” “expects,” “intends,” “may,” “plans,” “seeks,” “should,”
or “will,” or the negative of these words or similar words. Forward-looking statements involve certain risks and uncertainties,
and actual results may differ materially from those discussed in each such statement. A number of important factors could cause actual
results to differ materially from those included within or contemplated by the forward-looking statements, including, but not limited
to, the factors described in the Company’s filings with the Securities and Exchange Commission, including the Company’s Annual
Report on Form 10-K/A for the year ended December 31, 2022 and subsequent quarterly reports on Form 10-Q. The Company does not undertake
any responsibility to update any of these factors or to announce publicly any revisions to any of the forward-looking statements contained
in this or any other document, whether as a result of new information, future events, or otherwise.
SIGNATURES
Pursuant to the requirements of the Securities
Exchange Act of 1934, the registrant has duly caused this report to be signed on its behalf by the undersigned hereunto duly authorized.
| |
APOLLO MEDICAL HOLDINGS, INC. |
| |
|
| Date: January 10, 2024 |
By: |
/s/ Thomas S. Lam |
| |
Name: |
Thomas S. Lam, M.D., M.P.H. |
| |
Title: |
Co-Chief Executive Officer and President |
Exhibit 99.1

Apollo Medical Holdings January 2024 Powered by Technology. Built by Doctors. For Patients.

Forward - looking Statements This presentation contains forward - looking statements within the meaning of the Private Securities Litigation Reform Act of 1995 , Section 27A of the Securities Act and Section 21E of the Exchange Act. Forward - looking statements include any statements about the Company's business, financial condition, operating results, plans, object ive s, expectations and intentions, expansion plans, estimates of our total addressable market, integration of acquired companies and any projections of earnings, revenue, EBITDA, Adjusted EBITDA or other financial items, su ch as the Company's projected capitation and future liquidity, and may be identified by the use of forward - looking terms such as “anticipate,” “could,” “can,” “may,” “might,” “potential,” “predict,” “should,” “estima te,” “expect,” “project,” “believe,” “plan,” “envision,” “intend,” “continue,” “target,” “seek,” “will,” “would,” and the negative of such terms, other variations on such terms or other similar or comparable words, phrases or term ino logy. Forward - looking statements reflect current views with respect to future events and financial performance and therefore cannot be guaranteed. Such statements are based on the current expectations and certain a ssu mptions of the Company’s management, and some or all of such expectations and assumptions may not materialize or may vary significantly from actual results. Actual results may also vary materially from f orw ard - looking statements due to risks, uncertainties and other factors, known and unknown, including the risk factors described from time to time in the Company’s reports to the U.S. Securities and Exchange Commissio n ( the “SEC”), including without limitation the risk factors discussed in the Company's Annual Report on Form 10 - K/A for the year ended December 31, 2022, and subsequent Quarterly Reports on Form 10 - Q. Because the factors referred to above could cause actual results or outcomes to differ materially from those expressed or imp lie d in any forward - looking statements, you should not place undue reliance on any such forward - looking statements. Any forward - looking statements speak only as of the date of this presentation and, unless legally re quired, the Company does not undertake any obligation to update any forward - looking statement, as a result of new information, future events or otherwise. This presentation contains the non - GAAP financial measures EBITDA and Adjusted EBITDA, of which the most directly comparable fin ancial measure presented in accordance with U.S. generally accepted accounting principles (“GAAP”) is net income. These measures are not in accordance with, or alternatives to, GAAP, and may be calculated di fferently from similar non - GAAP financial measures used by other companies. The Company uses Adjusted EBITDA as a supplemental performance measure of our operations, for financial and operational decision - mak ing, and as a supplemental means of evaluating period - to - period comparisons on a consistent basis. Adjusted EBITDA is calculated as earnings before interest, taxes, depreciation, and amortization, excluding in come or loss from equity method investments, non - recurring transactions, stock - based compensation, and APC excluded assets costs. Beginning in the third quarter ended September 30, 2022, the Company has revised th e calculation for Adjusted EBITDA to exclude provider bonus payments and losses from recently acquired IPAs, which it believes to be more reflective of its business. The Company believes the presentation of these non - GAAP financial measures provides investors with relevant and useful informati on, as it allows investors to evaluate the operating performance of the business activities without having to account for differences recognized because of non - core or non - recurring financial information. When GAAP financial measures are viewed in conjunction with non - GAAP financial measures, investors are provided with a more meaningful understanding of the Company’s ongoing operating performance. In addition, thes e n on - GAAP financial measures are among those indicators the Company uses as a basis for evaluating operational performance, allocating resources, and planning and forecasting future periods. Non - GAAP financial me asures are not intended to be considered in isolation, or as a substitute for, GAAP financial measures. Other companies may calculate both EBITDA and Adjusted EBITDA differently, limiting the usefulness of the se measures for comparative purposes. To the extent this Presentation contains historical or future non - GAAP financial measures, the Company has provided corresponding GAAP financial measures for comparative purposes. The reconciliation between certain GAAP and non - GAAP measures is provided in the Appendix. The Company has not provided a quantitative reconciliation of applicable non - GAAP measures, such as EBITDA margin targets, to th e most comparable GAAP measure, such as net income, on a forward - looking basis within this presentation because the Company is unable, without unreasonable efforts, to provide reconciling information with re spect to certain line items that cannot be calculated. These items, which could materially affect the computation of forward - looking GAAP net income, are inherently uncertain and depend on various factors, some of which are outside of the Company’s control. 2 Use of Non - GAAP Financial Measures

ApolloMed at - a - glance 3 ApolloMed is a healthcare platform that organizes and enables providers to drive accessible , high - quality , and high - value care for all patients through a provider - centric, technology - empowered approach The three segments of our proven business model are: 10k+ Providers in ApolloMed network 1 ~900k Total value - based lives 30+ Markets 20+ Payer partners $141M TTM Adj. EBITDA $1.3B TTM revenue Care Delivery: Flexible footprint of owned primary care and multi - specialty clinics with employed providers who deliver personalized care Care Partners: Affiliated and employed provider network , empowered to take risk across all health plan lines of business to deliver integrated care Care Enablement: Comprehensive technology and solutions platform , powering all providers to deliver the best possible care to all patients in their communities Note: TTM ended September 30, 2023. For more information, see “Reconciliation of Net Income to EBITDA and Adjusted EBITDA” an d “ Use of Non - GAAP Financial Measures“ slides for more information 1 Includes contracted and employed providers in our provider network, across all specialties, and including both Consolidated a nd Managed providers 2 ApolloMed figures based on analysis of Jan - Sept 2023 internal data from all consolidated IPAs (Medicare Advantage) 49% Lower hospital admissions per k vs. benchmark 2 46% Lower ER visits per k vs. benchmark 2 FINANCIAL STRENGTH A PLATFORM WITH… DEMONSTRABLE CLINICAL OUTCOMES SCALE

The ApolloMed model 4 • We successfully serve our communities by building broad networks of affiliated Primary and Specialist providers and supplementing them with our employed providers • Our flexible model meets all patients across all care settings 1 Includes contracted and employed providers in our provider network, across all specialties, and including both Consolidated a nd Managed providers 2 ApolloMed figures based on analysis of Jan - Sept 2023 internal data from all consolidated IPAs (Medicare Advantage) 3 MCR, or Medical Cost Ratio, calculated as Cost of services, excluding depreciation and amortization, divided by Total Revenue ; based on ApolloMed’s Core SoCal market, comprised of ~236k members in 2019 and ~319k members as of 09/30/2023 In the communities we serve, our expansive network of providers delivers high - quality and high - value coordinated care to patient s, with seamless and flexible access • Our provider - centric, purpose - built solutions drive consistency in care and superior clinical outcomes • High - quality care keeps our patients healthier and happier , improving overall quality of life • We engage patients in preventive care and coordinate high - value care to reduce unnecessary medical spend • With 35+ years of experience , we have built a model that drives savings and sustainable, profitable unit economics Improves access to care Powers high - quality outcomes Drives high - value care ~1,500bps Decrease in MCR from 2019 - YTD Q3 2023 3 10,000+ Employed and affiliated providers 1 49% Lower hospital admissions per k vs. benchmark 2

5 The ApolloMed model transforms the status quo into a highly coordinated, high - value, accessible healthcare ecosystem CLINICAL AND COORDINATED CARE SOLUTIONS TECHNOLOGY SUITE SOLUTIONS PAYER AND ADMINISTRATIVE SOLUTIONS Care Enablement Through our flexible approach, we plan to continue organizing and empowering providers across the U.S., accelerating towards a f uture where all Americans have access to high - quality, high - value, and accessible healthcare x We organize and partner with providers to create risk - bearing organizations in our Care Partners (“CP”) segment x Our CP entities contract with payers, entering value - based care (“VBC”) arrangements x Through our Care Enablement platform, we provide comprehensive technology and support solutions to providers x We constantly analyze our networks and build/acquire centers in our Care Delivery business to enhance access and care Care Delivery Affiliate providers Insufficient / costly access to quality care Poor provider and patient satisfaction Limited technology and coordinated care Status Quo The ApolloMed Model ~20 Others + Risk - bearing organization (Care Partners)

Our flexible model optimizes delivery of accessible, high - quality, high - value care 6 + ~20 Others Care Partners Care Enablement TECHNOLOGY SUITE SOLUTIONS CLINICAL & COORDINATED CARE SOLUTIONS PAYER AND ADMINISTRATIVE SOLUTIONS Ops Automation VBE 1 Suite & Data Lake Point of Care Tools Analytics & Reporting Quality Clinical Programs Remote Patient Monitoring UM 2 & Care Management Provider Relations Contracting & Credentialing Revenue Cycle Prior Authorization Third - Party Clients Care Delivery Primary Care Ancillary Services Outpatient Clinics Multi - Specialty Care Delivery Affiliate providers 1 Value - Based Enablement 2 Utilization Management Risk - bearing organization (Care Partners) Affiliate Providers Primary Care Ancillary Services Outpatient Clinics Multi - Specialty

Care Partners : High - performing network of aligned provider partners 7 • Acts as a “single payer” for our network of providers, enabling VBC arrangements (i.e., full - risk contracts) • Serves all patients, including Medicare FFS, Medicare Advantage, Medicaid, Commercial and Exchange • Enables continuity of care in ApolloMed’s ecosystem across age, stage of life, or life circumstance • Empowers providers, with support from our ApolloMed Care Teams, Care Enablement technology, and operations platform 6,200+ Affiliated Providers 1 575k+ Members in VBC Contracts ~90% ApolloMed’s Revenue Mix 2 10 - 20% Long - term EBITDA Margin Target Note: See “Use of Non - GAAP Financial Measures“ slide for more information 1 Includes contracted and employed providers in our provider network, across all specialties, and including only Consolidated p ro viders 2 As of the TTM period ending September 30, 2023; ApolloMed standalone data (does not pro forma for CFC acquisition) CLINICAL AND COORDINATED CARE SOLUTIONS TECHNOLOGY SUITE SOLUTIONS PAYER AND ADMINISTRATIVE SOLUTIONS Care Enablement Care Partners + ~20 Others Care Delivery Primary Care Ancillary Services Outpatient Clinics Multi - Specialty Affiliate Providers Primary Care Ancillary Services Outpatient Clinics Multi - Specialty • Meets providers where they are; enables independent providers to remain independent while succeeding in value - based care

8 Note: See “Use of Non - GAAP Financial Measures“ slide for more information 1 As of the TTM period ending September 30, 2023; ApolloMed standalone data (does not pro forma for CFC acquisition) Care Delivery : Extensive, high - quality network of employed providers • Primary care, multispecialty care, imaging, and laboratory clinics with 61 locations across 3 states to enhance access to care for patients • We analyze our Care Partners networks by specialty and geography, and build / acquire practices and provider groups to fulfill network gaps in access, and ensure patients have high - quality access to care • Ability to build out clinics tailor - made for specific markets help us scale as we enter de novo into new markets • Provides ApolloMed with a de - risked growth avenue, as we can acquire high - performing Care Partners or Care Enablement clients 61 Locations >700k Unique Patients Seen Annually ~5% ApolloMed’s Revenue Mix 1 10 - 20% Long - term EBITDA Margin Target CLINICAL AND COORDINATED CARE SOLUTIONS TECHNOLOGY SUITE SOLUTIONS PAYER AND ADMINISTRATIVE SOLUTIONS Care Enablement Care Partners + ~20 Others Care Delivery Primary Care Ancillary Services Outpatient Clinics Multi - Specialty Care Delivery Primary Care Ancillary Services Outpatient Clinics Multi - Specialty Affiliate Providers Primary Care Ancillary Services Outpatient Clinics Multi - Specialty

9 Note: See “Use of Non - GAAP Financial Measures“ slide for more information 1 Includes contracted and employed providers in our provider network, across all specialties, and including both Consolidated a nd Managed providers 2 As of the TTM period ending September 30, 2023; ApolloMed standalone data (does not pro forma for CFC acquisition) Care Enablement : End - to - end integrated clinical, operational, financial, and administrative platform • Our technology and support platform enhances delivery of high - quality and high - value care to our patients • Our Care Enablement tools are leveraged across our Care Partners and Care Delivery lines of business • Our Care Enablement solutions are also used by 3 rd party providers outside of our ecosystem • Our platform is underpinned by 35+ years of real - world data, driving superior clinical and financial outcomes 10,000+ Providers in ApolloMed Network 1 ~900k Members in VBC Contracts ~5% ApolloMed’s Revenue Mix 2 20 - 30% Long - term EBITDA Margin Target CLINICAL AND COORDINATED CARE SOLUTIONS TECHNOLOGY SUITE SOLUTIONS PAYER AND ADMINISTRATIVE SOLUTIONS Care Enablement Care Partners Care Delivery Care Partners + ~20 Others Care Delivery Primary Care Ancillary Services Outpatient Clinics Multi - Specialty Affiliate Providers Primary Care Ancillary Services Outpatient Clinics Multi - Specialty

29% 36% 23% 11% 1% < 18 yrs 18 - 45 yrs 45 - 65 yrs 65 - 85 yrs 85+ yrs ApolloMed's diverse member base is served by its experienced and loyal provider network through all stages of life 10 Diverse patient demographic 96% Total members in full - risk or partial risk arrangements 2 Significant risk - taking opportunity 98% Avg annual provider retention 3 Robust provider retention 11.1 Average tenure across providers of ApolloMed - owned IPAs Experienced providers ~900k Total value - based lives 48% 21% 12% 6% 13% Benefits of the ApolloMed platform 1 Asian American and Pacific Islander 2 Membership by risk contract type is not pro forma for the acquisition of CFC 3 Based on owned IPA provider network x Seamless access to high - quality primary care and broad specialty care networks x All stakeholders benefit from earlier, high - value, preventive and coordinated care, keeping members healthier as they age into Medicare x Improved clinical outcomes for all patient types and ages, decreasing medical costs in the long - run x Care from engaged providers, enabled by actionable technology ApolloMed serves members across their lifetime Hispanic / Latino Black / African American AAPI 1 White / Caucasian Other Membership by Age

Our proprietary & purpose - built technology platform leverages 35+ years of real - world clinical data to drive scalable and repeatable results 11 Note: All images presented are for illustrative purposes only 1 ApolloMed’s Care Team includes MDs, NPs, PAs, RNs, LVNs, etc. 2 SDOH = Social Determinants of Health 3 Indicates percentage of members attributed to a Primary Care providers that actively uses Provider Empowerment and Engagement to ols. 4 Member satisfaction rate, based on members engaged by ApolloMed’s Outpatient Care Management Team in 2023 5 Trends are customizable by specialty, by region, with trends in prior authorization counts, utilization, costs, among other t re nds 6 ~60% of total possible gaps in care identified YTD as of 9/30/2023 were closed through our portal Provider Empowerment and Engagement • All - in - one point - of - care tool for both providers and practices x Check member eligibility x Submit & receive auto - approval for prior authorizations x View & act on quality and risk adjustment gaps x Collaborate with Care Teams 1 x View longitudinal patient records, SDOH 2 , and population health data 90%+ Members with active PCP 3 Care Management & Patient Outcomes • Intelligent patient population risk stratification • Focused and purposeful member Care Management Plans to ensure evidence - based solutions and responses • 250 full - time employees on our Care Team 2 , improving delivery of care and patient outcomes ~100% Member satisfaction rate 4 Population Health and Analytics • NCQA - certified HEDIS ® engine drives actionable insights for providers, closing gaps in care • Composable “Command Center” dashboard highlights trends 5 and opportunities to improve access and quality for patients • Care access analytics highlights provider network opportunities ~60% Gaps in care closed through portal 6 Operating Leverage • Scalable platform yields meaningful operating leverage • 65% prior authorizations are automatically approved, driving increased access for patients • Ability to demonstrably improve operating leverage for third - party Care Enablement clients 94% Claims adjudicated automatically

Our dedicated provider network, technology and solutions platform combine to drive superior clinical outcomes 12 MA 1 ACO 2 Source: Centers for Medicare and Medicaid Services 1 ApolloMed figures based on analysis of Jan - Sept 2023 internal data from all consolidated IPAs in Medicare Advantage 2 2023 ACO REACH Model, figures based on analysis of internal data from Jan - Sept 2023 3 Based on ApolloMed’s Core SoCal market, comprised of ~236k members in 2019 and ~319k members as of 09/30/2023 49% 46% 13% 55% (Hospital admissions per k, % change vs. benchmark) (ER visits per k, % change vs. benchmark) (Improvement in MCR 3 per year, since 2019) We keep patients healthier and out of the hospital unnecessarily… … as well as minimize unnecessary visits to the Emergency Room 2 years Proven path to profitability in new markets, on average, within ~400 bps Proven ability to reduce MCRs while controlling costs

Revenue We have a strong track record of revenue growth and a robust EBITDA profile 13 2020 - 2021 Adj. EBITDA benefitted from tailwinds of lower utilization during the COVID - 19 pandemic Return to pre - pandemic utilization in 2022 and 2023 $561 $687 $774 $1,144 $1,340 - $1,390 ($ in millions) 2019 2020 2021 2022 2023E 25% CAGR $54 $103 $134 $140 27% CAGR 2019 2020 2021 2022 2023E $135 - $150 10% 12% 17% 15% 10% 1 % Adj. EBITDA Margin Note: For more information, see “Reconciliation of Net Income to EBITDA and Adjusted EBITDA” and “Use of Non - GAAP Financial Meas ures“ slides for more information 1 Based on the mid - point of guidance provided ($ in millions) Adj. EBITDA 1 1

Advance Contracts Across Risk Spectrum • Migrate member lives under partial - risk contracts into full - risk and total cost of care arrangements Our multi - pronged growth strategy positions ApolloMed to capture significant embedded upside Grow Within Existing Markets • Continue to enhance core Southern California market, build out newly established Northern and Central CA markets, and build out recently entered TX/NV markets 14 Expand Into New Markets • Transform healthcare for local communities across the country by leveraging our adaptable and customizable provider engagement model for the best local fit Leverage All Our Business Models To Meet Providers Where They Are And Drive De - risked Growth • Drive success in our Care Enablement model before vertically integrating into our Care Partners and Care Delivery segments, enhancing our economics and path to taking full - risk Identify and Execute Opportunistic M&A • Continue to execute on M&A strategy across all segments and lines of business 3 4 1 2
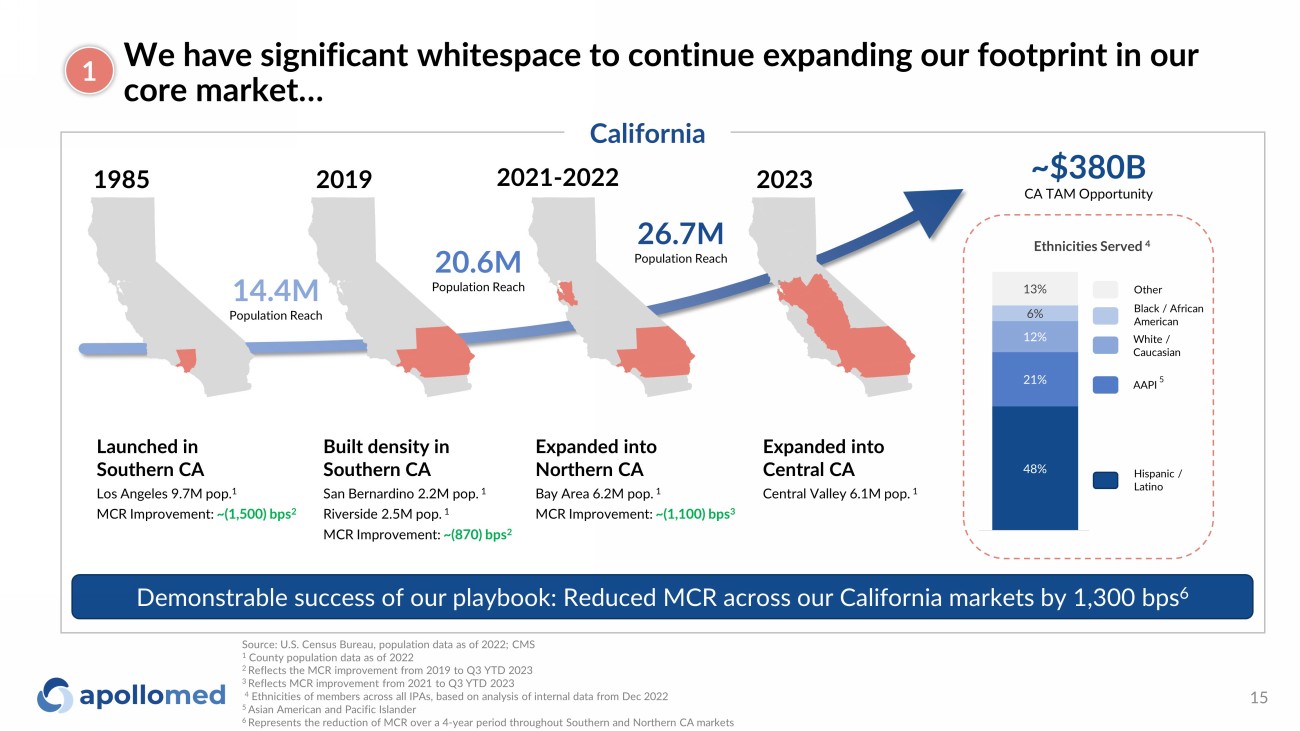
We have significant whitespace to continue expanding our footprint in our core market… 15 1 California Source: U.S. Census Bureau, population data as of 2022; CMS 1 County population data as of 2022 2 Reflects the MCR improvement from 2019 to Q3 YTD 2023 3 Reflects MCR improvement from 2021 to Q3 YTD 2023 4 Ethnicities of members across all IPAs, based on analysis of internal data from Dec 2022 5 Asian American and Pacific Islander 6 Represents the reduction of MCR over a 4 - year period throughout Southern and Northern CA markets Demonstrable success of our playbook: Reduced MCR across our California markets by 1,300 bps 6 1985 2019 2021 - 2022 2023 Built density in Southern CA San Bernardino 2.2M pop. 1 Riverside 2.5M pop. 1 MCR Improvement: ~(870) bps 2 Expanded into Northern CA Bay Area 6.2M pop. 1 MCR Improvement: ~(1,100) bps 3 Expanded into Central CA Central Valley 6.1M pop. 1 Launched in Southern CA Los Angeles 9.7M pop. 1 MCR Improvement: ~(1,500) bps 2 14.4M Population Reach 20.6M Population Reach 26.7M Population Reach ~$380B CA TAM Opportunity 48% 21% 12% 6% 13% Ethnicities Served 4 Other Black / African American White / Caucasian Hispanic / Latino AAPI 5
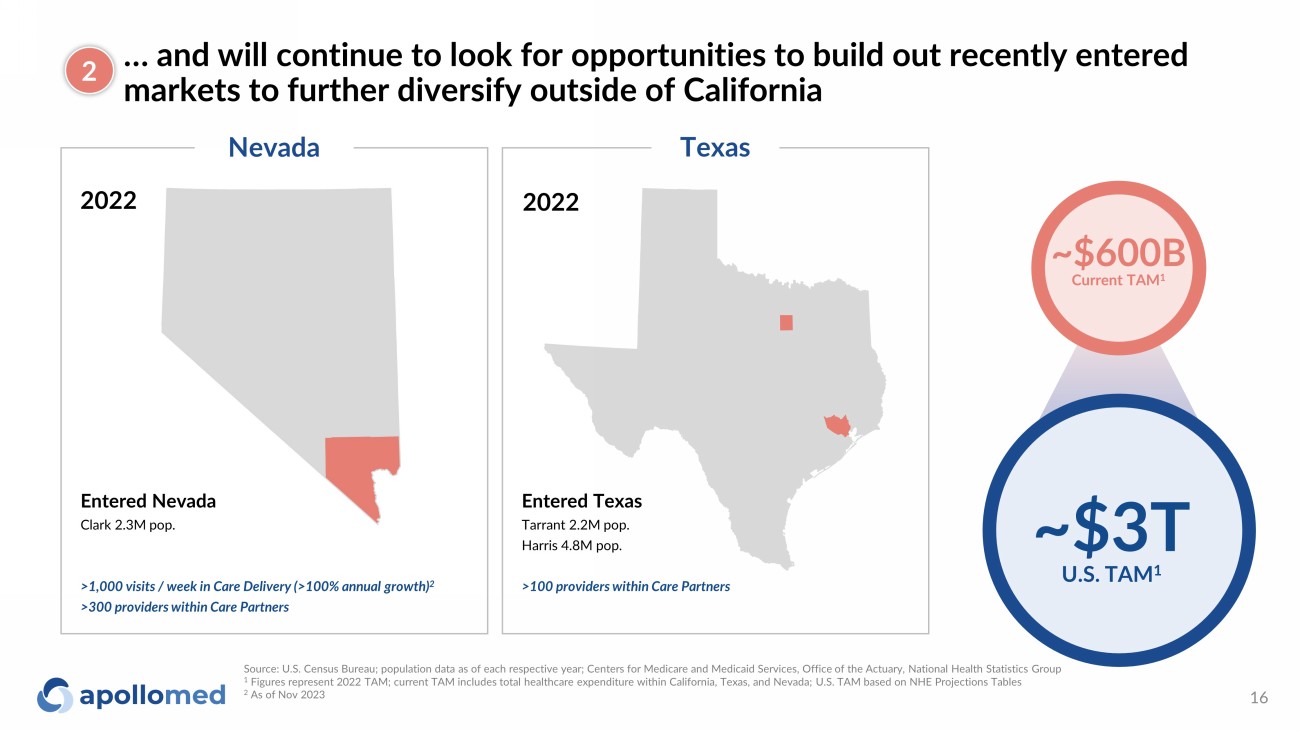
… and will continue to look for opportunities to build out recently entered markets to further diversify outside of California 16 Nevada Texas Source: U.S. Census Bureau; population data as of each respective year; Centers for Medicare and Medicaid Services, Office of th e Actuary, National Health Statistics Group 1 Figures represent 2022 TAM; current TAM includes total healthcare expenditure within California, Texas, and Nevada; U.S. TAM ba sed on NHE Projections Tables 2 As of Nov 2023 2 Entered Nevada Clark 2.3M pop. >1,000 visits / week in Care Delivery (>100% annual growth) 2 >300 providers within Care Partners Entered Texas Tarrant 2.2M pop. Harris 4.8M pop. >100 providers within Care Partners 2022 2022 ~$600B Current TAM 1 ~$3T U.S. TAM 1

Note: See “Use of Non - GAAP Financial Measures“ slide for more information 1 Membership by risk contract type is not pro forma for the acquisition of CFC 2 Includes ~45% Institutional Capitation payments, covering downstream medical spend for Hospitals / Facilities 3 “Cost of care” includes payments for Primary Care services and Secondary Provider services, such as radiology, diagnostic ima gi ng, physical therapy, and other services that are not provided by a PCP; Also includes shared savings payments to ApolloMed's Partners (Primary Care, Secondary Providers under partial - risk contracts, as wel l hospital partners under full - risk contracts; under full - risk contracts), “cost of care” also includes all other medical costs, including hospital inpatient services 4 Includes operating expense and corporate overhead, as well as intercompany Care Enablement fees, excluding interest, tax, dep re ciation and amortization As we move across the risk spectrum, our unit economics improve demonstrably 17 100% 40% Total Premium (-) Retained by Health Plan (-) Institutional cap Revenue to (-) Cost of care (-) OpEx EBITDA to 100% 85% Total Premium (-) Retained by Health Plan Revenue to (-) Cost of care (-) OpEx EBITDA to As we shift lives into full - risk arrangements, we capture a higher portion of the premium dollar, deliver high - quality and high - value care, leading to superior outcomes and improved unit economics 3 4 ~9 - 17% 3 4 ~5 - 10% Partial - risk (90% 1 of lives) Full - risk (6% 1 of lives) 12.5% - 25% EBITDA Margin to 10% - 20% EBITDA Margin to 3 2

Advancing our contracts across the risk spectrum allows us to better deliver whole - person care and drives outsized economics 18 Patient Mix Revenue Mix Full Risk Other • Substantial opportunity exists to drive embedded platform value through advancing contracts across the risk spectrum • ApolloMed has a proven track record of managing risk and contains significant upside potential delivering whole person care 3

Care Enablement clients provide a pipeline of potential acquisition targets, like Community Family Care 19 • Unique network of providers focused on Medicaid strengthens our ability to reach underserved populations • Highly attractive synergy opportunities: o Ability to capture full unit economics o Transition Medicare members to full - risk o Transition ApolloMed CA Medicaid members to full - risk • Scaled Medicaid - focused group with over 200k patients across Medicare, Medicaid and Commercial payors in LA • CFC already bears full - risk on Medicaid members via RKK health plan license Breadth of CFC Provider Network and Membership Concentration x Expected Closing • Two - part close to occur, anticipated in Q1 2024 Financial Highlights $190M 2023E Revenue $25M 2023E EBITDA 8.1x FV / 2023E EBITDA Consideration $202M Total consideration $152M cash $20M equity $30M performance - based milestone payments 4 Community Family Care (“CFC”) Overview Strategic Rationale Transaction Highlights CFC since joining ApolloMed as a Care Enablement Client in 2020 x 18% Revenue CAGR 35% EBITDA CAGR Note: See “Reconciliation of Net Income to EBITDA - Community Family Care” and “Use of Non - GAAP Financial Measures“ slides for m ore information

Reiterating 2023E Guidance 20 Total Revenue $1,144.2 $1,340.0 - $1,390.0 Adjusted EBITDA 1 $140.0 $135.0 - $150.0 EPS - Diluted $0.99 $1.10 - $1.20 ($ in millions, except for per share information) Actual YE 2022 Results 2023 Guidance Range 1 See “Reconciliation of Net Income to EBITDA and Adjusted EBITDA,” “Guidance Reconciliation of Net Income to EBITDA and Adjusted E BI TDA” and “Use of Non - GAAP Financial Measures” slides for more information. There can be no assurance that actual amounts will not be materially higher or lower than these expectations.

21 Experienced, mission - driven management team with deep clinical knowledge and a proven ability to execute Kenneth Sim, MD Thomas Lam, MD, MPH Brandon Sim, MS Chan Basho, MBA Jeremy Jackson, MD Executive Chairman Co - Chief Executive Officer & President Co - Chief Executive Officer Chief Strategy & Financial Officer Chief Quality Officer Previous Experience Previous Experience Previous Experience Previous Experience Previous Experience Education Education Education Education Education

Key takeaways 22 Note: For more information, see “Reconciliation of Net Income to EBITDA and Adjusted EBITDA” and “Use of Non - GAAP Financial Meas ures“ slides for more information 1 Across all consolidated ApolloMed IPAs for Medicare Advantage as of 09/30/2023 , benchmarks derived from CMS data 2 Growth figures are based on historical revenue and mid - point of guidance for 2023E 3 As of 09/30/2023 Clear levers and a repeatable growth playbook to drive further nationwide expansion 25% 2 4 - year revenue CAGR with clear visibility into continued 25%+ growth 2 Flexible, capital - efficient and pure - play value - based care model with predictable unit economics Ability to serve providers and patients through our care partners, care delivery and care enablement platforms Proven track record of consistent profitability 27% EBITDA CAGR and, 10% - 17% adj. EBITDA margins over the last 4 years 2 Our tech - powered, integrated care delivery model results in robust clinical outcomes Hospital admissions per thousand 49% below benchmark; ER visits per thousand 46% below benchmark 1 Positioned to create a future where all can get access to high - quality, high - value, and accessible healthcare 0.9M members in VBC arrangements across Medicare, Medicaid, and Commercial populations 3

23

Appendix

Highly differentiated, scaled platform is a leader in value - based care 25 Business Model Serves All Patient Types Track Record of Care Delivery Majority (8) Revenue in VBC Affiliate provider model 508K (3) 25 $4,191M $17M O O P 7 Years Affiliate and owned provider model ~900K (1) 30+ $1,328M $141M P P P 38 Years Affiliate provider model ~130K (5) 18 $1,178M ($81M) O O P 3 Years Affiliate and owned provider model 273K (4) 7 $764M $13M O O P 12 Years Affiliate provider model 1.1M (2) 14 $1,581M $70M P P O 16 Years Q3’23 LTM Adj. EBITDA (7) At - Risk Lives Q3’23 LTM Revenue Markets Consistent Profitability (6) 1 Investor presentation filed 11/30/2023 2 Q3 Earnings 8 - K 3 Q3 Earnings Transcript 4 Q3 Earnings 8 - K 5 Wells Fargo Healthcare Conference Presentation 6 Represents positive EBITDA over last 4 quarters 7 Privia profitable on adjusted EBITDA metric 8 Defined as greater than 50% of revenue

We serve a highly diversified mix of businesses and payer types 26 Revenue by Line of Business 63% 20% 12% 5% Medicare Medicaid Commerical Other Third Parties 87% 5% 3% 4% 1% Capitation, net Risk Pool Settlements & Incentives Management Fee Income Fee-for-service, net Other Income 6% 90% 4% Full-risk Partial-risk Fee-for-service / other Note: For the nine months ended September 30, 2023 1 Membership by risk contract type is not pro forma for the acquisition of CFC Membership by Risk Arrangement 1 Business Mix By Payer Type

Q3 2023 performance highlights; Updated 2023E Guidance 27 Total Revenue $1,144.2 $1,340.0 - $1,390.0 Net Income 1 $45.7 $59.5 - $71.5 EBITDA 1,2 $110.1 $114.5 - $129.5 Adjusted EBITDA 2 $140.0 $135.0 - $150.0 EPS - Diluted $0.99 $1.10 - $1.20 Q3 2023 financial results ($ in millions, except for per share information) Actual YE 2022 Results 2023 Guidance Range Revenue $348.2M Net income attr. to AMEH $22.1M EPS – diluted $0.47 Adj. EBITDA* $52.0M 1 Net income and EBITDA forecast includes the impact of APC excluded assets, which assume no change in value 2 See “Reconciliation of Net Income to EBITDA and Adjusted EBITDA,” “Guidance Reconciliation of Net Income to EBITDA and Adjust ed EBITDA” and “Use of Non - GAAP Financial Measures” slides for more information. There can be no assurance that actual amounts will not be materially higher or lower than these expectations.

Q3 2023 operational highlights 28 • Acquisition of Community Family Care and integration into Care Partner segment while continuing to leverage our Care Enablement platform; two part close expected to occur ; anticipated Q1 2024 • Advantage Health Network joins Care Partners business while continuing to be on Care Enablement platform • Acquisition of Ardmore Medical Clinic into our Care Delivery segment • Associated Hispanic Partners will be onboarded onto Care Enablement platform by Q1 2024 • Wider Circle – Enhanced Care Management joint venture provides comprehensive patient - centered care for Medicaid members with complex needs Care Enablement Care Delivery Care Partners

Updated 2023 Guidance 29 2023 Guidance (Original) 2023 Guidance (Updated) Low High Low High Total Revenue 1,300,000 1,500,000 1,340,000 1,390,000 Net Income 49,500 71,500 59,500 71,500 EBITDA 89,500 129,500 114,500 129,500 Adj. EBITDA 120,000 160,000 135,000 150,000 EPS - Diluted $0.95 $1.20 $1.10 $1.20 Note: See “Guidance Reconciliation of Net Income to EBITDA and Adjusted EBITDA” and “Use of Non - GAAP Financial Measures” for add itional information. There can be no assurance that actual amounts will not be materially higher or lower than these expectations. See “Forward - Looking Statements” for additional information. ($ in thousands, except EPS) 2023 Guidance (Original) 2023 Guidance (Updated) Low High Low High

$3.9 $3.9 $23.4 $27.3 Pre-Ownership Post-Ownership Care Partners Care Enablement Revenue Illustrative conversion of a Third - Party Care Enablement client to a Care Partner 30 Note: See “Use of Non - GAAP Financial Measures“ slide for more information 1 Illustrative analysis assumes a Care Enablement management fee of 10% of revenue for Care Enablement clients, and uses the mi d - point of long - term target EBITDA margin for ApolloMed’s Care Enablement segment, and the mid - point of long - term target margin for ApolloMed’s Care Partners segment Pre - ApolloMed Ownership Post - ApolloMed Ownership ▪ Third - party Clients leverage our Care Enablement (“CE”) platform to empower their providers and deliver quality care to patients ▪ ApolloMed has the capability, in a de - risked way, to acquire and convert third - party CE clients into Care Partner (“CP”) providers ▪ In doing so, there are several key benefits for all stakeholders: x Optimize and enhance economics to ApolloMed x Improved care through our medical management platform x Benefits of enhanced scale across ApolloMed’s network $15.6 $156.0 Pre-Ownership Post-Ownership Third-Party CE Client ApolloMed Revenue ($ in millions) Illustrative analysis 1 highlighting economics of converting a Third - Party Care Enablement client with 100k capitated lives into a Care Partner By converting Care Enablement clients to Care Partners, ApolloMed can capture additional economics through greater integratio n o f clinical care and by moving members into contracts with greater risk Adj. EBITDA

31 Summary of Selected Financial Results Three Months Ended September 30, Nine Months Ended September 30, $ in 000s except per share data 2023 2022 (restated) 2023 2022 (restated) Revenue Capitation, net $ 305,678 $ 227,571 $ 906,430 $ 677,253 Risk pool settlements and incentives 15,022 64,849 48,605 101,717 Management fee income 9,898 10,030 32,287 30,487 Fee - for - service, net 15,892 12,859 41,216 35,694 Other income 1,683 1,692 5,087 4,804 Total revenue 348,173 317,001 1,033,625 849,955 Total expenses 309,090 266,910 945,142 758,270 Income from operations 39,083 50,091 88,483 91,685 Net income 27,973 23,897 57,943 46,624 Net income (loss) attributable to noncontrolling interests 5,914 712 9,582 (2,275) Net income attributable to ApolloMed $ 22,059 $ 23,185 $ 48,361 $ 48,899 Earnings per share – diluted $ 0.47 $ 0.50 $ 1.03 $ 1.06 EBITDA $ 42,818 $ 48,216 $ 102,823 $ 94,299 Adjusted EBITDA $ 51,974 $ 57,136 $ 117,573 $ 116,374

32 Segment Results $ in 000s Care Partners Care Delivery Care Enablement Other Intersegment Elimination Corporate Costs Consolidated Total Total revenues $ 326,499 29,261 36,910 294 (44,791) - 348,173 % change vs prior year quarter 11% 18% 22% 10% Cost of services 279,769 25,647 13,658 76 (43,775) - 275,375 General and administrative expenses 1 6,390 4,649 16,804 875 (2,086 ) 7,083 33,715 Total expenses 286,159 30,296 30,462 951 (45,861) 7,083 309,090 Income (loss) from operations $ 40,340 (1,035) 6,448 (657) 1,070 2 (7,083) 39,083 % change vs prior year quarter (13%) (133%) 27% (22%) For the three months ended September 30, 2023 1 Balance includes general and administrative expenses and depreciation and amortization; 2 Income from operations for the intersegment elimination represents rental income from segments renting from other segments. Rental income is presented within other income, which is not presented in the table.

33 Balance Sheet Highlights $ in millions 09/30/2023 12/31/2022 $ Change Cash and cash equivalents and investments in marketable securities 1 $277.0 $293.6 ($16.6) Working capital $273.3 $279.5 ($6.2) Total stockholders’ equity $593.7 $542.6 $51.1 1 Excluding restricted cash
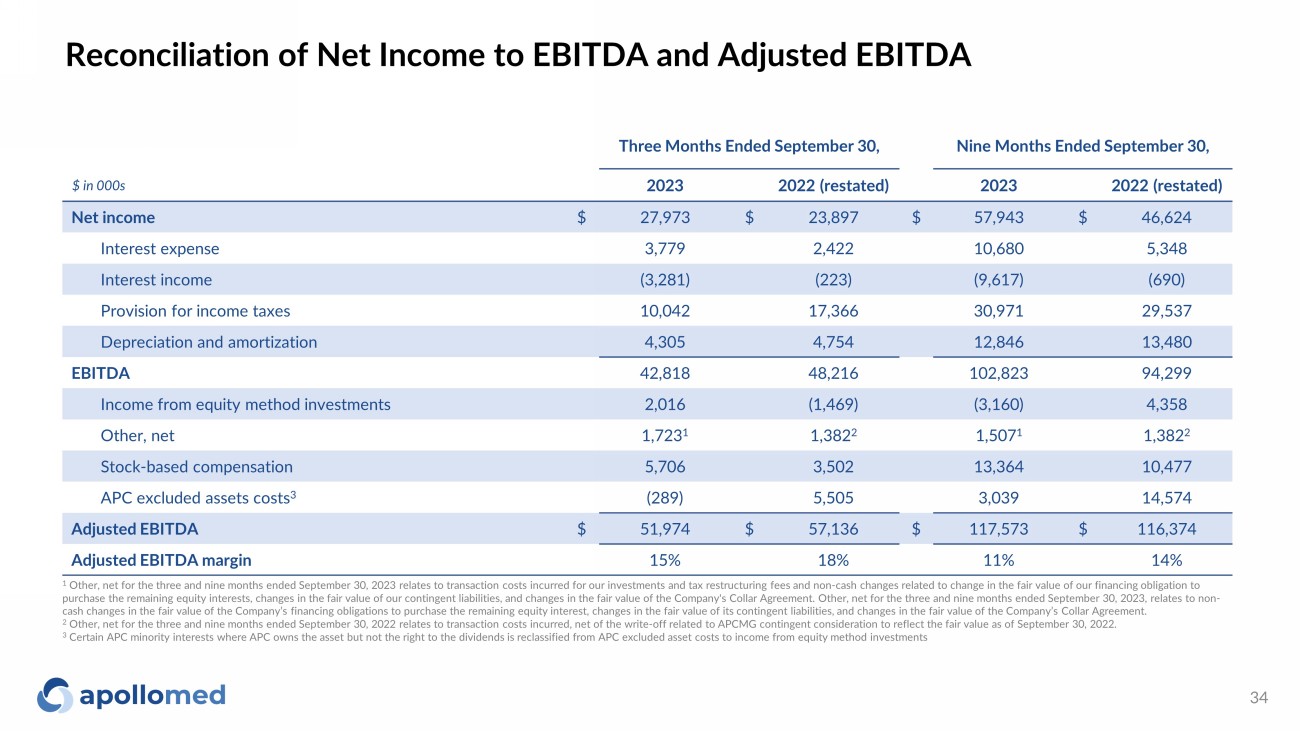
34 Reconciliation of Net Income to EBITDA and Adjusted EBITDA 1 Other, net for the three and nine months ended September 30, 2023 relates to transaction costs incurred for our investments and tax restructuring fees and non - cash changes related to change in the fair value of our financing obligation to purchase the remaining equity interests, changes in the fair value of our contingent liabilities, and changes in the fair val ue of the Company's Collar Agreement. Other, net for the three and nine months ended September 30, 2023, relates to non - cash changes in the fair value of the Company’s financing obligations to purchase the remaining equity interest, changes in t he fair value of its contingent liabilities, and changes in the fair value of the Company’s Collar Agreement. 2 Other, net for the three and nine months ended September 30, 2022 relates to transaction costs incurred, net of the write - off r elated to APCMG contingent consideration to reflect the fair value as of September 30, 2022. 3 Certain APC minority interests where APC owns the asset but not the right to the dividends is reclassified from APC excluded as set costs to income from equity method investments Three Months Ended September 30, Nine Months Ended September 30, $ in 000s 2023 2022 (restated) 2023 2022 (restated) Net income $ 27,973 $ 23,897 $ 57,943 $ 46,624 Interest expense 3,779 2,422 10,680 5,348 Interest income (3,281) (223) (9,617) (690) Provision for income taxes 10,042 17,366 30,971 29,537 Depreciation and amortization 4,305 4,754 12,846 13,480 EBITDA 42,818 48,216 102,823 94,299 Income from equity method investments 2,016 (1,469) (3,160) 4,358 Other, net 1,723 1 1,382 2 1,507 1 1,382 2 Stock - based compensation 5,706 3,502 13,364 10,477 APC excluded assets costs 3 (289) 5,505 3,039 14,574 Adjusted EBITDA $ 51,974 $ 57,136 $ 117,573 $ 116,374 Adjusted EBITDA margin 15% 18% 11% 14%

35 Reconciliation of Net Income to EBITDA and Adjusted EBITDA (cont’d) 1 See “Use of Non - GAAP Financial Measures” slide for more information; 2 Other, net for TTM ended September 30, 2023, relates to transaction costs incurred for our investments and tax restructuring fe es and non - cash changes related to change in the fair value of our financing obligation to purchase the remaining equity interests, changes in the fair value of our co nti ngent liabilities, and changes in the fair value of the Company's Collar Agreement; 3 Other, net for the year ended December 31, 2022, relates to transaction costs incurred and changes in the fair value of our mandatory purchase of investmen ts and contingent considerations; 4 Other, net for the years ended December 31, 2021 and 2020 relate to COVID - 19 relief payments recognized in 2021 and 2020; 5 EBITDA margin is defined as EBITDA divided by net revenues. Adjusted EBITDA margin is defined as adjusted EBITDA divided by n et revenues; 6 Certain APC minority interests where APC owns the asset but not the right to the dividends is reclassified from APC excluded asset costs to income from equity method investmen ts Trailing Twelve Months Ended $ in millions 09/30/2023 2022 2021 2020 2019 Net Income $ 57.1 $ 45.7 $ 46.1 $ 122.1 $ 15.8 Interest expense 13.3 7.9 5.4 9.5 4.7 Interest income (10.9) (2.0) (1.6) (2.8) (2.0) Provision for income taxes 42.3 40.9 31.7 56.3 10.0 Depreciation and amortization 16.9 17.5 17.5 18.4 18.3 EBITDA 1 118.6 110.1 99.1 203.5 46.8 Goodwill impairment 0.0 0.0 0.0 0.0 2.0 Income from equity method investments (4.5) (5.7) 6 5.3 6 (0.3) 6 2.9 Gain on sale of equity method investment 0.0 0.0 (2.2) 0.0 0.0 Other, net 3.4 2 3.3 3 (1.7) 4 (0.5) 4 0.0 Stock - based compensation 19.0 16.1 6.7 3.4 0.9 APC excluded assets costs 4.7 16.2 6 26.4 6 (103.3) 6 1.5 Adjusted EBITDA 1 $ 141.2 $ 140.0 $ 133.5 $ 102.8 $ 54.2 Net Revenue $ 1,327.8 $ 1,144.2 $ 773.9 $ 687.2 $ 560.6 EBITDA Margin 5 9% 10% 13% 30% 8% Adjusted EBITDA Margin 5 11% 12% 17% 15% 10%

36 Reconciliation of Net Income to EBITDA – Community Family Care 1 Other is comprised of realized and unrealized gains and losses from investments Year Ended December 31, $ in millions 2019 2023E Net income $ 7.8 $ 25.6 Income taxes 0.1 0.3 Depreciation and amortization 0.0 0.0 Interest expense (income) (0.3) (1.1) Other 1 (0.1) 0.0 EBITDA 7.5 24.8

37 Guidance Reconciliation of Net Income to EBITDA and Adjusted EBITDA Note: See “Use of Non - GAAP Financial Measures” slide for more information. 2023 Guidance range (as of November 7, 2023) 2023 Guidance range (as of February 23, 2023) $ in 000s Low High Low High Net income $ 59,500 $ 71,500 $ 49,500 $ 71,500 Interest expense 1,500 1,500 1,000 1,000 Provision for income taxes 36,500 39,500 23,000 38,000 Depreciation and amortization 17,000 17,000 16,000 19,000 EBITDA 114,500 129,500 89,500 129,500 Loss (income) from equity method investments (4,500) (4,500) (750) (750) Other, net 1,000 1,000 3,250 3,250 Stock - based compensation 20,000 20,000 16,000 16,000 APC excluded assets costs 4,000 4,000 12,000 12,000 Adjusted EBITDA $ 135,000 $ 150,000 $ 120,000 $ 160,000

38 Summary of Selected Financial Results – Breaking Out Excluded Assets Nine Months Ended September 30, 2023 Nine Months Ended September 30, 2022 $ in millions ApolloMed Consolidated Excluded Assets ApolloMed Assets ApolloMed Consolidated Excluded Assets ApolloMed Assets Revenue Capitation, net $ 906.4 - 906.4 $ 677.3 - 677.3 Risk pool settlements and incentives 48.6 - 48.6 101.7 - 101.7 Management fee income 32.3 - 32.3 30.5 - 30.5 Fee - for - services, net 41.2 - 41.2 35.7 - 35.7 Other income 5.1 - 5.1 4.8 - 4.8 Total revenue 1,033.6 - 1,033.6 850.0 - 850.0 Total operating expenses 945.1 3.3 941.8 758.3 2.9 755.4 Income (losses) per operations 88.5 (3.3) 91.8 91.7 (2.9) 94.6 Total Other income (expense) 0.4 (1.7) 2.1 (15.5) (13.1) (2.4) Net income (loss) $ 57.9 (5) 62.9 $ 46.6 (16.0) 62.6

September 30, 2023 December 31, 2022 $ in millions ApolloMed Consolidated Excluded Assets ApolloMed Assets ApolloMed Consolidated Excluded Assets 1 ApolloMed Assets Current assets Cash and cash equivalents $ 273.9 11.6 262.3 $ 288.0 30.2 257.8 Investments in marketable securities 3.0 0.5 2.5 5.6 4.5 1.1 Receivables, net 95.9 0 95.9 49.6 - 49.6 Receivables - related parties and loan receivable - related party 86.9 0 86.9 67.2 - 67.2 Other receivables, prepaid expenses and other current assets 16.5 1.5 15 17.6 0.8 16.8 Income taxes receivable - - - - (1.1) 1.1 Total current assets 476.2 13.6 462.6 428.0 34.4 393.6 Non - current assets Land, property, and equipment, net 128.6 120.4 8.2 108.5 101.3 7.2 Goodwill and intangibles 349.7 - 349.7 346.0 - 346.0 Loan receivable and loan receivable - related parties, net of current portion 25.0 - 25.0 - - - Income taxes receivable, non - current 15.9 - 15.9 15.9 - 15.9 Investments in other entities and privately held entities 47.3 20.6 26.7 41.2 27.6 13.6 Other assets and right - of - use assets 30.4 5.2 25.2 26.5 3.2 23.3 Total non - current assets 596.9 146.2 450.7 538.1 132.1 406.0 Total assets $ 1,073.1 159.8 913.3 $ 966.1 166.5 799.6 39 Summary Balance Sheet – Breaking Out Excluded Assets 1 Includes AP Excluded Assets and certain other assets such as APC's minority interests in LSMA and PMIOC where APC owns the as se t but not the right to the dividends associated with those assets.

September 30, 2023 December 31, 2022 $ in millions ApolloMed Consolidated Excluded Assets ApolloMed Assets ApolloMed Consolidated Excluded Assets 1 ApolloMed Assets Current liabilities Fiduciary payable, accounts payable and accrued liabilities $ 59.4 2.3 57.1 $ 57.7 2.8 54.9 Medical liabilities 97.5 - 97.5 81.3 - 81.3 Income taxes payable 30.1 1.1 29 4.3 - 4.3 Dividend payable 0.6 - 0.6 0.7 - 0.7 Finance and operating lease liabilities 4.2 0.1 4.1 4.2 - 4.2 Current portion of long - term debt 3.0 1.0 2.0 0.6 - - Other liabilities - - - - - - Total current liabilities 194.8 4.5 190.3 148.8 3.4 145.4 Non - current liabilities Deferred tax liability $ 12.1 0.9 11.2 14.2 0.9 13.3 Finance and operating lease liabilities, net of current portion 22.2 0.9 21.3 21.2 - 21.2 Long - term debt, net of current portion and deferred financing costs 206.2 28.8 177.4 20.3 - 20.3 Other long - term liabilities 14.1 - 14.1 203.4 26.6 176.8 Total non - current liabilities 254.6 30.6 224.0 259.1 27.5 231.6 Total liabilities 449.4 35.1 414.3 407.9 30.9 377.0 Total mezzanine equity and stockholder's equity $ 623.7 124.7 499.0 $ 558.2 135.6 422.6 40 Summary Balance Sheet – Breaking Out Excluded Assets (continued) 1 Includes AP Excluded Assets and certain other assets such as APC's minority interests in LSMA and PMIOC where APC owns the as se t but not the right to the dividends associated with those assets.

September 30, 2023 September 30, 2022 $ in millions ApolloMed Consolidated Excluded Assets ApolloMed Assets ApolloMed Consolidated Excluded Assets ApolloMed Assets Cash flows from operating activities Net income $ 57.9 (5.0) 63 $ 46.6 (16.0) 62.6 Adjustments to reconcile net income to net cash provided by operating activities: Depreciation and amortization $ 12.8 1.3 11.5 $ 13.5 0.9 12.6 Amortization of debt issuance cost 0.7 - 0.7 0.7 - 0.7 Share - based compensation 13.4 - 13.4 10.5 - 10.5 Unrealized loss on investments 6.9 4.0 2.9 21.9 - 5.2 Gain on sales of equity securities - - - (2.3) - (2.3) Loss (income) from equity method investments, net (3.1) 0.1 (3.2) (4.4) - (4.4) Unrealized gain in interest rate swaps (1.0) (1.0) - (4.3) (4.3) - Deferred tax (3.9) - (3.9) (3.1) - (3.1) Other - - - 0.9 0.9 - Changes in operating assets and liabilities, net of acquisition amounts: Receivables, net, receivable, net - related parties, other receivable, prepaid expenses and other current assets, right of use assets, other assets, fiduciary accounts payable, medical liabilities, operating lease liabilities, other long - term liabilities (58.8) (0.8) (58.2) (73.3) 0.6 (73.9) Accounts payable and accrued liabilities (1.1) (1.8) 0.6 0.8 0.4 0.4 Income taxes payable 25.2 - 25.2 (10.4) - (10.4) Net cash provided by operating activities $ 49.0 (3.2) 52 $ (2.9) (0.8) (2.1) 41 Summary Cash Flow Statement – Breaking Out Excluded Assets

September 30, 2023 September 30, 2022 $ in millions ApolloMed Consolidated Excluded Assets ApolloMed Assets ApolloMed Consolidated Excluded Assets ApolloMed Assets Cash flows from investing activities Payments for business and asset acquisitions, net of cash acquired $ (4.7) - (4.7) $ (5.6) (4.8) (0.8) Proceeds from repayment of loans receivable - related parties 2.2 - 2.2 4.1 4 0.1 Purchase of marketable securities (2.1) - (2.1) (1.8) - (1.8) Purchase of investments - privately held (2.0) - (2.0) - - - Purchase of investments - equity method (0.3) - (0.3) - - - Purchases of property and equipment (21.5) (19.1) (2.4) (22.1) (20.7) (1.4) Proceeds of marketable securities - - - - (0.1) 0.1 Purchase of loan receivable (25) - (25) - - - Proceeds from sale of marketable securities - - - 6.4 - 6.4 Distribution from investments - equity method - - - 0.4 0.4 - Contribution to investment - equity method (0.7) (0.7) - (1.8) (1.8) - Net cash provided by (used in) investing activities (54.1) (19.8) (34.3) (20.4) (23.0) 2.6 Cash flows from financing activities Dividends paid $ (2.3) - (2.3) $ (12.7) (10.0) (2.7) Repayments on long - term debt (0.5) (0.5) - (3.7) (3.7) - Payment of finance lease obligations (0.5) - (0.5) (0.4) - (0.4) Proceeds from exercise of stock options and warrants 1.3 - 1.3 2.8 - 2.8 Repurchase of treasury shares - - - (9.6) - (9.6) Purchase of Non - Controlling Interest (9.7) - (9.7) (4.3) (4.1) (0.2) Proceeds from sale of non - controlling interest (0.1) - (0.1) 0.1 - 0.1 Borrowings on loan 3.1 2.9 0.2 2.0 2.0 - Amounts due from affiliate - 0.7 - - (15.5) 15.5 Net cash provided by (used in) financing activities (8.7) 3.1 (11.1) (25.8) (31.3) 5.5 Net change in cash and cash equivalents (13.7) (19.7) 6.0 (49.1) (55.1) 6.0 Cash and cash equivalents at beginning of year $ 288 30.2 257.9 $ 233.1 62.5 170.6 Cash and cash equivalents at end of year $ 274.3 10.5 263.9 $ 184.0 7.4 176.6 42 Summary Cash Flow Statement – Breaking Out Excluded Assets (continued)
v3.23.4
| X |
- DefinitionBoolean flag that is true when the XBRL content amends previously-filed or accepted submission.
| Name: |
dei_AmendmentFlag |
| Namespace Prefix: |
dei_ |
| Data Type: |
xbrli:booleanItemType |
| Balance Type: |
na |
| Period Type: |
duration |
|
| X |
- DefinitionFor the EDGAR submission types of Form 8-K: the date of the report, the date of the earliest event reported; for the EDGAR submission types of Form N-1A: the filing date; for all other submission types: the end of the reporting or transition period. The format of the date is YYYY-MM-DD.
| Name: |
dei_DocumentPeriodEndDate |
| Namespace Prefix: |
dei_ |
| Data Type: |
xbrli:dateItemType |
| Balance Type: |
na |
| Period Type: |
duration |
|
| X |
- DefinitionThe type of document being provided (such as 10-K, 10-Q, 485BPOS, etc). The document type is limited to the same value as the supporting SEC submission type, or the word 'Other'.
| Name: |
dei_DocumentType |
| Namespace Prefix: |
dei_ |
| Data Type: |
dei:submissionTypeItemType |
| Balance Type: |
na |
| Period Type: |
duration |
|
| X |
- DefinitionAddress Line 1 such as Attn, Building Name, Street Name
| Name: |
dei_EntityAddressAddressLine1 |
| Namespace Prefix: |
dei_ |
| Data Type: |
xbrli:normalizedStringItemType |
| Balance Type: |
na |
| Period Type: |
duration |
|
| X |
- DefinitionAddress Line 2 such as Street or Suite number
| Name: |
dei_EntityAddressAddressLine2 |
| Namespace Prefix: |
dei_ |
| Data Type: |
xbrli:normalizedStringItemType |
| Balance Type: |
na |
| Period Type: |
duration |
|
| X |
- Definition
+ References
+ Details
| Name: |
dei_EntityAddressCityOrTown |
| Namespace Prefix: |
dei_ |
| Data Type: |
xbrli:normalizedStringItemType |
| Balance Type: |
na |
| Period Type: |
duration |
|
| X |
- DefinitionCode for the postal or zip code
| Name: |
dei_EntityAddressPostalZipCode |
| Namespace Prefix: |
dei_ |
| Data Type: |
xbrli:normalizedStringItemType |
| Balance Type: |
na |
| Period Type: |
duration |
|
| X |
- DefinitionName of the state or province.
| Name: |
dei_EntityAddressStateOrProvince |
| Namespace Prefix: |
dei_ |
| Data Type: |
dei:stateOrProvinceItemType |
| Balance Type: |
na |
| Period Type: |
duration |
|
| X |
- DefinitionA unique 10-digit SEC-issued value to identify entities that have filed disclosures with the SEC. It is commonly abbreviated as CIK. Reference 1: http://www.xbrl.org/2003/role/presentationRef
-Publisher SEC
-Name Exchange Act
-Number 240
-Section 12
-Subsection b-2
| Name: |
dei_EntityCentralIndexKey |
| Namespace Prefix: |
dei_ |
| Data Type: |
dei:centralIndexKeyItemType |
| Balance Type: |
na |
| Period Type: |
duration |
|
| X |
- DefinitionIndicate if registrant meets the emerging growth company criteria. Reference 1: http://www.xbrl.org/2003/role/presentationRef
-Publisher SEC
-Name Exchange Act
-Number 240
-Section 12
-Subsection b-2
| Name: |
dei_EntityEmergingGrowthCompany |
| Namespace Prefix: |
dei_ |
| Data Type: |
xbrli:booleanItemType |
| Balance Type: |
na |
| Period Type: |
duration |
|
| X |
- DefinitionCommission file number. The field allows up to 17 characters. The prefix may contain 1-3 digits, the sequence number may contain 1-8 digits, the optional suffix may contain 1-4 characters, and the fields are separated with a hyphen.
| Name: |
dei_EntityFileNumber |
| Namespace Prefix: |
dei_ |
| Data Type: |
dei:fileNumberItemType |
| Balance Type: |
na |
| Period Type: |
duration |
|
| X |
- DefinitionTwo-character EDGAR code representing the state or country of incorporation.
| Name: |
dei_EntityIncorporationStateCountryCode |
| Namespace Prefix: |
dei_ |
| Data Type: |
dei:edgarStateCountryItemType |
| Balance Type: |
na |
| Period Type: |
duration |
|
| X |
- DefinitionThe exact name of the entity filing the report as specified in its charter, which is required by forms filed with the SEC. Reference 1: http://www.xbrl.org/2003/role/presentationRef
-Publisher SEC
-Name Exchange Act
-Number 240
-Section 12
-Subsection b-2
| Name: |
dei_EntityRegistrantName |
| Namespace Prefix: |
dei_ |
| Data Type: |
xbrli:normalizedStringItemType |
| Balance Type: |
na |
| Period Type: |
duration |
|
| X |
- DefinitionThe Tax Identification Number (TIN), also known as an Employer Identification Number (EIN), is a unique 9-digit value assigned by the IRS. Reference 1: http://www.xbrl.org/2003/role/presentationRef
-Publisher SEC
-Name Exchange Act
-Number 240
-Section 12
-Subsection b-2
| Name: |
dei_EntityTaxIdentificationNumber |
| Namespace Prefix: |
dei_ |
| Data Type: |
dei:employerIdItemType |
| Balance Type: |
na |
| Period Type: |
duration |
|
| X |
- DefinitionLocal phone number for entity.
| Name: |
dei_LocalPhoneNumber |
| Namespace Prefix: |
dei_ |
| Data Type: |
xbrli:normalizedStringItemType |
| Balance Type: |
na |
| Period Type: |
duration |
|
| X |
- DefinitionBoolean flag that is true when the Form 8-K filing is intended to satisfy the filing obligation of the registrant as pre-commencement communications pursuant to Rule 13e-4(c) under the Exchange Act. Reference 1: http://www.xbrl.org/2003/role/presentationRef
-Publisher SEC
-Name Exchange Act
-Number 240
-Section 13e
-Subsection 4c
| Name: |
dei_PreCommencementIssuerTenderOffer |
| Namespace Prefix: |
dei_ |
| Data Type: |
xbrli:booleanItemType |
| Balance Type: |
na |
| Period Type: |
duration |
|
| X |
- DefinitionBoolean flag that is true when the Form 8-K filing is intended to satisfy the filing obligation of the registrant as pre-commencement communications pursuant to Rule 14d-2(b) under the Exchange Act. Reference 1: http://www.xbrl.org/2003/role/presentationRef
-Publisher SEC
-Name Exchange Act
-Number 240
-Section 14d
-Subsection 2b
| Name: |
dei_PreCommencementTenderOffer |
| Namespace Prefix: |
dei_ |
| Data Type: |
xbrli:booleanItemType |
| Balance Type: |
na |
| Period Type: |
duration |
|
| X |
- DefinitionTitle of a 12(b) registered security. Reference 1: http://www.xbrl.org/2003/role/presentationRef
-Publisher SEC
-Name Exchange Act
-Number 240
-Section 12
-Subsection b
| Name: |
dei_Security12bTitle |
| Namespace Prefix: |
dei_ |
| Data Type: |
dei:securityTitleItemType |
| Balance Type: |
na |
| Period Type: |
duration |
|
| X |
- DefinitionName of the Exchange on which a security is registered. Reference 1: http://www.xbrl.org/2003/role/presentationRef
-Publisher SEC
-Name Exchange Act
-Number 240
-Section 12
-Subsection d1-1
| Name: |
dei_SecurityExchangeName |
| Namespace Prefix: |
dei_ |
| Data Type: |
dei:edgarExchangeCodeItemType |
| Balance Type: |
na |
| Period Type: |
duration |
|
| X |
- DefinitionBoolean flag that is true when the Form 8-K filing is intended to satisfy the filing obligation of the registrant as soliciting material pursuant to Rule 14a-12 under the Exchange Act. Reference 1: http://www.xbrl.org/2003/role/presentationRef
-Publisher SEC
-Name Exchange Act
-Section 14a
-Number 240
-Subsection 12
| Name: |
dei_SolicitingMaterial |
| Namespace Prefix: |
dei_ |
| Data Type: |
xbrli:booleanItemType |
| Balance Type: |
na |
| Period Type: |
duration |
|
| X |
- DefinitionTrading symbol of an instrument as listed on an exchange.
| Name: |
dei_TradingSymbol |
| Namespace Prefix: |
dei_ |
| Data Type: |
dei:tradingSymbolItemType |
| Balance Type: |
na |
| Period Type: |
duration |
|
| X |
- DefinitionBoolean flag that is true when the Form 8-K filing is intended to satisfy the filing obligation of the registrant as written communications pursuant to Rule 425 under the Securities Act. Reference 1: http://www.xbrl.org/2003/role/presentationRef
-Publisher SEC
-Name Securities Act
-Number 230
-Section 425
| Name: |
dei_WrittenCommunications |
| Namespace Prefix: |
dei_ |
| Data Type: |
xbrli:booleanItemType |
| Balance Type: |
na |
| Period Type: |
duration |
|
Apollo Medical (NASDAQ:AMEH)
Historical Stock Chart
From Apr 2024 to May 2024

Apollo Medical (NASDAQ:AMEH)
Historical Stock Chart
From May 2023 to May 2024
