0001413837false00014138372023-07-272023-07-27

UNITED STATES

SECURITIES AND EXCHANGE COMMISSION

Washington, D.C. 20549

FORM 8-K

CURRENT REPORT

Pursuant to Section 13 or 15(d) of the

Securities Exchange Act of 1934

Date of Report (Date of earliest event reported): July 27, 2023

FIRST FOUNDATION INC.

(Exact name of registrant as specified in its charter)

Delaware

001-36461

20-8639702

(State or other jurisdiction

of incorporation)

(Commission

File Number)

(IRS Employer

Identification Number)

200 Crescent Court, Suite 1400

Dallas, Texas

75201

(Address of Principal Executive Offices)

(Zip Code)

(469638-9636

(Registrant’s Telephone Number, Including Area Code)

N/A

(Former name or former address, if changed since last report.)

Check the appropriate box below if the Form 8-K filing is intended to simultaneously satisfy the filing obligation of the registrant under any of the following provisions:

Written communications pursuant to Rule 425 under the Securities Act (17 CFR 230.425)

Soliciting material pursuant to Rule 14a-12 under the Exchange Act (17 CFR 240.14a-12)

Pre-commencement communications pursuant to Rule 14d-2(b) under the Exchange Act (17 CFR 240.14d-2(b))

Pre-commencement communications pursuant to Rule 13e-4(c) under the Exchange Act (17 CFR 240.13e-4(c))

Securities registered pursuant to Section 12(b) of the Act:

Title of each class

Trading Symbol(s)

Name of each exchange on which registered

Common Stock

FFWM

NASDAQ Global Market

Indicate by check mark whether the registrant is an emerging growth company as defined in Rule 405 of the Securities Act of 1933 (§230.405 of this chapter) or Rule 12b-2 of the Securities Exchange Act of 1934 (§240.12b-2 of this chapter).

Emerging growth company

If an emerging growth company, indicate by check mark if the registrant has elected not to use the extended transition period for complying with any new or revised financial accounting standards provided pursuant to Section 13(a) of the Exchange Act.

Item 7.01 Regulation FD Disclosure

A copy of a slide presentation that First Foundation Inc. (the “Company”) may use for upcoming meetings with investors and other interested parties is attached to this Current Report on Form 8-K as Exhibit 99.1 and is incorporated by reference herein. Additionally, the Company has posted the slide presentation in the Investor Relations section of its website at http://investor.ff-inc.com/.  Information obtained or linked to the foregoing website shall not be deemed to be included in this Current Report on Form 8-K. The furnishing of the attached presentation is not an admission as to the materiality of any information therein. The information contained in the slides is summary information that is intended to be considered in the context of more complete information included in the Company’s filings with the U.S. Securities and Exchange Commission (the “SEC”) and other public announcements that the Company has made and may make from time to time by press release or otherwise. The Company undertakes no duty or obligation to update or revise the information contained in this Current Report on Form 8-K except to the extent required by applicable law, although the Company may do so from time to time as its management believes is appropriate. Any such updating may be made through the filing of other reports or documents with the SEC, through press releases or through other public disclosures. For important information about forward looking statements, see the slide titled “Safe Harbor Statement” in Exhibit 99.1 attached hereto.

The information in this Current Report on Form 8-K, including Exhibit 99.1 attached hereto, shall not be deemed “filed” for purposes of Section 18 of the Securities Exchange Act of 1934, as amended, or otherwise subject to the liabilities of that section or Sections 11 and 12(a)(2) of the Securities Act of 1933, as amended. The information contained in this Item 7.01 and in the presentation attached as Exhibit 99.1 to this Current Report shall not be incorporated by reference into any filing with the SEC made by the Company, whether made before or after the date hereof, regardless of any general incorporation language in such filing.

Item 9.01

Financial Statements and Exhibits

Exhibit No.


Description


99.1


Company Slide Presentation – July 2023


104


Cover Page Interactive Data File (embedded within the Inline XBRL document)

SIGNATURES

Pursuant to the requirements of the Securities Exchange Act of 1934, the registrant has duly caused this report to be signed on its behalf by the undersigned hereunto duly authorized.

Uly


FIRST FOUNDATION INC.

Date: July 27, 2023

By:

/s/ AMY DJOU

Amy Djou

Executive Vice President and Chief Financial Officer

Exhibit 99.1

GRAPHIC

PRIVATE WEALTH MANAGEMENT ● PERSONAL BANKING ● BUSINESS BANKING July 2023 INVESTOR PRESENTATION

GRAPHIC

Copyright © 2023 First Foundation Inc. All Rights Reserved This report includes forward-looking statements within the meaning of the “Safe-Harbor” provisions of the Private Securities Litigation Reform Act of 1995, including forward-looking statements regarding our expectations and beliefs about our future financial performance and financial condition, as well as trends in our business and markets. Forward-looking statements often include words such as "believe," "expect," "anticipate," "intend," "plan," "estimate," "project," "outlook," or words of similar meaning, or future or conditional verbs such as "will," "would," "should," "could," or "may." The forward-looking statements in this report are based on current information and on assumptions that we make about future events and circumstances that are subject to a number of risks and uncertainties that are often difficult to predict and beyond our control. As a result of those risks and uncertainties, our actual financial results in the future could differ, possibly materially, from those expressed in or implied by the forward-looking statements contained in this report and could cause us to make changes to our future plans. Those risks and uncertainties include, but are not limited to, the risk of incurring credit losses, which is an inherent risk of the banking business; the quality and quantity of our deposits; adverse developments in the financial services industry generally such as the recent bank failures and any related impact on depositor behavior or investor sentiment; risks related to the sufficiency of liquidity; the negative impacts and disruptions resulting from the COVID-19 pandemic on our colleagues, clients, the communities we serve and the domestic and global economy, which may have an adverse effect on our business, financial position and results of operations; the risk that we will not be able to continue our internal growth rate; the performance of loans currently on deferral following the expiration of the respective deferral periods; the risk that we will not be able to access the securitization market on favorable terms or at all; changes in general economic conditions, either nationally or locally in the areas in which we conduct or will conduct our business; risks associated with changes in interest rates, which could adversely affect our interest income, interest rate margins, and the value of our interest-earning assets, and therefore our future operating results; the risk that the performance of our investment management business or of the equity and bond markets could lead clients to move their funds from or close their investment accounts with us, which would reduce our assets under management and adversely affect our operating results; negative impacts of news or analyst reports about us or the financial services industry; risks associated with proxy contests and other actions of activist stockholders, which may cause us to incur significant expense, cause disruption to our business and impact our stock price; the risk that we may be unable or that our board of directors may determine that it is inadvisable to pay future dividends at historic levels or at all; risks associated with changes in income tax laws and regulations; and risks associated with seeking new client relationships and maintaining existing client relationships. Additional information regarding these and other risks and uncertainties to which our business and future financial performance are subject is contained in our Annual Report on Form 10-K for the fiscal year ended December 31, 2022, as amended, and other documents we file with the SEC from time to time. We urge readers of this report to review those reports and other documents we file with the SEC from time to time. Also, our actual financial results in the future may differ from those currently expected due to additional risks and uncertainties of which we are not currently aware or which we do not currently view as, but in the future may become, material to our business or operating results. Due to these and other possible uncertainties and risks, readers are cautioned not to place undue reliance on the forward-looking statements contained in this report, which speak only as of today's date, or to make predictions based solely on historical financial performance. We also disclaim any obligation to update forward-looking statements contained in this report or in the above-referenced reports, whether as a result of new information, future events or otherwise, except as may be required by law or NASDAQ rules. Non-GAAP Financial Measures This presentation contains both financial measures based on GAAP and non-GAAP based financial measures, which are used when management believes them to be helpful in understanding the Company’s results of operations or financial position. Where non-GAAP financial measures are used, the comparable GAAP financial measure, as well as the reconciliation to the comparable GAAP financial measure, can be found in the appendix of this presentation as of and for the quarter ended June 30, 2023. These disclosures should not be viewed as a substitute for operating results determined in accordance with GAAP, nor are they necessarily comparable to non-GAAP performance measures that may be presented by other companies. Safe Harbor Statement 1

GRAPHIC

Copyright © 2023 First Foundation Inc. All Rights Reserved A Multi-Diversified Regional Financial Services Company with a Personal Touch $5.3 Billion in Assets Under Management $12.8 Billion in Bank Assets COMPANY TRUST SERVICES PERSONAL BANKING PRIVATE BANKING BUSINESS BANKING PRIVATE WEALTH MANAGEMENT Data as of June 30, 2023. Five States: CA, TX, NV, HI, and FL 588 Employees, 31 Branch/Office Locations CORE BUSINESS TARGET CLIENTS BUSINESS OWNERS REAL ESTATE INVESTORS SMALL AND MEDIUM BUSINESSES HOAs, MSRs, 1031 EXCHANGES, TITLE AND ESCROW COMPANIES LOCAL MUNICIPALITIES HIGH NET WORTH INDIVIDUALS MULTI-GENERATIONAL FAMILIES CORPORATE EXECUTIVES NONPROFITS Focus on providing exceptional service Complementary services $1.2 Billion in Trust Assets Under Advisement Scale with a proven business model 2 NASDAQ: FFWM

GRAPHIC

Copyright © 2023 First Foundation Inc. All Rights Reserved 3 2023 Banking Environment  Fed has raised interest rates 525bps since January 2022, creating significant NIM compression for all banks.  Total deposits at Q2’23 were $10.81 billion, up $755 million from prior quarter.  Deposit inflows and outflows normalized in Q2’23. Fed interest rate actions culminated, causing unprecedented challenges throughout the industry during the quarter.

GRAPHIC

Copyright © 2023 First Foundation Inc. All Rights Reserved $8,544 85% $1,508 15% March 31, 2023 Insured and Collateralized Deposits Uninsured and Uncollateralized Deposits $10,052 Total Deposits $9,494, 88% $1,313, 12% June 30, 2023 $10,807 Total Deposits 4 Deposits  As of June 30, 2023, insured and collateralized deposits represent approximately 88% of total deposits, including accounts eligible for pass-through insurance.  This figure improved from the previously reported 85% of total deposits as of March 31, 2023. Insured and Collateralized vs. Uninsured Deposit Mix ($ in thousands)

GRAPHIC

Copyright © 2023 First Foundation Inc. All Rights Reserved 95% 93% 81% 78% 104% 106% 98% 0% 20% 40% 60% 80% 100% 120% YE 2018 YE 2019 YE 2020 YE 2021 YE 2022 Q1'23 Q2'23 Loan / Deposit Ratio Loan/ Deposit Ratio Average 5 Deposits  Loan to deposit ratio negatively impacted in Q1’23 due to dislocation in the banking industry mid-March 2023.  Loan to deposit ratio of 98% as of June 30, 2023.  Loan to deposit ratio of 93% as of July 20, 2023.  Deposit levels hit low point during Q1’23 and have risen $755 million since (as of June 30, 2023). Average 94% 2,737 2,666 2,721 2,263 2,660 2,569 2,668 2,743 2,364 2,281 2,158 2,202 2,238 1,949 1,947 1,020 1,050 1,074 1,049 1,150 1,879 2,016 2,271 2,306 2,769 10,363 10,602 11,047 10,052 10,807 0 2,000 4,000 6,000 8,000 10,000 12,000 Dec'22 Jan'23 Feb'23 Mar'23 Jun'23 Deposit by Type ($ in thousands) Non-interest Bearing Interest Bearing Money Market Savings CDs

GRAPHIC

Copyright © 2023 First Foundation Inc. All Rights Reserved 6 Strong Liquidity Position Due to the proactive steps taken before March 2023, First Foundation Bank continues to be in a strong liquidity position  Available cash and cash equivalents held on balance sheet: $926 million.  Fully collateralized credit from the Federal Home Loan Bank: $2.3 billion.  Federal Reserve discount window availability: $900 million.  Available uncommitted credit lines: $145 million.  Market value of unpledged securities of $156 million as of June 30, 2023. $4.4 billion on and off balance sheet liquidity

GRAPHIC

Copyright © 2023 First Foundation Inc. All Rights Reserved 7 Strong Regional Presence  Headquartered in Dallas, TX, FFWM has 31 branch / offices locations in five states: CA, TX, NV, HI, and FL  FFWM’s loan portfolio is primarily concentrated within the branch footprint; 71% of total loans in CA, 4% in TX, 1% in NV, and 10% in FL  Expansion focused on attractive markets with positive demographic trends and business friendly environments Located in Expanding and Affluent Markets  Average household income of $83k versus overall U.S. average of $74k(1)  ~2.0x the U.S. average branch deposit growth in our footprint over the past 5 years o 87% in our footprint versus 45% nationwide(2) Outsized population growth in markets with large market share(1)(3)  Riverside-San Bernardino-Ontario, CA: 3.7%  Sacramento-Roseville-Folsom, CA: 4.2%  Las Vegas-Henderson-Paradise, NV: 8.1% Exceptional historical and projected population growth in newly-entered markets(1)  Dallas-Fort Worth-Arlington, TX (Historical): 7.3%(3)  Dallas-Fort Worth-Arlington, TX (Projected): 5.9%( 4)  Naples-Marco Island, FL (Historical): 8.8%( 3)  Naples-Marco Island, FL (Projected): 5.7%( 4) Source: SNL Financial; Claritas LLC; FDIC branch reports from SNL Financial; Company Reports 1. As of May 2022. 2. As of latest FDIC branch report dated September 2022. 3. 5 year historical. 4. 5 year projected based on Company management estimates. Presence in Some of the Fastest Growing MSAs in the Country

GRAPHIC

Copyright © 2023 First Foundation Inc. All Rights Reserved Our Approach Within Attractive Markets Three-pronged approach to market entry and presence. 1. Grow presence in business friendly and expanding markets  Dallas-Fort Worth Metroplex, TX  Naples-Marco Island, FL 2. Maintain a strong presence in mature and affluent markets  West Los Angeles and Pasadena, CA  Palos Verdes and the South Bay, CA  Orange County, CA  San Diego, CA  Indian Wells and Palm Springs, CA  San Francisco, CA  Sacramento, CA  Las Vegas, NV  Honolulu, HI 3. Obtain market share in secondary and stable markets(1)  Lucerne Valley: 100%  Running Springs: 100%  Big Bear Lake: 28.3%  El Centro: 8.4%  Auburn: 3.1% Source: SNL Financial; Company Reports 1. As of latest FDIC branch report dated September 2022. Provide excellent customer service and deepen relationships Focus on deposits as the bank of choice in local region 8 Significant new opportunities for entire suite of services

GRAPHIC

Copyright © 2023 First Foundation Inc. All Rights Reserved Serving Clients Across Generations Educate + Protect BUILD “Millennials” Plan + Build GROW “Gen X” Consume + Distribute ENJOY “Boomers” Solutions for every stage in the financial journey Focused Consumer, Real Estate, and Commercial Lending  SBA & Small Business  Small Balance Business  Equipment Finance  Owner Occupied Real Estate  Multifamily  Investor Owned Real Estate Private Wealth Management  Wealth Planning & Advisory  Investment Management  Business Succession  Philanthropy Services  Corporate Trustee  Nevada Asset Protection Trust  Successor Trustee Personal and Business Banking  Checking and Savings Accounts  Money Market Accounts  Certificate of Deposits (CDs)  Digital Account Opening and Support  Mobile Banking  Full Suite of Treasury Management Offerings  Primary Single Family  Rental Single Family  Home Equity Lines of Credit  Personal Lines of Credit Solutions to serve both the boomer and the next generations. Expertise on multi-generational gifting strategies and setting up the next gen for financial success. 9 Well Positioned to Facilitate The Great Wealth Transfer 45 million U.S. households will pass a mind-boggling $68 trillion ($48 trillion from Boomers alone) to their children — the biggest generational wealth transfer ever.* *According to report by Cerulli Associates

GRAPHIC

Copyright © 2023 First Foundation Inc. All Rights Reserved Technology Driving Efficiencies and Enhancing Client Experience 10 Core Technology Tech Driving Process Efficiencies Client Experience Tech Enhancing the Client Experience Existing Strong Foundation ✓ Latest Fiserv Core Banking system: Precision ✓ Data warehouse / CRM – marketing and client data mining ✓ Deep integrations with loan origination systems and core ✓ AI automating workflows to drive efficiency ✓ Technology-enhanced compliance tracking ✓ Digital banking processes with open APIs ✓ Dedicated to the strictest security measures ✓ Peer-to-peer payments through Zelle® ✓ Digital signature capture for lending and deposit products ✓ Automated online deposit account opening and delivery ✓ Industry-leading commercial business banking online ✓ Automated account switching solution to move new customer direct deposits and bill pay to bank Recent Enhancements Made / Planned • Upgraded to Orion, state-of-the-art enterprise investment software platform for wealth management clients • Deep integration between trust accounting and portfolio management systems • New single family loan origination system • New commercial loan origination system upgrades • Account aggregation across institutions • New mobile and desktop consumer banking applications • New client portal for wealth management clients • Rewards deposit accounts • Financial wellness scoring Traditional Banking Services With the Same Features as a Fintech Nationally recognized for our investment to drive innovation Key Partners

GRAPHIC

Copyright © 2023 First Foundation Inc. All Rights Reserved Brand Awareness Using Digital Channels 11 1) SEMRush, as July 17, 2023; based on all internet traffic; does not include paid search; does however include all website traffic, not just those of banks and financial services companies. Focused on 50-60 key terms related to our business. Ranked consistently in Top 25 nationally for high-value search phrases. 1. AWARE-NESS Search Engine Optimization Building awareness without paid advertising by ranking highly for relevant search phrases on Google. 2. ENGAGE-MENT Social Media Presence on major social networks  Engaged community of followers  Affinity towards brand and culture 3. DELIVERY Content Marketing Valuable content sourced by in-house and third-party writers  Provides education; Fosters interest  Boosts SEO; Generates leads Key Content Topics Frequency Investment Commentary 4 / year Market Alerts 2–4 / year The Week Ahead 50 / year Wealth Planning 4–6 / year Cyber Security 4 / year Sample Search Phrases (note: rankings fluctuate daily) National Rank 1 “Multifamily lending” 1 “Apartment lending” 3 “Wealth planning services” 8 “What is personal banking” 11 “Life and wealth planning” 12 “Business banking” 15 “Wealth planning” 16 “Savings goal calculator” 29 “Income property lending” 31 “Owner occ. real estate financing” 40 “Online savings account” 55 “Online savings account rates” 56 Digital brand awareness significantly reduces the cost of new client acquisition

GRAPHIC

Copyright © 2023 First Foundation Inc. All Rights Reserved Loans 12

GRAPHIC

Copyright © 2023 First Foundation Inc. All Rights Reserved Multifamily , $5,267 , 50% Commercial Business(1) , $3,522 , 33% Single Family , $983 , 9% CRE Investment , $634 , 6% Land and Construction , $159 , 2% Consumer , $4 , 0% Other(2) , $17 , 0% Loan Portfolio by Asset Class 2Q23 ($ in millions) California $7,493 71% Florida $1,015 10% Texas, $409 , 4% Hawaii, $42 , 0% Nevada, $106 , 1% Other $1,520 14% Loan Portfolio by State 2Q23 ($ in millions) Loan Portfolio Overview $10,585 Total Loans 2Q23 Yield on Originations: 7.90% 2Q23 Yield on Loans: 4.69% 13 1) Commercial Business asset class includes C&I and Commercial Owner Occupied CRE Loans. 2) Other includes premiums, discounts and deferred fees and expenses on all loans. $10,585 Total Loans Diversification by asset class and geography/state

GRAPHIC

Copyright © 2023 First Foundation Inc. All Rights Reserved California, $799 , 81% Florida, $116 , 12% Texas, $2 , 0% Hawaii, $29 , 3% Nevada, $10 , 1% Other, $28 , 3% Single Family Loans 2Q23 ($ in millions) California, $4,611 , 87% Florida, $100 , 2% Texas, $226 , 4% Hawaii, $2 , 0% Nevada, $35 , 1% Other, $294 , 6% Multifamily Loans 2Q23 ($ in millions) California, $229 , 36% Florida, $370 , 58% Texas, $22 , 4% Hawaii, $1 , 0% Nevada, $3 , 1% Other, $9 , 1% NOO CRE Loans 2Q23 ($ in millions) California, $1,806 , 51% Florida, $320 , 9% Texas, $150 , 4% Hawaii, $10 , 0% Nevada, $58 , 2% Other, $1,178 , 34% Commercial Business Loans 2Q23 ($ in millions) Loan Portfolio by Geographic Distribution $5,267 Total Loans 14 $634 Total Loans $983 Total Loans $3,522 Total Loans  
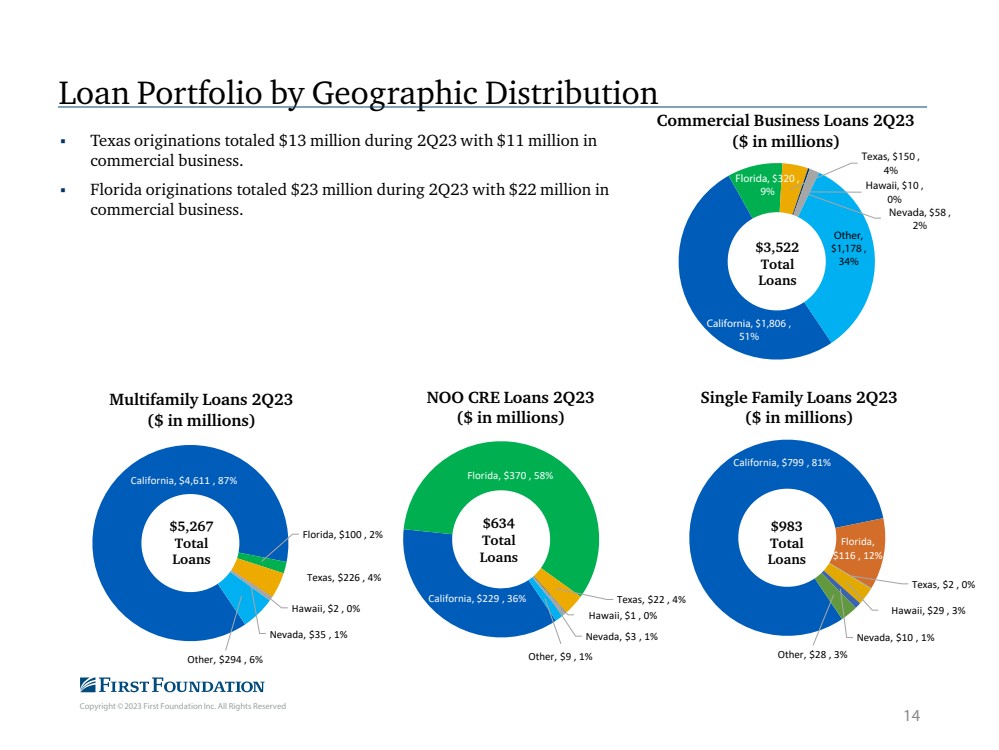
Texas originations totaled $13 million during 2Q23 with $11 million in commercial business.  Florida originations totaled $23 million during 2Q23 with $22 million in commercial business.

GRAPHIC

Copyright © 2023 First Foundation Inc. All Rights Reserved Net Loan Activity 15 4Q22 2Q23 1Q23 2Q23

GRAPHIC

Copyright © 2023 First Foundation Inc. All Rights Reserved 51% 90% 40% 3% 3% 4% 2% 2% 4% 0% 10% 20% 30% 40% 50% 60% 70% 80% 90% 100% 2Q22 YTD 2Q23 YTD Origination Composition Commercial Business Multifamily CRE Investment Single Family Other $0 $1,000 $2,000 $3,000 $4,000 $5,000 $6,000 2018 2019 2020 2021 2022 2Q22 YTD 2Q23 YTD Loan Origination Composition Trend ($ in millions) Commercial Business Multifamily CRE Investment Single Family  Commercial business originations in 2Q23 YTD of $863 million and $2.9 billion in 2022. Lending Activities Limited but Focused on High Quality Commercial Business 16 (1) 1) Includes $171 million in PPP loans. 2) Includes $56 million in PPP loans. (2)

GRAPHIC

Copyright © 2023 First Foundation Inc. All Rights Reserved CRE Own Occ 11% Commercial Term 16% Commercial Line of Credit 36% Equipment Finance 7% SBA 7A 0% SBA Own Occ CRE SBA PPP 1% 0% Municipal Financing 29% Commercial Portfolio by Facility Type 2Q23 Finance and Insurance 32% Public Administration 29% Real Estate and Rental and Leasing 7% Manufacturing 5% Construction 4% Wholesale Trade 3% Accommodation and Food Services 3% Admin, and Waste Management and Remediation Services 2% Other Services (except Public Administration) 2% Professional, Scientific, and Technical Services 2% Arts, Entertainment, and Recreation 2% Other(1) 9% Commercial Portfolio by Industry Sectors 2Q23 Diversified Commercial Business Portfolio No sector comprises more than a 1/3 of the portfolio. Low CRE exposure 1) No individual sector within “Other” category is larger than 1.9%. 17 88% of commercial business portfolio is not commercial real estate. $3,522 Total Loans $3,522 Total Loans

GRAPHIC

Copyright © 2023 First Foundation Inc. All Rights Reserved Conservative Portfolio of Residential Loans Multifamily Loan Characteristics(1) Average Loan Size $3.28 Million Average LTV(2) 54% Average DSCR(3) 1.42x % Delinquent 0.00% Single Family Real Estate Loan Characteristics(1) Average Loan Size(5) $678 Thousand Average LTV(2) 49% Median FICO(4) 764 % Delinquent 0.40% 1) Data as of June 30, 2023, unless otherwise noted. 2) Loan-to-Value (“LTV”) at time of origination. 3) Debt Service Coverage Ratio (“DSCR”) represents the actual fully amortizing DSCR based on the initial interest rate, loan amount and property’s Net Operating Income (“NOI”) at time of origination. 4) Median FICO based on the lowest median score of the borrowing entities associated with each loan at time of origination. FICO data at time of origination not available on ~6% of portfolio related to loans originated by acquired banks. 5) Excludes zero balance HELOCs.  High credit quality with consistently low LTVs for both multifamily and single family loans and strong DSCR ratios on multifamily loans.  Conservative underwriting to in-place rents and higher of market or actual vacancy and expenses.  No multifamily charge-offs since FFB’s creation in 2007.  Strong single family borrower characteristics with high FICO scores and larger loan balances. 18

GRAPHIC

Copyright © 2023 First Foundation Inc. All Rights Reserved Exposure by Top 10 Counties (000s) % Los Angeles (CA) 2,689,223 51.06% Orange (CA) 445,454 8.46% San Diego (CA) 387,675 7.36% San Francisco (CA) 253,691 4.82% Alameda (CA) 225,862 4.29% Santa Clara (CA) 155,534 2.95% Maricopa (AZ) 146,167 2.78% Sacramento (CA) 104,459 1.98% Bexar (TX) 96,974 1.84% San Mateo (CA) 80,555 1.53% Top 10 Counties Total 4,585,593 87.1% Portfolio Total 5,267,047 100.0% Our Multifamily Expertise 19 The Bank has been originating multifamily loans since 2008 with zero losses to date on its portfolio. Product Overview – Essential Housing Focus  Primary focus is on small balance (average size of $3.3 million) loans on non-luxury Essential Housingapartment stock  Average property has 22 units  Buildings tend to be older and smaller in size with over 60% of properties built between 1950-1980catering towards at or below median income earners  Approx. 68% of the $2.4B originations in 2022 were rent controlledand on average 14% below market, providing potential upside in rents if units turn over  Loans are generally fixed for 3-,5-,7- and 10- year periods  Weighted average life of portfolio is 5(1) years  30-year maturity with 30-year amortization Conservative Underwriting  Conservative underwriting to the lower of in-place rents or market and the higher of market or actual vacancy and expenses  No credit is given for future or pro forma figures for rents  Loan amounts are underwritten to DSCRs using a qualifying rate that is higher than the initial rate for 3- and 5- year fixed loans  7 and 10 year fixed are underwritten to the initial start rate  Interest only options for lower LTV and higher DSCR properties with strong sponsorship  All IO loans underwritten to a fully amortizing DSCR  Sponsors are required to meet minimum liquidity requirements of 6-12 months principal, interest, taxes and insurance, and a minimum of 10% of the loan amount 1) WA Life per Moody’s Analytics CMM/Impairment Studio reporting as of 06.30.2023 Geographic Exposure California, $4,611 , 87% Florida, $100 , 2% Texas, $226 , 4% Hawaii, $2 , 0% Nevada, $35 , 1% Other, $294 , 6% Multifamily Loans 2Q23 ($ in millions) Vast majority of the portfolio is in rent controlled markets within California $5,267 Total Loans

GRAPHIC

Copyright © 2023 First Foundation Inc. All Rights Reserved 0.00% 0.50% 1.00% 1.50% 2.00% 2.50% 3.00% 2009 2010 2011 2012 2013 2014 2015 2016 2017 2018 2019 2020 2021 2022 Charge offs by Loan Type for CA-Based Banks Single Family Multifamily NOO CRE Commercial and Industrial Industry Trends: Top Performing Asset Class Multifamily loans have historically been the best performing of all real estate loan types Source: SNL Data; FDIC Call Report Note: Charge off rate weighted the loan balance of each bank’s associated asset class. Only includes California headquartered commercial and savings banks. 20 Average Charge off Rate (2009 - 12.31.22) Multifamily 0.19% Single Family 0.23% NOO CRE 0.30% Commercial and Industrial 0.70%

GRAPHIC

Copyright © 2023 First Foundation Inc. All Rights Reserved 0.21% 0.20% 0.30% 0.14% 0.13% 0.12% 0.24% 0.25% 0.39% 0.11% 0.10% 0.09% 0.55% 0.47% 0.55% 0.40% 0.32% 0.33% 0.00% 0.10% 0.20% 0.30% 0.40% 0.50% 0.60% 0.70% 0.80% 0.90% 1.00% YE 2018 YE 2019 YE 2020 YE 2021 YE 2022 2Q23 Non-Performing Loans and Assets FFB NPAs/Assets FFB NPLs/Loans Peer NPLs/Loans(1)(2) 1) UPBR peer group includes commercial banks with assets between $3 billion and $10 billion for data through 3Q21. Starting in 4Q21 peer group includes commercial banks with assets between $10 and $100 billion. 2) Ratio defined as Total loans and leases on nonaccrual status divided by total loans and leases. 3) Ratio defined as loan and lease charge-off, net of recoveries divided by average total loans and leases. 4) Peer group data based on the most recently available UBPR report of 1Q23. Strong Credit Quality 21 (4) (4) FFB NCO Average, 0.03% Peer NCO Average, 0.09% -0.01% 0.09% 0.19% 0.29% 2018 2019 2020 2021 2022 2Q23 Net Charge-offs (NCOs)/Average Loans FFB NCOs/Average Loans Peer NCOs/Average Loans(1)(3) FFB NCO Average Peer NCO Average Peer Average 3.7x FFB

GRAPHIC

Copyright © 2023 First Foundation Inc. All Rights Reserved Deposits 22

GRAPHIC

Copyright © 2023 First Foundation Inc. All Rights Reserved $2,660 25% $2,281 21% $3,096 29% $2,769 26% Noninterest-Bearing Demand Interest-Bearing Demand Money Market & Savings Certificates of Deposits Deposits by Type 2Q23 ($ in millions) Profile of Deposits 2Q23 Cost of Deposits: 2.85% $10,807 Total Deposits 23 Insured and Collateralized Deposits 88%, Uninsured and Uncollateralized Deposits 12% as of 2Q23 Noninterest-bearing deposits make up 25% of deposit base $2,285 $2,808 $5,318 $4,146 $3,915 $550 $414 $789 $913 $1,251 $2,230 $2,989 $4,047 $3,775 $1,208 $326 $90 $1,381 $2,204 $4,891 $5,913 $8,812 $10,363 $10,807 $0 $2,000 $4,000 $6,000 $8,000 $10,000 $12,000 YE 2019 YE 2020 YE 2021 YE 2022 2Q23 Deposits by Channel 2Q23 ($ in millions) Branch Digital Commercial Services Brokered 24.7% 5.5% 1.0% 13.3% 20.4% Brokered Deposits as a % of Total Deposits

GRAPHIC

Copyright © 2023 First Foundation Inc. All Rights Reserved California, $1,307 , 49% Florida, $294 , 11% Texas, $858 , 32% Hawaii, $14 , 1% Nevada, $13 , Other, 0% $174 , 7% Noninterest-Bearing Deposits 2Q23 ($ in millions) California, $2,623 , 32% Florida, $1,756 , 22% Texas, $151 , 2% Hawaii, $252 , 3% Nevada, $73 , 1% Other, $3,292 , 40% Interest-Bearing Deposits 2Q23 ($ in millions) California, $2,484 , 41% Florida, $1,504 , 25% Texas, $949 , 15% Hawaii, $209 , 3% Nevada, $35 , 1% Other, $936 , 15% Core Business Deposits 2Q23 ($ in millions) Deposits by Geographic Distribution 24 $2,660 Total Non-IB Deposits  Insured and Collateralized Deposits 88%, Uninsured and Uncollateralized Deposits 12% as of 2Q23  Florida ranks 2nd and Texas 3rd for total number of accounts raised from our nationwide digital bank channel. $8,147 Total IB Deposits $6,118 Total Business Deposits

GRAPHIC

Copyright © 2023 First Foundation Inc. All Rights Reserved Launched digital consumer deposit channel in 3Q 2019  Online savings – 2019  Online CDs – 2020  Online checking – 2020  Online money market – 2022  Balances: $913 million at 6/30/2023  7% growth quarter over quarter  Good granularity of clients: ~ 10,000  Over 90% new clients  Reaching new, younger client audience  Average account size: ~$83 K  Strong retention experience when dropping rates  Low costs to obtain and service  Expanded digital experience into our retail branches to include paperless onboarding and in branch support for online opening Account Data Products Benefits 25 Digital Deposit Channel Success Gen Z (18- 28) 9% Millennial (29-43) 35% Gen X (44-58) 25% Baby Boomer (59- 79) 29% Silent Gen (80-96) 2% Number of Accounts by Generation 2Q23 69% of digital bank clients are younger than Baby Boomers 0 2,000 4,000 6,000 8,000 10,000 12,000 $0 $200 $400 $600 $800 $1,000 Sep-19 Dec-19 Mar-20 Jun-20 Sep-20 Dec-20 Mar-21 Jun-21 Sep-21 Dec-21 Mar-22 Jun-22 Sep-22 Dec-22 Mar-23 Jun-23 Growth Driven by Digital Marketing Strategy ($ in millions) Account Balance Number of Accounts

GRAPHIC

Copyright © 2023 First Foundation Inc. All Rights Reserved Wealth Management and Trust 26

GRAPHIC

Copyright © 2023 First Foundation Inc. All Rights Reserved In-House Expertise to Serve Clients Wealth Planning • Lead with planning • Entry point to client’s total financial picture Asset Allocation • Manage custom investment strategies to serve clients across the risk and return spectrum • Utilizes a mix of equities, fixed income, real estate, and alternative assets • Open architecture Portfolio Construction • Conduct due diligence • Create custom portfolios to match clients’ goals • Monitor, report, and adjust as necessary INVESTMENT MANAGEMENT PHILANTHROPY SERVICES WEALTH PLANNING TRUST SERVICES ASSET ALLOCATION LEGACY PLANNING Key Characteristics  Lead with sophisticated financial planning to address client needs  Open architecture investment philosophy with mix of stocks, bonds, mutual funds, ETFs, private equity, REITs, and separately managed accounts  In-house investment capabilities with strong performance  Fee-only model (vs. commission-based brokerage) with avg. fee of 60 to 70 bps  Significant cross promotion opportunities with bank, trust, and philanthropy services  Ability to deepen relationship with multiple generations of the family because of trust and philanthropy business  100% of new Assets Under Management (AUM) and Assets Under Advisement (AUA) through organic growth, more stable than M&A  Presence in affluent communities throughout CA such as Pasadena, San Diego, West Los Angeles, Orange County, in addition to expanding into Naples, FL in 2022  Combined Advisory and Trust business pre-tax profit margin of 25% in 2Q23 (17% in 1Q23) Comprehensive Offering for High-Net-Worth Clients 27

GRAPHIC

Copyright © 2023 First Foundation Inc. All Rights Reserved Loyal Clients and Growing Assets Profile of Client Growth  Target client of $3 million to $50 million in investible assets  Clients are high-net-worth individuals and families (as opposed to institutional)  Serve as central point of contact for clients’ financial matters  Average size of new clients is increasing as model attracts higher net worth clients  New client referrals through centers of influence (COIs) and partner channels, which is difficult for other RIAs to replicate  30+ year track record of building relationships with COIs – shows trust in ability to serve complex client cases  Client referrals from existing clients – shows loyalty across clients 28 $4,438 $4,927 $5,681 $4,985 $5,319 $888 $1,105 $1,345 $1,276 $5,327 $1,207 $6,032 $7,026 $6,261 $6,526 $0 $1,000 $2,000 $3,000 $4,000 $5,000 $6,000 $7,000 $8,000 YE 2019 YE 2020 YE 2021 YE 2022 2Q23 Wealth Management AUM and Trust AUA ($ in millions) FFA AUM Trust AUA Stable organic growth

GRAPHIC

Copyright © 2023 First Foundation Inc. All Rights Reserved Profitability 29

GRAPHIC

Copyright © 2023 First Foundation Inc. All Rights Reserved $155.6 $170.0 $196.6 $233.3 $318.7 $156.3 $107.7 $- $50.0 $100.0 $150.0 $200.0 $250.0 $300.0 $350.0 2018 2019 2020 2021 2022 2Q22 YTD 2Q23 YTD Net Interest Income ($ in millions) Net Interest Income 30 (1) 1) Cost of interest bearing liabilities excludes the positive impact of non-interest bearing deposits. $5,200 $5,921 $6,498 $7,409 $10,938 $12,909 $0 $2,000 $4,000 $6,000 $8,000 $10,000 $12,000 $14,000 YE 2018 YE 2019 YE 2020 YE 2021 YE 2022 2Q23 Average Interest-Earning Assets ($ in millions) Loans Securities Other 3.39% 3.22% 3.31% 3.19% 3.50% 3.84% 4.12% 4.32% 4.51% 3.20% 3.07% 3.17% 3.00% 3.18%3.10% 2.45% 1.83% 1.51% 0.35% 0.28% 0.26% 0.32% 0.54% 1.23% 2.52% 3.41% 3.97% 0.00% 0.50% 1.00% 1.50% 2.00% 2.50% 3.00% 3.50% 4.00% 4.50% 5.00% 2Q21 3Q21 4Q21 1Q22 2Q22 3Q22 4Q22 1Q23 2Q23 Net Interest Margin Earning Assets Yield Net Interest Margin Cost of Interest Bearing Liabilities  NII and NIM were adversely impacted due to Fed interest rate actions since 2022. NIM compression is expected if Fed continues with interest rate increases

GRAPHIC

Copyright © 2023 First Foundation Inc. All Rights Reserved 62% 17% 21% Recurring(1)Noninterest Income Breakdown 2Q23 YTD Investment advisory fees Trust and consulting fees Loan and deposit fees  Proven ability to generate consistent noninterest recurring fee income.  Fee income diversifies First Foundation’s operating revenue stream with 25% generated from recurring noninterest income for 2Q23. Attractive Noninterest Fee Income 31 $22.5 Million 1) Recurring revenue includes all noninterest income excluding revenue in the “other” category. $24.4 $23.1 $23.4 $28.4 $29.0 $15.6 $14.1 $4.3 $5.6 $6.1 $7.6 $9.8 $4.5 $3.7 $5.3 $7.7 $9.6 $10.9 $11.7 $5.9 $4.7 $0.4 $4.2 $15.1 $21.5 $34.4 $40.6 $54.2 $68.4 $50.5 $26.0 $22.5 $0 $10 $20 $30 $40 $50 $60 $70 2018 2019 2020 2021 2022 2Q22 YTD 2Q23 YTD Recurring(1) Noninterest Income ($ in millions) Investment advisory fees Trust and consulting fees Loan and deposit fees Gain on sale of loans

GRAPHIC

Copyright © 2023 First Foundation Inc. All Rights Reserved 0.80% 1.05% 1.30% 1.55% 1.80% 2.05% 2.30% 2.55% 2Q21 3Q21 4Q21 1Q22 2Q22 3Q22 4Q22 1Q23 2Q23 Noninterest Expense / Average Assets FFB Total(1) FFB Excluding customer service(1) Bank Peer group(2) Efficient Operating Platform  Levering its investments in personnel and technology, FFB has consistently lowered its noninterest expense to average assets and is currently operating at a significant advantage to peers. 1) Non-GAAP measure. See "Non-GAAP Financial Measures”. 2) Uniform Bank Performance Report (“UBPR”) Peer group includes commercial banks with assets between $3 billion and $10 billion for data through 3Q21. Starting in 4Q21 peer group includes commercial banks with assets between $10 and $100 billion. Peer group data based on the most recently available UBPR report of 1Q23. 32 115 bps 

GRAPHIC

Copyright © 2023 First Foundation Inc. All Rights Reserved $62.0 $81.7 $120.7 $152.9 $154.8 $90.3 $14.2 $- $20 $40 $60 $80 $100 $120 $140 $160 $180 2018 2019 2020 2021 2022 2Q22 YTD 2Q23 YTD Adjusted Income Before Taxes ($ in millions) (1) 11.0% 11.9% 15.5% 16.9% 13.0% 15.1% 2.7% 2018 2019 2020 2021 2022 2Q22 YTD 2Q23 YTD Return on Average Tangible Common Equity (1) Earnings Growth While Investing in the Future  Performance driven by growth in loans, deposits, and assets under management.  Scalable business model with significant expense leverage.  Challenges to earnings in 2023 are due to continued anticipation of future Fed rate hikes.  Expect 2023 earnings to be challenged due to continued margin compression. 1) Non-GAAP measure. See "Non-GAAP Financial Measures”. 33

GRAPHIC

Copyright © 2023 First Foundation Inc. All Rights Reserved $1.04 $1.29 $1.91 $2.43 $2.02 $1.15 $0.21 2018 2019 2020 2021 2022 2Q22 YTD 2Q23 YTD Adjusted Diluted Earnings Per Share(1) 0.84% 0.94% 1.28% 1.43% 1.00% 1.22% 0.18% 2018 2019 2020 2021 2022 2Q22 YTD 2Q23 YTD Adjusted Return on Average Assets(1) Track Record of Delivering Profitability 34 1) Non-GAAP measure. See "Non-GAAP Financial Measures”. 11.0% 11.9% 15.5% 16.9% 13.0% 15.1% 2.7% 2018 2019 2020 2021 2022 2Q22 YTD 2Q23 YTD Return on Average Tangible Common Equity(1) 63.3% 60.2% 49.3% 47.5% 58.6% 51.9% 88.2% 2018 2019 2020 2021 2022 2Q22 YTD 2Q23 YTD Efficiency Ratio(1)

GRAPHIC

Copyright © 2023 First Foundation Inc. All Rights Reserved AFS 201 20% HTM 815 80% Securities Mix 2Q23 ($ in millions) AFS HTM 1% 81% 5% 1% 1% 11% 0% Investment Securities 2Q23 CMO MBS Munis SBA FHLMC Corporate Treasury $1,015 MM Total Securities Portfolio $1,015 MM Total  84% of investment portfolio is government guaranteed  Highly liquid and pledgeable Portfolio 35  AFS unrealized loss $21 Million(1)  HTM unrealized loss $64 Million(1)  Total unrealized loss $85 Million(1) 1) Tax-effected.

GRAPHIC

Copyright © 2023 First Foundation Inc. All Rights Reserved Why First Foundation Financial Performance  Strong and stable revenue from core operations  Recurring non-interest revenue from in-house wealth management and trust operations  Diversified and high-quality loans Valuable Business Model  Commercial banking model augmented with wealth management and trust expertise  Organic growth strategy complemented by strategic acquisitions  Valuable client base with cross promotion opportunities. Strong presence in geographic markets with high household income  Technology-centric infrastructure to enhance the client experience and drive efficiency Leadership and Culture  Experienced and proven management team  Talented workforce with client-centric culture  Significant insider ownership aligned with shareholders’ interests Credit Quality  Conservative credit culture driving superior asset quality  Very low non-performing assets  Low to minimal historical charge-offs  Well capitalized 36

GRAPHIC

Copyright © 2023 First Foundation Inc. All Rights Reserved Appendix 37

GRAPHIC

Copyright © 2023 First Foundation Inc. All Rights Reserved A Tradition of Serving Our Clients History of First Foundation The path First Foundation Inc. has taken to provide banking, trust, financial planning, investment management, estate and legacy planning and consulting services to our clients, all under one roof and all under this level of care, is a path not often traveled. But we prefer it this way. At First Foundation Inc., we’ve never taken the easy path, but we’ve always chosen the right one – for our clients, our communities, and our stakeholders. The Keller Group was created as an RIA to provide private wealth management services First Foundation Bank was created as a de novo banking charter. First Foundation is adopted as the name for all affiliates. First Foundation Bank acquires Desert Commercial Bank. First Foundation West Los Angeles opens for business. First Foundation lists shares on NASDAQ Global Stock Market under ticker “FFWM” Created services to meet the needs of individuals, families, and businesses. First Foundation San Diego Office opens for business. First Foundation Las Vegas Office opens for business. First Foundation begins offering trust services. First Foundation expands into Sacramento, Auburn, and Roseville through acquisition of Community 1st Bancorp 1990 2007 2010 2012 2014 2004 2008 2011 2013 2017 Philanthropy Services are added to complement HNW business. 2015 First Foundation enters Hawaii market through acquisition of Pacific Rim Bank. First Foundation Bank opens offices in Laguna Hills and Seal Beach. 2016 First Foundation expands in LA with office in Palos Verdes Estates through acquisition of PBB Bancorp 2018 First Foundation enhances digital offering through partnership with leading FinTech provider. 2020 Relocation of Principal Executive Office to Dallas, TX. Expands into Florida through acquisition of TGR Financial. 2021-22 38

GRAPHIC

Copyright © 2023 First Foundation Inc. All Rights Reserved A sampling of awards and accolades received 39 Industry Recognition Model Bank Employee Enablement First Foundation Bank was recognized as a Model Bank for Employee Enablement by Celent as we developed an integrated back-end and front-end data warehouse and employee intranet designed to keep everything connected and in sync. 2021 Civic 50 First Foundation was included in the OneOC Civic 50 list, which is compiled annually to spotlight those companies who are civic-minded within the communities they serve. Best-in-Class for HR Management Gallagher, a global human resources consulting firm, has awarded our team with an award for Best-in-Class for HR Management from their 2019 Benefits Strategy and Benchmarking Survey. Bank & Thrift Sm-All Stars Class of 2022: FFWM The Sm-All Stars represent the top performing small-cap banks and thrifts in the country. This is the third time FFWM was one of 35 banks chosen. According to Piper Sandler, banks selected have superior performance metrics in growth, profitability, credit quality and capital strength. Featured in the Media First Foundation is a contributor to the media on important topics related to our industry Best Performing Bank in 2021 with Assets Greater than $10B First Foundation Bank ranked as the 6th best performing bank in 2021 with assets greater than $10B. S&P Global Market Intelligence calculated score for each bank on six key metrics. 2021 Vision List – Outperforming Stock First Foundation Inc. (FFWM) made B Riley’s Vision List which is a list of the top-24 stocks across all industries selected by analysts to outperform the small-cap benchmark Russell 2000 Index in the current year. Each year analysts are tasked to identify a single, immutable pick to outperform based on a set of defined criteria. Barron’s Top 100 Independent Advisors America's top independent financial advisors, as identified by Barron's. The ranking reflects the volume of assets overseen by the advisors and their teams, revenues generated for the firms, and the quality of the advisors' practices. CNBC FA 100 The CNBC FA 100 recognizes the advisory firms that top the list when it comes to offering a comprehensive planning and financial service that helps clients navigate through their complex financial life. Bank Director Best Small Regional Bank First Foundation Bank (FFB) was selected as the Top 4 small regional bank in the nation in the most recent ranking by Bank Director. The list selected the top 10 banks in each peer group based on several metrics provided by S&P Global Market Intelligence as of year-end 2020 and then studied and ranked each bank further for its performance. See disclosures at: https://www.firstfoundationinc.com/important-disclosure-information.

GRAPHIC

Copyright © 2023 First Foundation Inc. All Rights Reserved Selected Financial Information Financial Highlights: As of for 2Q23 YTD Loans $10.6 Billion Revenue: $131.5 Million Deposits $10.8 Billion Adjusted Net Income(1) $12.1 Million Total Assets $12.8 Billion Adjusted ROAA(1) 0.18% FFA AUM & Trust AUA $6.5 Billion ROATCE(1) 2.65% TBV per share(1) $16.12 Efficiency Ratio(1) 88.2% 1) Non-GAAP measure. See "Non-GAAP Financial Measures”. 40

GRAPHIC

Copyright © 2023 First Foundation Inc. All Rights Reserved  Allowance for Credit Loss of 30 bps of loans held for investment includes a net increase of $390 thousand in 2Q23 as a result of a $358 thousand specific reserve release related to PCD loans from prior acquisitions due to payoffs or updated valuations, offset by an increase of $130 thousand related to impaired loans and $614 thousand related to the remaining loan portfolios.  The increase of allowance to remaining loan portfolio is mainly due to adjustments in economic assumptions in the models.  Probability of Default (“PD”) and Loss Given Default (‘LGD”) term structure approach for majority of loan portfolio (97% of Non-PCD portfolio) with Loss Rate approach for remainder of Non-PCD loan portfolio.  PCD loans associated with the TGR Financial acquisition were individually assessed for credit losses based on methodologies consistent with the CECL standards.  Reasonable and supportable forecast period of 2 years using a weighting of Moody’s consensus and alternative economic scenarios.  Reversion to long run historical PDs and LGDs after 2 year period.  Management expects key drivers of provisioning and reserving under CECL standard going forward to include:  Replenishment of reserves for net charge-offs  Change in portfolio size and composition  All other macroeconomic variables and loan level characteristics  Ongoing reserve levels will continue to utilize quantitative and qualitative information. CECL Methodology Reserves Ongoing Impact 41 Current Expected Credit Losses (“CECL”)

GRAPHIC

Copyright © 2023 First Foundation Inc. All Rights Reserved Balance Sheet and Equity Capital 1) Use of Non-GAAP Measures 2) Regulatory capital ratios for 2Q23 are preliminary until filing of our June 30, 2023 FDIC call report. 42 8.22% 8.98% 8.53% 8.59% 8.25% 8.21% 8.93% 8.43% 7.44% 6.97% YE 2019 YE 2020 YE 2021 YE 2022 2Q23 Tier I Leverage Ratio(2) FFB FFI $11.57 $13.44 $14.92 $16.20 $16.12 YE 2019 YE 2020 YE 2021 YE 2022 2Q23 FFI TBV Per Share(1) 8.31% 8.75% 8.44% 7.13% 7.09% YE 2019 YE 2020 YE 2021 YE 2022 2Q23 FFI TCE/TA(1) 11.12% 12.25% 12.04% 11.01% 11.73% 11.15% 12.17% 11.90% 11.29% 11.76% YE 2019 YE 2020 YE 2021 YE 2022 2Q23 Total Risk Based Capital Ratio(2) FFB FFI

GRAPHIC

Copyright © 2023 First Foundation Inc. All Rights Reserved Non-GAAP Return on Average Tangible Common Equity (ROATCE), Adjusted Return on Average Assets and Net Income 43 1) Annualized net income divided by average shareholders’ equity. 2) Annualized adjusted net income available to common shareholders divided by average tangible common equity. 3) Annualized net income divided by average assets. Return on average tangible common equity was calculated by excluding average goodwill and intangibles assets from the average shareholders’ equity during the associated periods. Adjusted return on average assets represents adjusted net income attributable to common shareholders divided by average total assets. Adjusted net income attributable to common shareholders includes various adjustments to net income, including an adjustment for non-cash goodwill impairment charges, and any associated tax effect of those adjustments during the associated periods. The table below provides a reconciliation of the GAAP measure of return on average equity to the non-GAAP measure of return on average tangible common equity. The table below also provides a reconciliation of the GAAP measure of net (loss) income to the non-GAAP measure of adjusted net income attributable to common shareholders. The table below also provides a reconciliation of the GAAP measure of return on average assets to the non-GAAP measure of adjusted return on average assets: 4) Annualized adjusted net income divided by average assets. 5) Use of Non-GAAP measure.

GRAPHIC

Copyright © 2023 First Foundation Inc. All Rights Reserved Non-GAAP Efficiency Ratio 44 Efficiency ratio is a non-GAAP financial measurement determined by methods other than in accordance with U.S. GAAP. This figure represents the ratio of adjusted noninterest expense to adjusted revenue. The table below provides a calculation of the non-GAAP measure of efficiency ratio:

GRAPHIC

Copyright © 2023 First Foundation Inc. All Rights Reserved Non-GAAP Noninterest Expense to Average Assets Ratio 45 Noninterest expense to average asset ratio is a non- GAAP financial measurement determined by methods other than in accordance with U.S. GAAP. This figure represents the ratio of noninterest expense less amortization of intangible assets expense to the average assets during the associated periods for First Foundation Bank. We believe this non-GAAP measure is important to investors and provides meaningful supplemental information regarding the performance of the Company. This non-GAAP measure should not be considered a substitute for financial measures presented in accordance with GAAP and may differ from similarly titled measuresreported by other companies. The table below provides a calculation of the non-GAAP measure of noninterest expense to average assets for FFB Consolidated:

GRAPHIC

Copyright © 2023 First Foundation Inc. All Rights Reserved Non-GAAP Tangible Common Equity Ratio, Tangible Book value Per Share, And Adjusted Earnings Per Share 46 Tangible shareholders’ equity, tangible common equity to tangible asset ratio, tangible book value per share, and adjusted earnings per share (basic and diluted) are non-GAAP financial measurements determined by methods other than in accordance with U.S. GAAP. Tangible shareholder’s equity is calculated by taking shareholder’s equity and subtracting goodwill and intangible assets. Tangible common equity to tangible asset ratio is calculated by taking tangible shareholders’ equity and dividing by tangible assets which is total assets excluding the balance of goodwill and intangible assets. Tangible book value per share is calculated by dividing tangible shareholders’ equity by basic common shares outstanding, as compared to book value per share, which is calculated by dividing shareholders’ equity by basic common shares outstanding. Adjusted earnings per share (basic and diluted) is calculated by dividing adjusted net income attributable to common shareholders by average common shares outstanding (basic and diluted). The reconciliation of GAAP net (loss) income to adjusted net income attributable to common shareholders is presented on slide 43 in “Non-GAAP Return on Average Tangible Common Equity (ROATCE), Adjusted Return on Average Assets and Net Income.” The table below provides a reconciliation of the GAAP measure of shareholders’ equity to tangible shareholders’ equity. The table below also provides a reconciliation of the GAAP measure of equity to asset ratio to the non-GAAP measure of tangible common equity to tangible assets ratio. The table below also provides a reconciliation of GAAP measure of book value per share to the non-GAAP measure of tangible book value per share. The table below also provides a reconciliation of the GAAP measure of net (loss) income pershare (basic and diluted) to the non-GAAPmeasure of adjusted earnings pershare (basic and diluted):

GRAPHIC

Copyright © 2023 First Foundation Inc. All Rights Reserved firstfoundationinc.com

v3.23.2
Document and Entity Information
Jul. 27, 2023
Document and Entity Information [Abstract]  
Document Type 8-K
Document Period End Date Jul. 27, 2023
Entity File Number 001-36461
Entity Registrant Name FIRST FOUNDATION INC.
Entity Incorporation, State or Country Code DE
Entity Tax Identification Number 20-8639702
Entity Address, Address Line One 200 Crescent Court
Entity Address, Adress Line Two Suite 1400
Entity Address, City or Town Dallas
Entity Address, State or Province TX
Entity Address, Postal Zip Code 75201
City Area Code 469
Local Phone Number 638-9636
Written Communications false
Soliciting Material false
Pre-commencement Tender Offer false
Pre-commencement Issuer Tender Offer false
Title of 12(b) Security Common Stock
Trading Symbol FFWM
Security Exchange Name NASDAQ
Entity Emerging Growth Company false
Entity Central Index Key 0001413837
Amendment Flag false

First Foundation (NASDAQ:FFWM)
Historical Stock Chart
From Apr 2024 to May 2024 Click Here for more First Foundation Charts.
First Foundation (NASDAQ:FFWM)
Historical Stock Chart
From May 2023 to May 2024 Click Here for more First Foundation Charts.