UNITED STATES
SECURITIES AND EXCHANGE COMMISSION
Washington, D.C. 20549
FORM 6-K
REPORT OF FOREIGN PRIVATE ISSUER
PURSUANT TO SECTION 13a-16 OR 15d-16 UNDER
THE SECURITIES EXCHANGE ACT OF 1934
July 25, 2023
Commission file number:
001-14251
SAP EUROPEAN COMPANY
(Translation of registrant's name into English)
Dietmar-Hopp-Allee 16
69190 Walldorf
Federal Republic of Germany
(Address of principal executive offices)
Indicate by check mark whether the registrant files or will file annual
reports under cover of Form 20-F or Form 40-F.
| Form 20-F | [X] |
Form
40-F |
[ ] |
SAP SE
FORM 6-K
On July 20, 2023, SAP SE, (“SAP"), issued a quarterly statement
(the “Quarterly Statement”) announcing SAP’s financial results for the second quarter ended June 30, 2023. The Quarterly
Statement is attached as Exhibit 99.1 hereto and incorporated by reference herein.
On July 25, 2023, SAP filed a half-year report with Deutsche Boerse
AG for the first half ended June 30, 2023 (the “Half-Year Report”). The Half-Year Report is attached as Exhibit 99.2 hereto
and incorporated by reference herein.
The Quarterly Statement and the Half-Year Report disclose certain
non-IFRS measures. These measures are not prepared in accordance with IFRS and are therefore considered non-IFRS financial measures.
The non-IFRS financial measures that we report should be considered in addition to, and not as substitutes for or superior to, revenue,
operating income, cash flows, or other measures of financial performance prepared in accordance with IFRS.
Please refer to Explanations of Non-IFRS Measures online (www.sap.com/about/investor/index.epx)
for further information regarding the non-IFRS measures.
Any statements contained in this document that are not historical
facts are forward-looking statements as defined in the U.S. Private Securities Litigation Reform Act of 1995. Words such as "anticipate,"
"believe," "estimate," "expect," "forecast," "intend," "may," "plan,"
"project," "predict," "should" and "will" and similar expressions as they relate to SAP are intended
to identify such forward-looking statements. SAP undertakes no obligation to publicly update or revise any forward-looking statements.
All forward-looking statements are subject to various risks and uncertainties that could cause actual results to differ materially from
expectations. The factors that could affect SAP's future financial results are discussed more fully in SAP's filings with the U.S. Securities
and Exchange Commission (the "SEC"), including SAP's most recent Annual Report on Form 20-F filed with the SEC. Readers are
cautioned not to place undue reliance on these forward-looking statements, which speak only as of their dates.
This filing is also intended to fulfil the NYSE rules set forth in
Sections 103.00 and 203.03.
EXHIBITS
SIGNATURES
Pursuant to the requirements of the Securities Exchange Act of 1934,
the registrant has duly caused this report to be signed on its behalf by the undersigned, thereunto duly authorized.
| By: | /s/ Christopher Sessar |
| | | Name: |
Dr. Christopher Sessar |
| | | Title: |
Chief Accounting Officer |
| By: | /s/ Julia Zicke |
| | | Name: |
Dr. Julia Zicke |
| | | Title: |
Head of External Reporting and Accounting Technology |
Date: July 25, 2023
EXHIBIT INDEX
Exhibit 99.1

SAP
Announces Q2 2023 Results
| · | Cloud
revenue up 19% and up 22% at constant currencies. SAP S/4HANA cloud revenue up 74% and accelerates to 79% at constant currencies |
| · | Current
cloud backlog up 21% and up 25% constant currencies |
| · | IFRS
cloud gross profit up 20%, non-IFRS cloud gross profit up 20% and up 24% at constant currencies, supported by completion of SAP's next-generation
cloud delivery program |
| · | IFRS
operating profit up 28%, non-IFRS operating profit up 23% and up 28% at constant currencies |
| · | SAP
updates its 2023 revenue and operating profit outlook |
| · | Expands
market opportunity through new SAP Business AI and premium AI offerings |
in
€ millions, unless otherwise stated; based on SAP group results from continuing operations
 |
Christian
Klein, CEO: |
|
 |
Dominik Asam, CFO: |
"This
has been another strong quarter. We see significant opportunities ahead, in particular through the transformative power of AI. We are
focused on delivering SAP Business AI that's relevant, reliable, and responsible and we see significant possibilities for market expansion
through these technologies and new premium offerings."
|
|
"We
are very pleased with our first half results. The revenue growth and increased profitability, combined with sustained growth of our cloud
backlog, demonstrate the strength of our business model. Q2 performance puts us on the right trajectory and allows us to raise our cloud
and software revenue, as well as the operating profit outlook for the year." |
Walldorf,
Germany – July 20, 2023.
SAP SE (NYSE: SAP) today announced its financial
results for the second quarter ended June 30, 2023.
In Q1
2023, the Qualtrics consolidated group ("Qualtrics") was classified as discontinued operations under IFRS 5. Consequently,
the contribution from Qualtrics is not included in the reporting of SAP's continuing operations. See section
(M) Discontinued Operations. All figures in this statement are based
on SAP group results from continuing operations unless otherwise noted.
 | Financial
Performance |
| Group
results at a glance – Second quarter 2023 |
| |
IFRS |
|
Non-IFRS1 |
| €
million, unless otherwise stated |
Q2
2023 |
Q2
2022 |
∆
in % |
|
Q2
2023 |
Q2
2022 |
∆
in % |
∆
in %
const.
curr. |
| Cloud
revenue |
3,316 |
2,796 |
19 |
|
3,316 |
2,796 |
19 |
22 |
| Thereof
SAP S/4HANA Cloud revenue |
823 |
472 |
74 |
|
823 |
472 |
74 |
79 |
| Software
licenses |
316 |
426 |
–26 |
|
316 |
426 |
–26 |
–24 |
| Software
support |
2,873 |
2,977 |
–3 |
|
2,873 |
2,977 |
–3 |
–1 |
| Software
licenses and support revenue |
3,189 |
3,403 |
–6 |
|
3,189 |
3,403 |
–6 |
–4 |
| Cloud
and software revenue |
6,505 |
6,199 |
5 |
|
6,505 |
6,199 |
5 |
8 |
| Total
revenue |
7,554 |
7,207 |
5 |
|
7,554 |
7,207 |
5 |
8 |
| Share
of more predictable revenue (in %) |
82 |
80 |
2pp |
|
82 |
80 |
2pp |
|
| Operating
profit (loss) |
1,358 |
1,060 |
28 |
|
2,058 |
1,678 |
23 |
28 |
| Profit
(loss) after tax from continuing operations |
724 |
613 |
18 |
|
1,249 |
1,098 |
14 |
|
| Profit
(loss) after tax² |
3,381 |
203 |
>100 |
|
3,460 |
1,093 |
>100 |
|
| Earnings
per share - Basic (in €) from continuing operations |
0.62 |
0.54 |
15 |
|
1.07 |
0.95 |
12 |
|
| Earnings
per share - Diluted (in €) from continuing operations |
0.62 |
0.54 |
14 |
|
|
|
|
|
| Earnings
per share - Basic (in €)² |
2.96 |
0.29 |
>100 |
|
3.14 |
0.96 |
>100 |
|
| Earnings
per share - Diluted (in €)² |
2.93 |
0.28 |
>100 |
|
|
|
|
|
| Net
cash flows from operating activities from continuing operations |
848 |
301 |
>100 |
|
|
|
|
|
| Free
cash flow |
|
|
|
|
604 |
–10 |
<–100 |
|
| Number
of employees (FTE, June 30) |
105,328 |
104,988 |
0 |
|
|
|
|
|
1
For a breakdown of the individual adjustments
see table “Non-IFRS Adjustments by Functional Areas” in this Quarterly Statement.
2
From continuing and discontinued operations.
Due to
rounding, numbers may not add up precisely.
| |
Group results at a glance – Six months ended June 2023 |
| |
IFRS |
|
Non-IFRS1 |
| €
million, unless otherwise stated |
Q1–Q2
2023 |
Q1–Q2
2022 |
∆
in % |
|
Q1–Q2
2023 |
Q1–Q2
2022 |
∆
in % |
∆
in %
const.
curr. |
| Cloud
revenue |
6,493 |
5,362 |
21 |
|
6,493 |
5,362 |
21 |
22 |
| Thereof
SAP S/4HANA Cloud revenue |
1,539 |
876 |
76 |
|
1,539 |
876 |
76 |
77 |
| Software
licenses |
591 |
743 |
–20 |
|
591 |
743 |
–20 |
–19 |
| Software
support |
5,778 |
5,900 |
–2 |
|
5,778 |
5,900 |
–2 |
–1 |
| Software
licenses and support revenue |
6,369 |
6,643 |
–4 |
|
6,369 |
6,643 |
–4 |
–3 |
| Cloud
and software revenue |
12,863 |
12,005 |
7 |
|
12,863 |
12,005 |
7 |
8 |
| Total
revenue |
14,995 |
13,980 |
7 |
|
14,995 |
13,980 |
7 |
8 |
| Share
of more predictable revenue (in %) |
82 |
81 |
1pp |
|
82 |
81 |
1pp |
|
| |
IFRS |
|
Non-IFRS1 |
| €
million, unless otherwise stated |
Q1–Q2
2023 |
Q1–Q2
2022 |
∆
in % |
|
Q1–Q2
2023 |
Q1–Q2
2022 |
∆
in % |
∆
in %
const.
curr. |
| Operating
profit (loss) |
2,161 |
2,531 |
–15 |
|
3,933 |
3,354 |
17 |
20 |
| Profit
(loss) after tax from continuing operations |
1,128 |
1,629 |
–31 |
|
2,502 |
2,269 |
10 |
|
| Profit
(loss) after tax2 |
3,890 |
835 |
>100 |
|
5,047 |
2,259 |
>100 |
|
| Earnings
per share - Basic (in €) from continuing operations |
0.97 |
1.41 |
–31 |
|
2.15 |
1.96 |
10 |
|
| Earnings
per share - Diluted (in €) from continuing operations |
0.97 |
1.41 |
–32 |
|
|
|
|
|
| Earnings
per share - Basic (in €)2 |
3.37 |
0.92 |
>100 |
|
4.41 |
1.96 |
>100 |
|
| Earnings
per share - Diluted (in €)2 |
3.34 |
0.91 |
>100 |
|
|
|
|
|
| Net
cash flows from operating activities from continuing operations |
3,160 |
2,766 |
14 |
|
|
|
|
|
| Free
cash flow |
|
|
|
|
2,559 |
2,149 |
19 |
|
| Number
of employees (FTE, June 30) |
105,328 |
104,988 |
0 |
|
|
|
|
|
1
For a breakdown of the individual adjustments
see table “Non-IFRS Adjustments by Functional Areas” in this Quarterly Statement.
2
From continuing and discontinued operations.
Due
to rounding, numbers may not add up precisely.
 | Financial
Highlights1 |
Second Quarter 2023
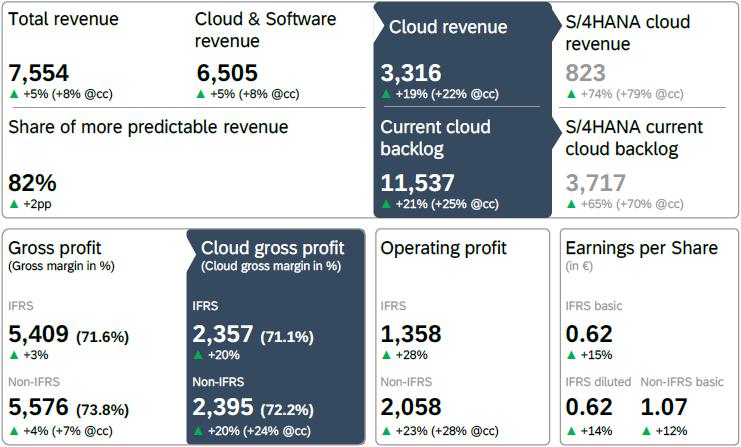
Current cloud backlog
grew by 21% to €11.54 billion and was up 25% at constant currencies. SAP S/4HANA current cloud backlog was up 65% to €3.72
billion and up 70% at constant currencies.
In the second quarter,
cloud revenue was up 19% to €3.32 billion and up 22% at constant currencies. SAP S/4HANA cloud revenue was up 74% to €823 million
and up 79% at constant currencies.
Software licenses revenue
decreased by 26% to €316 million and was down 24% at constant currencies. Cloud and software revenue was up 5% to €6.50 billion
and up 8% at constant currencies. Services revenue was up 4% to €1.05 billion and up 7% at constant currencies. Total revenue was
up 5% to €7.55 billion and up 8% at constant currencies.
The share of more predictable
revenue increased by 2 percentage points to 82% in the second quarter.
Supported by the successful
completion of the next-generation cloud delivery program, cloud gross profit was up 20% (IFRS) to €2.36 billion, up 20% to €2.40
billion (non-IFRS), and up 24% (non-IFRS at constant currencies).
IFRS operating profit
increased 28% to €1.36 billion. Non-IFRS operating profit was up 23% to €2.06 billion and up 28% at constant currencies. The
increase was mainly driven by cloud revenue growth, finalization of the next generation cloud delivery program, as well as efficiency
gains. In addition, operating profit in the second quarter of last year was negatively impacted by SAP’s decision to wind down
its business operations in Russia and Belarus. Beyond that, Q2 IFRS operating profit growth benefitted from the restructuring expenses
we reported in Q2 last year. On the other hand, it was negatively affected by higher share-based compensation expenses primarily due
to the share-price development over the second quarter of this year.
IFRS earnings per share
(basic) increased 15% to €0.62. Non-IFRS earnings per share (basic) increased 12% to €1.07. The effective tax rate was 33.8%
(IFRS) and 30.4% (non-IFRS).
Free
cash flow in the second quarter increased significantly to €604 million, driven by the strong expansion of operating profit and
a reduction of payments for, amongst others, share-based compensation, capex and leasing. For the first six months, free cash flow was
up 19% to €2.56 billion.
Completion of Qualtrics
divestiture
On
June 28, SAP announced the completion of the sale of its stake in Qualtrics at a price of US$18.15 in cash per share. The closing of
the transaction contributed an after-tax gain on sale of approximately €3.2 billion (IFRS) and approximately €2.6 billion (Non-IFRS)
to SAP’s results. The cash inflow resulting from the purchase price was €7.1 billion (€6.4 billion net of
1
The Q2 2023 results were also impacted by other
effects. For details, please refer to the disclosures on page 29 of this document.
cash and cash
equivalents held by Qualtrics). All contributions from the Qualtrics divestiture are reflected in results from discontinued operations.
For details, please refer to section M in other disclosures on page 30 of this document.
Completion of next-generation
cloud delivery program
Early in the second
quarter, SAP successfully completed the migration of its cloud customer base to its state-of-the-art, harmonized cloud infrastructure.
More than 20,000 customers and half a million tenants were migrated as part of the program, which was initiated at the beginning of 2021.
 |
Business Highlights |
In
the second quarter, customers around the globe continued to choose “RISE with SAP”
to drive their end-to-end business transformations. These customers included ARAG, Bacardi-Martini,
Bayer, DFS Deutsche Flugsicherung, Empresas Polar, Foodstuffs South Island, GOL, McBride,
Municipality of Utrecht, and Sochor.
ABN
AMRO Bank, Cirque du Soleil, HanesBrands, Levi’s, Tech Mahindra, Versuni, went live on SAP S/4HANA Cloud in the second quarter.
The
Brenda Strafford Foundation, in-tech GmbH, NKK Switches, Onyx Renewable Partners, StepLock, and Sunny Sky Products chose “GROW
with SAP”, a new offering helping midsize customers adopt cloud ERP with speed, predictability and continuous innovation.
Key
customer wins across SAP’s solution portfolio included: Breakthru Beverage, Deutsche Börse, Endress+Hauser InfoServe, La Poste,
LB Group, Sabadell Digital, Santander, TATA Projects and Visa. Numerous customers have also gone live with SAP solutions, including:
Asahi Kasei Corporation, Coca-Cola HBC, Falabella Financiero, González Byass, Fujitsu, NTT, and OMV.
In
the second quarter, SAP’s cloud revenue performance was strong across all regions. Germany, Brazil and India had outstanding cloud
revenue growth while the United States, the Netherlands, France, China and Chile performed particularly strong.
On
April 26, 2023, SAP and HP Inc. announced an expansion of its strategic relationship as HP invested in the RISE with SAP solution to
support its focus on driving digital transformation, portfolio optimization and operational efficiency. The software will provide a platform
for combining hardware, software and services to deliver flexible workforce solutions.
On
May 11, SAP and Google Cloud announced an extensive expansion of their partnership, introducing a comprehensive open data offering designed
to simplify data landscapes and unleash the power of business data.
On
May 11, SAP also announced that the Annual General Meeting of Shareholders of SAP SE elected Dr. h.c. Punit Renjen as new member of the
company’s Supervisory Board and designated successor to Prof. Dr. h.c. mult. Hasso Plattner in his role as the Chairman of the
Supervisory Board. In addition, Jennifer Li and Dr. Qi Lu were reelected as members of the Supervisory Board. The AGM also approved all
other proposals of the Executive Board and Supervisory Board. That includes the compensation system for Executive Board members, which
incorporates revisions based on shareholder feedback, and the approval to buy back treasury shares. Furthermore, the dividend proposal
of €2.05 per share for fiscal year 2022 was approved.
On
May 15, SAP announced the next step in its long-standing partnership with Microsoft, using the latest in enterprise-ready generative
AI innovation to help solve customers’ most fundamental business challenges. The companies will collaborate on integrating SAP
SuccessFactors solutions with Microsoft 365 Copilot and Copilot in Viva Learning, as well as Microsoft’s Azure OpenAI Service to
access powerful language models that analyze and generate natural language.
On
May 16, SAP announced a new share repurchase program with a volume of up to €5 billion. The program is scheduled to start in the
second half of 2023 and is expected to be fully executed by the end of 2025.
SAP
advances vision of Business Artificial Intelligence (AI)
On
May 2, SAP and IBM announced that IBM Watson technology will be embedded into a broad range of SAP solutions to provide new AI-driven
insights and automation to help accelerate innovation and create more efficient and effective user experiences across the SAP application
portfolio.
On
July 11, Sapphire Ventures announced that it is deepening its commitment to AI by investing more than US$1 billion in AI-powered enterprise
technology startups, including those specializing in generative AI. The commitment builds on
Sapphire’s history of investing in and scaling enterprise AI startups and will focus on all areas of the emerging AI tech stack
including foundation models, enablers and middleware, and next-gen AI applications.
On
July 18, SAP announced the next step in its commitment to deliver Business AI that is relevant, reliable, and responsible with strategic
direct investments in three leading generative AI companies. The investments in Aleph Alpha, Anthropic and Cohere reinforce SAP’s
open ecosystem approach to AI, leveraging the best technology to embed AI across SAP’s portfolio. They build on a series of AI
partnerships and enterprise use cases announced in May and complement the above-mentioned commitment from Sapphire Ventures.
| Segment Results at a Glance |
SAP’s reportable segment
showed the following performance:
| Applications,
Technology & Services1 |
Q2
2023 |
€ million, unless otherwise
stated
(Non-IFRS) |
Actual
Currency |
∆
in % |
∆ in %
Constant Currency |
| Cloud
revenue – SaaS2 |
2,325 |
20 |
23 |
| Cloud
revenue – PaaS3 |
521 |
42 |
45 |
| Cloud
revenue – IaaS4 |
191 |
–23 |
–21 |
| Cloud
revenue |
3,037 |
19 |
22 |
| Cloud
gross profit – SaaS2 |
1,620 |
21 |
25 |
| Cloud
gross profit – PaaS3 |
437 |
47 |
50 |
| Cloud
gross profit – IaaS4 |
70 |
–35 |
–36 |
| Cloud
gross profit |
2,127 |
22 |
25 |
| Segment
revenue |
7,269 |
5 |
7 |
| Segment
profit (loss) |
2,346 |
22 |
26 |
| Segment
margin (in %) |
32.3 |
4.6pp |
4.9pp |
1
Segment information for comparative prior periods were restated
to conform with the new segment composition.
2
Software as a service
3
Platform as a service
4
Infrastructure as a service
In the second quarter, segment
revenue in AT&S was up 5% to €7.27 billion and up 7% at constant currencies, primarily due to rapid cloud revenue growth, which
was supported by SAP S/4HANA as well as Business Technology Platform. Operating Expenses of the segment decreased by 2% and remained
flat at constant currencies, resulting in a segment margin of 32.3% and 32.6% at constant currencies. This implies a growth of 4.6 percentage
points and 4.9 percentage points at constant currencies compared to the second quarter of the prior year.
| |
Q2
2023 |
Q1–Q2
2023 |
€ millions, unless otherwise
stated
(non-IFRS) |
Actual
Currency |
∆
in % |
∆
in %
Constant
Currency |
Actual
Currency |
∆
in % |
∆
in %
Constant
Currency |
| Current
Cloud Backlog |
|
|
|
|
|
|
| Total |
11,537 |
21 |
25 |
11,537 |
21 |
25 |
| Thereof
SAP S/4HANA |
3,717 |
65 |
70 |
3,717 |
65 |
70 |
| Cloud
Revenue |
|
|
|
|
|
|
| SaaS1 |
2,604 |
19 |
22 |
5,099 |
22 |
22 |
| PaaS2 |
521 |
42 |
45 |
1,003 |
45 |
45 |
| IaaS3 |
191 |
–23 |
–21 |
391 |
–18 |
–17 |
| Total |
3,316 |
19 |
22 |
6,493 |
21 |
22 |
| Thereof
SAP S/4HANA |
823 |
74 |
79 |
1,539 |
76 |
77 |
| |
Q2
2023 |
Q1–Q2
2023 |
€ millions, unless otherwise
stated
(non-IFRS) |
Actual
Currency |
∆
in % |
∆
in %
Constant
Currency |
Actual
Currency |
∆
in % |
∆
in %
Constant
Currency |
| Cloud
Gross Profit |
|
|
|
|
|
|
| SaaS1 |
1,888 |
19 |
23 |
3,675 |
22 |
23 |
| PaaS2 |
437 |
47 |
50 |
843 |
50 |
51 |
| IaaS3 |
70 |
–35 |
–36 |
146 |
–16 |
–14 |
| Total |
2,395 |
20 |
24 |
4,664 |
24 |
25 |
| Cloud
Gross Margin (in %) |
|
|
|
|
|
|
| SaaS1 (in
%) |
72.5 |
–0.1pp |
0.1pp |
72.1 |
0.0pp |
0.3pp |
| PaaS2 (in
%) |
83.9 |
2.6pp |
2.6pp |
84.1 |
3.1pp |
3.3pp |
| IaaS3 (in
%) |
36.6 |
–6.7pp |
–8.1pp |
37.3 |
0.6pp |
1.2pp |
| Total |
72.2 |
1.1pp |
1.1pp |
71.8 |
1.7pp |
2.0pp |
1
Software as a service: SaaS comprises all other offerings which are not shown as PaaS and
IaaS.
2
Platform as a service: PaaS primarily includes SAP Business Technology Platform and
SAP Signavio.
3
Infrastructure as a service: A major portion of IaaS comes from SAP HANA Enterprise
Cloud.
Due to rounding, numbers
may not add up precisely.
 | Business
Outlook |
Financial Outlook 2023
For 2023, SAP is updating its revenue and operating profit outlook and now expects:
| · | €14.0 – 14.2 billion cloud revenue at constant currencies (2022: €11.43 billion), up 23% to 24% at constant currencies,
narrowing the range by €200 million. The previous range was €14.0 – 14.4 billion at constant currencies. |
| · | €27.0 – 27.4 billion cloud and software revenue at constant currencies (2022: €25.39 billion), up 6% to 8% at constant
currencies, narrowing the range by €100 million. The previous range was €26.9 – 27.4 billion at constant currencies. |
| · | €8.65 – 8.95 billion non-IFRS operating profit at constant currencies (2022: €7.99 billion), up 8% to 12% at constant
currencies, raising the operating profit outlook by €50 million. The previous range was €8.6 – 8.9 billion at constant
currencies. |
SAP continues to expect:
| · | A share of more predictable revenue of approximately 82% (2022: 79%). It is defined as the total of cloud revenue and software support
revenue divided by total revenue. |
| · | Free cash flow of approximately €4.9 billion (2022: €4.4 billion) |
| · | An effective tax rate (IFRS) of 28.0% to 32.0% (2022: 32.0%) and an effective tax rate (non-IFRS) of 26.0% to 28.0% (2022: 29.6%). |
While SAP’s 2023 financial outlook is at constant currencies, actual currency
reported figures are expected to be impacted by currency exchange rate fluctuations as the Company progresses through the year. See the
table below.
Currency Impact Assuming June 2023 Rates
Apply for 2023
| In percentage points |
Q3 2023 |
FY 2023 |
| Cloud revenue growth |
–7pp to –5pp |
–4pp to –2pp |
| Cloud and software revenue growth |
–6pp to –4pp |
–3.5pp to –1.5pp |
| Operating profit growth (non-IFRS) |
–6.5pp to –4.5pp |
–4.5pp to –2.5pp |
Non-Financial Outlook 2023
SAP continues to focus on three non-financial indicators: customer loyalty, employee
engagement, and carbon emissions.
In 2023, SAP continues to expect:
| · | a Customer
Net Promoter Score of 8 to 122. |
| · | an Employee Engagement Index to be in a range of 76% to 80%. |
| · | Net carbon emissions of 0kt, meaning the Company will be carbon neutral in its own operations. |
Ambition 2025
Demonstrating its strong business momentum and reflecting the divestiture of
Qualtrics, SAP updated its mid-term ambition on May 16, 2023, and expects:
| · | Cloud revenue of more than €21.5bn |
| · | Total revenue of more than €37.5bn |
| · | Non-IFRS cloud gross profit of approximately €16.3bn |
| · | Non-IFRS operating profit of approximately €11.5bn |
| · | A share of more predictable revenue of approximately 86% |
| · | Free cash flow of approximately €7.5bn |
The 2025 ambition is based on an exchange rate of 1.10 USD per EUR.
2 The guidance is based
on an adjusted methodology for 2023 to better reflect the business priorities of the company.
 | Additional
Information |
This press release and all information therein is preliminary and unaudited.
SAP Performance Measures
For more information about our key growth metrics and performance measures, their
calculation, their usefulness, and their limitation, please refer to the following document on our Investor Relations website: https://www.sap.com/investors/performance-measures
Webcast
SAP
senior management will host a financial analyst conference call on Thursday, June 20th at 7:00 PM (CEST) / 6:00 PM (BST) /
1:00 PM (Eastern) / 10:00 AM (Pacific). The conference will be webcast on the Company’s website at https://www.sap.com/investor
and will be available for replay. Supplementary financial information pertaining to the second quarter results can be found at https://www.sap.com/investor.
About SAP
SAP’s strategy is to help every business run as an
intelligent enterprise. As a market leader in enterprise application software, we help companies of all sizes and in all industries run
at their best: SAP customers generate 87% of total global commerce. Our machine learning, Internet of Things (IoT), and advanced analytics
technologies help turn customers’ businesses into intelligent enterprises. SAP helps give people and organizations deep business
insight and fosters collaboration that helps them stay ahead of their competition. We simplify technology for companies so they can consume
our software the way they want – without disruption. Our end-to-end suite of applications and services enables business and public
customers across 25 industries globally to operate profitably, adapt continuously, and make a difference. With a global network of customers,
partners, employees, and thought leaders, SAP helps the world run better and improve people’s lives. For more information, visit
www.sap.com.
For more information, financial community only:
| Anthony Coletta |
+49 (6227) 7-60437 |
investor@sap.com, CET |
Follow
SAP Investor Relations on Twitter at @sapinvestor.
For
more information, press only:
| Joellen Perry |
+1 (650) 445-6780 |
joellen.perry@sap.com, PT |
| Daniel Reinhardt |
+49 (6227) 7-40201 |
daniel.reinhardt@sap.com, CET |
For
customers interested in learning more about SAP products:
| Global Customer Center: |
+49 180 534-34-24 |
| United States Only: |
+1 (800) 872-1SAP (+1-800-872-1727) |
Note to editors:
To
preview and download broadcast-standard stock footage and press photos digitally, please visit www.sap.com/photos. On this platform,
you can find high resolution material for your media channels. To view video stories on diverse topics, visit www.sap-tv.com. From this
site, you can embed videos into your own Web pages, share video via email links, and subscribe to RSS feeds from SAP TV.
This
document contains forward-looking statements, which are predictions, projections, or other statements about future events. These statements
are based on current expectations, forecasts, and assumptions that are subject to risks and uncertainties that could cause actual results
and outcomes to materially differ. Additional information regarding these risks and uncertainties may be found in our filings with the
Securities and Exchange Commission, including but not limited to the risk factors section of SAP’s 2022 Annual Report on Form 20-F.
©
2023 SAP SE. All rights reserved.
SAP and other SAP products and services mentioned herein as well as their respective logos are trademarks or registered trademarks of
SAP SE in Germany and other countries. Please see https://www.sap.com/copyright for additional trademark information and notices.
Contents
Financial and Non-Financial Key Facts
(IFRS and Non-IFRS)
| € millions, unless otherwise stated |
Q1
2022 |
Q2
2022 |
Q3
2022 |
Q4
2022 |
TY
2022 |
Q1
2023 |
Q2
2023 |
| Revenues |
|
|
|
|
|
|
|
| Cloud |
2,565 |
2,796 |
2,986 |
3,078 |
11,426 |
3,178 |
3,316 |
| % change – yoy |
29 |
32 |
36 |
29 |
31 |
24 |
19 |
| % change constant currency – yoy |
23 |
23 |
23 |
21 |
23 |
22 |
22 |
| SAP S/4HANA Cloud |
404 |
472 |
546 |
660 |
2,081 |
716 |
823 |
| % change – yoy |
78 |
84 |
98 |
101 |
91 |
77 |
74 |
| % change constant currency – yoy |
71 |
72 |
81 |
90 |
79 |
75 |
79 |
| Software licenses |
317 |
426 |
406 |
907 |
2,056 |
276 |
316 |
| % change – yoy |
–34 |
–34 |
–38 |
–38 |
–37 |
–13 |
–26 |
| % change constant currency – yoy |
–36 |
–38 |
–42 |
–39 |
–39 |
–13 |
–24 |
| Software support |
2,923 |
2,977 |
3,016 |
2,993 |
11,909 |
2,905 |
2,873 |
| % change – yoy |
4 |
5 |
5 |
3 |
4 |
–1 |
–3 |
| % change constant currency – yoy |
1 |
0 |
–2 |
–1 |
0 |
–1 |
–1 |
| Software licenses and support |
3,240 |
3,403 |
3,422 |
3,900 |
13,965 |
3,180 |
3,189 |
| % change – yoy |
–1 |
–2 |
–3 |
–11 |
–5 |
–2 |
–6 |
| % change constant currency – yoy |
–4 |
–7 |
–9 |
–14 |
–9 |
–2 |
–4 |
| Cloud and software |
5,806 |
6,199 |
6,408 |
6,978 |
25,391 |
6,358 |
6,505 |
| % change – yoy |
10 |
11 |
12 |
3 |
9 |
10 |
5 |
| % change constant currency – yoy |
6 |
4 |
3 |
–1 |
3 |
8 |
8 |
| Total revenue |
6,773 |
7,207 |
7,476 |
8,064 |
29,520 |
7,441 |
7,554 |
| % change – yoy |
10 |
11 |
13 |
5 |
10 |
10 |
5 |
| % change constant currency – yoy |
6 |
5 |
4 |
0 |
4 |
9 |
8 |
| Share of more predictable revenue (in %) |
81 |
80 |
80 |
75 |
79 |
82 |
82 |
| Profits |
|
|
|
|
|
|
|
| Operating profit (loss) (IFRS) |
1,471 |
1,060 |
1,557 |
2,002 |
6,090 |
803 |
1,358 |
| Operating profit (loss) (non-IFRS) |
1,676 |
1,678 |
2,075 |
2,560 |
7,989 |
1,875 |
2,058 |
| % change |
–3 |
–12 |
–1 |
3 |
–3 |
12 |
23 |
| % change constant currency |
–6 |
–15 |
–8 |
1 |
–7 |
12 |
28 |
| Profit (loss) after tax (IFRS) |
1,016 |
613 |
839 |
600 |
3,068 |
403 |
724 |
| Profit (loss) after tax (non-IFRS) |
1,171 |
1,098 |
1,240 |
1,008 |
4,517 |
1,254 |
1,249 |
| % change |
–29 |
–50 |
–42 |
–56 |
–45 |
7 |
14 |
| Margins |
|
|
|
|
|
|
|
| Cloud gross margin (IFRS, in %) |
68.2 |
70.2 |
69.8 |
69.2 |
69.4 |
70.5 |
71.1 |
| Cloud gross margin (non-IFRS, in %) |
68.9 |
71.2 |
70.8 |
70.3 |
70.3 |
71.4 |
72.2 |
| Software license and support gross margin (IFRS, in %) |
89.3 |
90.1 |
90.0 |
90.8 |
90.1 |
88.6 |
90.1 |
| Software license and support gross margin (non-IFRS, in %) |
89.7 |
90.7 |
90.7 |
91.4 |
90.7 |
89.2 |
90.5 |
| Cloud and software gross margin (IFRS, in %) |
80.0 |
81.1 |
80.6 |
81.3 |
80.8 |
79.5 |
80.3 |
| Cloud and software gross margin (non-IFRS, in %) |
80.5 |
81.9 |
81.4 |
82.1 |
81.5 |
80.3 |
81.2 |
| Gross margin (IFRS, in %) |
72.2 |
72.7 |
72.8 |
73.4 |
72.8 |
71.0 |
71.6 |
| Gross margin (non-IFRS, in %) |
73.1 |
74.3 |
74.4 |
75.1 |
74.3 |
72.9 |
73.8 |
| Operating margin (IFRS, in %) |
21.7 |
14.7 |
20.8 |
24.8 |
20.6 |
10.8 |
18.0 |
| Operating margin (non-IFRS, in %) |
24.8 |
23.3 |
27.8 |
31.7 |
27.1 |
25.2 |
27.2 |
| ATS segment – Segment gross margin (in %) |
72.5 |
73.7 |
73.3 |
74.5 |
73.5 |
72.3 |
73.3 |
| ATS segment – Segment margin in % |
28.9 |
27.6 |
31.4 |
35.0 |
30.9 |
29.6 |
32.3 |
| Key Profit Ratios |
|
|
|
|
|
|
|
| Effective tax rate (IFRS, in %) |
25.5 |
34.2 |
28.3 |
42.8 |
32.0 |
40.5 |
33.8 |
| Effective tax rate (non-IFRS, in %) |
25.4 |
29.1 |
26.6 |
37.2 |
29.6 |
28.3 |
30.4 |
| Earnings per share, basic (IFRS, in €) from continuing operations |
0.87 |
0.54 |
0.75 |
0.63 |
2.80 |
0.35 |
0.62 |
| Earnings per share, basic (non-IFRS, in €) from continuing operations |
1.00 |
0.95 |
1.10 |
0.98 |
4.03 |
1.08 |
1.07 |
| Earnings per share, basic (IFRS, in €)4 |
0.63 |
0.29 |
0.57 |
0.46 |
1.95 |
0.41 |
2.96 |
| € millions, unless otherwise stated |
Q1
2022 |
Q2
2022 |
Q3
2022 |
Q4
2022 |
TY
2022 |
Q1
2023 |
Q2
2023 |
| Earnings per share, basic (non-IFRS, in €)4 |
1.00 |
0.96 |
1.12 |
1.00 |
4.08 |
1.27 |
3.14 |
| Order Entry and current cloud backlog |
|
|
|
|
|
|
|
| Current cloud backlog |
8,937 |
9,543 |
10,334 |
11,024 |
11,024 |
11,148 |
11,537 |
| % change – yoy |
25 |
32 |
36 |
27 |
27 |
25 |
21 |
| % change constant currency – yoy |
21 |
23 |
24 |
24 |
24 |
25 |
25 |
| SAP S/4HANA Current cloud backlog |
1,925 |
2,258 |
2,662 |
3,171 |
3,171 |
3,418 |
3,717 |
| % change – yoy |
86 |
100 |
108 |
86 |
86 |
78 |
65 |
| % change constant currency – yoy |
79 |
87 |
90 |
82 |
82 |
79 |
70 |
| Share of cloud orders greater than €5 million based on total cloud order entry volume (in %)3 |
43 |
49 |
42 |
55 |
50 |
45 |
46 |
| Share of cloud orders smaller than €1 million based on total cloud order entry volume (in %)3 |
29 |
25 |
26 |
18 |
23 |
26 |
25 |
| Share of on-premise orders greater than €5 million based on total software order entry volume (in %) |
40 |
33 |
28 |
29 |
31 |
26 |
22 |
| Share of on-premise orders smaller than €1 million based on total software order entry volume (in %) |
33 |
40 |
49 |
37 |
40 |
50 |
50 |
| Liquidity and Cash Flow |
|
|
|
|
|
|
|
| Net cash flows from operating activities |
2,465 |
301 |
887 |
2,022 |
5,675 |
2,311 |
848 |
| Capital expenditure |
–212 |
–196 |
–277 |
–193 |
–877 |
–257 |
–156 |
| Payments of lease liabilities |
–93 |
–116 |
–97 |
–103 |
–410 |
–99 |
–89 |
| Free cash flow |
2,159 |
–10 |
513 |
1,726 |
4,388 |
1,955 |
604 |
| % of total revenue |
32 |
0 |
7 |
21 |
15 |
26 |
8 |
| % of profit after tax (IFRS) |
213 |
–2 |
61 |
288 |
143 |
485 |
83 |
| Group liquidity |
11,267 |
8,236 |
8,554 |
9,694 |
9,694 |
9,700 |
14,326 |
| Financial debt (–) |
–12,171 |
–12,282 |
–12,282 |
–11,764 |
–11,764 |
–10,751 |
–10,146 |
| Net debt (–) |
–904 |
–4,046 |
–3,728 |
–2,070 |
–2,070 |
–1,050 |
4,180 |
| Financial Position5 |
|
|
|
|
|
|
|
| Cash and cash equivalents |
8,927 |
7,472 |
7,316 |
9,008 |
9,008 |
8,766 |
14,142 |
| Goodwill |
32,140 |
33,879 |
35,664 |
33,077 |
33,077 |
28,563 |
28,581 |
| Total assets |
73,754 |
72,605 |
74,840 |
72,159 |
72,159 |
73,533 |
69,719 |
| Contract liabilities (current) |
7,630 |
6,883 |
5,487 |
5,309 |
5,309 |
7,547 |
6,743 |
| Equity ratio (total equity in % of total assets) |
58 |
59 |
62 |
59 |
59 |
58 |
61 |
| Non-Financials |
|
|
|
|
|
|
|
| Number of employees (quarter end)1 |
104,670 |
104,988 |
106,912 |
106,312 |
106,312 |
105,132 |
105,328 |
| Employee retention (in %, rolling 12 months) |
92.5 |
92.0 |
92.2 |
92.8 |
92.8 |
93.8 |
95.1 |
| Women in management (in %, quarter end) |
28.6 |
28.9 |
29.2 |
29.3 |
29.3 |
29.4 |
29.5 |
| Net carbon emissions2 (in kilotons) |
20 |
20 |
20 |
20 |
85 |
0 |
0 |
1 In
full-time equivalents
2 In
CO2 equivalents. SAP’s carbon emission numbers are rounded to the nearest 5 kt. Therefore, the rounded full-year
totals may not precisely equal the sum of the rounded quarterly numbers.
³ To conform to refined
calculation logic, prior quarters have been adjusted.
4 From
continuing and discontinued operations.
5 According
to IFRS 5, comparison quarters 2022 for our continuing operations is unchanged from what previously has been reported.
Due to rounding, numbers may not
add up precisely.
Primary Financial Statements of SAP Group (IFRS)
(A) Consolidated
Income Statements
(A.1) Consolidated
Income Statements – Quarter
| € millions, unless otherwise stated |
|
Q2 2023 |
Q2 2022 |
∆ in % |
| Cloud |
|
3,316 |
2,796 |
19 |
| Software licenses |
|
316 |
426 |
–26 |
| Software support |
|
2,873 |
2,977 |
–3 |
| Software licenses and support |
|
3,189 |
3,403 |
–6 |
| Cloud and software |
|
6,505 |
6,199 |
5 |
| Services |
|
1,050 |
1,007 |
4 |
| Total revenue |
|
7,554 |
7,207 |
5 |
| |
|
|
|
|
| Cost of cloud |
|
–959 |
–833 |
15 |
| Cost of software licenses and support |
|
–324 |
–339 |
–4 |
| Cost of cloud and software |
|
–1,282 |
–1,172 |
9 |
| Cost of services |
|
–863 |
–795 |
8 |
| Total cost of revenue |
|
–2,145 |
–1,967 |
9 |
| Gross profit |
|
5,409 |
5,240 |
3 |
| Research and development |
|
–1,565 |
–1,514 |
3 |
| Sales and marketing |
|
–2,165 |
–2,100 |
3 |
| General and administration |
|
–322 |
–341 |
–6 |
| Restructuring |
|
3 |
–130 |
<-100 |
| Other operating income/expense, net |
|
–3 |
–95 |
–97 |
| Total operating expenses |
|
–6,196 |
–6,147 |
1 |
| Operating profit (loss) |
|
1,358 |
1,060 |
28 |
| |
|
|
|
|
| Other non-operating income/expense, net |
|
–89 |
–11 |
>100 |
| Finance income |
|
187 |
178 |
6 |
| Finance costs |
|
–363 |
–295 |
23 |
| Financial income, net |
|
–175 |
–118 |
49 |
| Profit (loss) before tax from continuing operations |
|
1,093 |
930 |
18 |
| |
|
|
|
|
| Income tax expense |
|
–369 |
–318 |
16 |
| Profit (loss) after tax from continuing operations |
|
724 |
613 |
18 |
| Attributable to owners of parent |
|
728 |
634 |
15 |
| Attributable to non-controlling interests |
|
–4 |
–21 |
–82 |
| Profit (loss) after tax from discontinued operations |
|
2,656 |
–409 |
<-100 |
| Profit (loss) after tax2 |
|
3,381 |
203 |
>100 |
| Attributable to owners of parent2 |
|
3,455 |
334 |
>100 |
| Attributable to non-controlling interests2 |
|
–74 |
–131 |
–44 |
| |
|
|
|
|
| Earnings per share, basic (in €)1 from continuing operations |
|
0.62 |
0.54 |
15 |
| Earnings per share, basic (in €)1, 2 |
|
2.96 |
0.29 |
>100 |
| Earnings per share, diluted (in €)1 from continuing operations |
|
0.62 |
0.54 |
14 |
| Earnings per share, diluted (in €)1, 2 |
|
2.93 |
0.28 |
>100 |
1
For the three months ended June 30, 2023 and 2022, the weighted average number of shares
was 1,169 million (diluted 1,180 million) and 1,171 million (diluted: 1,174 million), respectively (treasury stock excluded).
2
From continuing and discontinued operations.
Due to rounding, numbers may not
add up precisely.
(A.2) Consolidated Income Statements – Year-to-Date
| € millions, unless otherwise stated |
|
Q1–Q2
2023 |
Q1–Q2
2022 |
∆ in % |
| Cloud |
|
6,493 |
5,362 |
21 |
| Software licenses |
|
591 |
743 |
–20 |
| Software support |
|
5,778 |
5,900 |
–2 |
| Software licenses and support |
|
6,369 |
6,643 |
–4 |
| Cloud and software |
|
12,863 |
12,005 |
7 |
| Services |
|
2,132 |
1,974 |
8 |
| Total revenue |
|
14,995 |
13,980 |
7 |
| |
|
|
|
|
| Cost of cloud |
|
–1,897 |
–1,650 |
15 |
| Cost of software licenses and support |
|
–687 |
–686 |
0 |
| Cost of cloud and software |
|
–2,584 |
–2,336 |
11 |
| Cost of services |
|
–1,718 |
–1,516 |
13 |
| Total cost of revenue |
|
–4,301 |
–3,852 |
12 |
| Gross profit |
|
10,693 |
10,127 |
6 |
| Research and development |
|
–3,138 |
–2,910 |
8 |
| Sales and marketing |
|
–4,457 |
–3,842 |
16 |
| General and administration |
|
–670 |
–610 |
10 |
| Restructuring |
|
–257 |
–119 |
>100 |
| Other operating income/expense, net |
|
–10 |
–115 |
–91 |
| Total operating expenses |
|
–12,834 |
–11,449 |
12 |
| Operating profit (loss) |
|
2,161 |
2,531 |
–15 |
| |
|
|
|
|
| Other non-operating income/expense, net |
|
–103 |
–63 |
64 |
| Finance income |
|
369 |
520 |
–29 |
| Finance costs |
|
–656 |
–692 |
–5 |
| Financial income, net |
|
–287 |
–173 |
66 |
| Profit (loss) before tax from continuing operations |
|
1,771 |
2,295 |
–23 |
| |
|
|
|
|
| Income tax expense |
|
–643 |
–666 |
–3 |
| Profit (loss) after tax from continuing operations |
|
1,128 |
1,629 |
–31 |
| Attributable to owners of parent |
|
1,135 |
1,657 |
–31 |
| Attributable to non-controlling interests |
|
–7 |
–28 |
–74 |
| Profit (loss) after tax from discontinued operations |
|
2,763 |
–794 |
<-100 |
| Profit (loss) after tax2 |
|
3,890 |
835 |
>100 |
| Attributable to owners of parent2 |
|
3,933 |
1,074 |
>100 |
| Attributable to non-controlling interests2 |
|
–43 |
–239 |
–82 |
| |
|
|
|
|
| Earnings per share, basic (in €)1 from continuing operations |
|
0.97 |
1.41 |
–31 |
| Earnings per share, basic (in €)1, 2 |
|
3.37 |
0.92 |
>100 |
| Earnings per share, diluted (in €)1 from continuing operations |
|
0.97 |
1.41 |
–32 |
| Earnings per share, diluted (in €)1, 2 |
|
3.34 |
0.91 |
>100 |
1 For the
six months ended June 30, 2023 and 2023, the weighted average number of shares was 1,168 million (diluted: 1,176 million)
and 1,174 million (diluted: 1,174 million), respectively (treasury stock excluded).
2 From continuing and discontinued operations
Due to rounding, numbers may not add up precisely.
(B) Consolidated Statements
of Financial Position
| as at 6/30/2023 and 12/31/2022 |
| € millions |
2023 |
20221 |
| Cash and cash equivalents |
14,142 |
9,008 |
| Other financial assets |
480 |
853 |
| Trade and other receivables |
5,594 |
6,236 |
| Other non-financial assets |
2,371 |
2,139 |
| Tax assets |
403 |
287 |
| Total current assets |
22,990 |
18,522 |
| Goodwill |
28,581 |
33,077 |
| Intangible assets |
2,259 |
3,835 |
| Property, plant, and equipment |
4,361 |
4,934 |
| Other financial assets |
5,513 |
5,626 |
| Trade and other receivables |
121 |
169 |
| Other non-financial assets |
3,397 |
3,580 |
| Tax assets |
315 |
323 |
| Deferred tax assets |
2,182 |
2,095 |
| Total non-current assets |
46,730 |
53,638 |
| Total assets |
69,719 |
72,159 |
| |
| € millions |
2023 |
20221 |
| Trade and other payables |
1,584 |
2,147 |
| Tax liabilities |
582 |
283 |
| Financial liabilities |
3,068 |
4,808 |
| Other non-financial liabilities |
3,859 |
4,818 |
| Provisions |
339 |
90 |
| Contract liabilities |
6,743 |
5,309 |
| Total current liabilities |
16,176 |
17,453 |
| Trade and other payables |
57 |
79 |
| Tax liabilities |
901 |
893 |
| Financial liabilities |
9,169 |
9,547 |
| Other non-financial liabilities |
677 |
705 |
| Provisions |
336 |
359 |
| Deferred tax liabilities |
146 |
241 |
| Contract liabilities |
28 |
33 |
| Total non-current liabilities |
11,314 |
11,858 |
| Total liabilities |
27,490 |
29,311 |
| Issued capital |
1,229 |
1,229 |
| Share premium |
1,552 |
3,081 |
| Retained earnings |
40,225 |
36,418 |
| Other components of equity |
3,100 |
3,801 |
| Treasury shares |
–4,159 |
–4,341 |
| Equity attributable to owners of parent |
41,946 |
40,186 |
| |
|
|
| Non-controlling interests |
283 |
2,662 |
| Total equity |
42,229 |
42,848 |
| Total equity and liabilities |
69,719 |
72,159 |
1
According to IFRS 5, Consolidated Statements of Financial Position as of 12/31/2022 for our
continuing operations is unchanged from what previously has been reported.
Due to rounding, numbers may not add
up precisely.
(C) Consolidated Statements
of Cash Flows
| € millions |
Q1–Q2 2023 |
Q1–Q2 20221 |
| Profit (loss) after tax |
3,890 |
835 |
| Adjustments to reconcile profit (loss) after tax to net cash flows from operating activities: |
|
|
| (Profit) loss after tax from discontinued operations |
–2,763 |
794 |
| Depreciation and amortization |
714 |
774 |
| Share-based payment expense |
1,167 |
513 |
| Income tax expense |
643 |
666 |
| Financial income, net |
287 |
173 |
| Decrease/increase in allowances on trade receivables |
5 |
104 |
| Other adjustments for non-cash items |
76 |
11 |
| Decrease/increase in trade and other receivables |
396 |
865 |
| Decrease/increase in other assets |
–600 |
–600 |
| Increase/decrease in trade payables, provisions, and other liabilities |
–896 |
–1,240 |
| Increase/decrease in contract liabilities |
2,109 |
2,073 |
| Share-based payments |
–697 |
–927 |
| Interest paid |
–244 |
–138 |
| Interest received |
197 |
44 |
| Income taxes paid, net of refunds |
–1,127 |
–1,181 |
| Net cash flows from operating activities – continuing operations |
3,160 |
2,766 |
| Net cash flows from operating activities – discontinued operations |
80 |
–14 |
| Net cash flows from operating activities |
3,240 |
2,752 |
| Business combinations, net of cash and cash equivalents acquired |
0 |
–664 |
| Cash flows from derivative financial instruments related to the sale of subsidiaries or businesses |
–91 |
0 |
| Purchase of intangible assets or property, plant, and equipment |
–413 |
–408 |
| Proceeds from sales of intangible assets or property, plant, and equipment |
43 |
46 |
| Purchase of equity or debt instruments of other entities |
–220 |
–2,256 |
| Proceeds from sales of equity or debt instruments of other entities |
722 |
4,005 |
| Net cash flows from investing activities – continuing operations |
41 |
723 |
| Net cash flows from investing activities – discontinued operations |
6,323 |
–15 |
| Net cash flows from investing activities |
6,364 |
708 |
| Dividends paid |
–2,395 |
–2,865 |
| Dividends paid on non-controlling interests |
–18 |
–3 |
| Purchase of treasury shares |
0 |
–1,000 |
| Proceeds from borrowings |
0 |
38 |
| Repayments of borrowings |
–1,724 |
–944 |
| Payments of lease liabilities |
–188 |
–209 |
| Transactions with non-controlling interests |
43 |
0 |
| Net cash flows from financing activities – continuing operations |
–4,283 |
–4,982 |
| Net cash flows from financing activities – discontinued operations |
24 |
–209 |
| Net cash flows from financing activities |
–4,259 |
–5,191 |
| Effect of foreign currency rates on cash and cash equivalents |
–212 |
305 |
| Net decrease/increase in cash and cash equivalents |
5,134 |
–1,427 |
| Cash and cash equivalents at the beginning of the period |
9,008 |
8,898 |
| Cash and cash equivalents at the end of the period |
14,142 |
7,472 |
1 We do no longer show cash flows linked to the supply chain financing (SCF) transactions from Taulia in investing/financing cash flow separately and therefore adjusted the comparative figures accordingly.
Due to rounding, numbers may not add up precisely.
Non-IFRS Numbers
| (D) | Basis of Non-IFRS Presentation |
SAP disclose certain financial measures such as expense (non-IFRS) and profit
measures (non-IFRS) that are not prepared in accordance with IFRS and are therefore considered non-IFRS financial measures.
For a more detailed description
of all of SAP’s non-IFRS measures and their limitations as well as SAP’s constant currency and free cash flow figures, see
Explanation of Non-IFRS Measures online.
| (E) | Reconciliation from Non-IFRS Numbers to IFRS Numbers |
| (E.1) | Reconciliation
of Non-IFRS Revenue –
Quarter |
| € millions, unless otherwise stated |
Q2 2023 |
Q2 2022 |
∆ in % |
| IFRS |
Currency
Impact |
Non-IFRS
Constant
Currency |
IFRS |
IFRS |
Non-IFRS
Constant
Currency1 |
| Revenue Numbers |
|
|
|
|
|
|
| Cloud |
3,316 |
86 |
3,401 |
2,796 |
19 |
22 |
| Software licenses |
316 |
10 |
325 |
426 |
–26 |
–24 |
| Software support |
2,873 |
73 |
2,947 |
2,977 |
–3 |
–1 |
| Software licenses and support |
3,189 |
83 |
3,272 |
3,403 |
–6 |
–4 |
| Cloud and software |
6,505 |
169 |
6,673 |
6,199 |
5 |
8 |
| Services |
1,050 |
27 |
1,076 |
1,007 |
4 |
7 |
| Total revenue |
7,554 |
196 |
7,750 |
7,207 |
5 |
8 |
1 Constant currency
period-over-period changes are calculated by comparing the current year's non-IFRS constant currency numbers with the IFRS numbers of
the previous year's respective period.
Due to rounding, numbers may not add up precisely.
| (E.2) | Reconciliation
of Non-IFRS Operating Expenses – Quarter |
| € millions, unless otherwise stated |
Q2 2023 |
Q2 2022 |
∆ in % |
| IFRS |
Adj. |
Non-IFRS |
Currency
Impact |
Non-IFRS
Constant
Currency |
IFRS |
Adj. |
Non-IFRS |
IFRS |
Non-IFRS |
Non-IFRS
Constant
Currency1 |
| Operating Expense Numbers |
|
|
|
|
|
|
|
|
|
|
|
| Cost of cloud |
–959 |
38 |
–920 |
|
|
–833 |
28 |
–806 |
15 |
14 |
|
| Cost of software licenses and support |
–324 |
21 |
–302 |
|
|
–339 |
22 |
–316 |
–4 |
–4 |
|
| Cost of cloud and software |
–1,282 |
60 |
–1,223 |
|
|
–1,172 |
50 |
–1,122 |
9 |
9 |
|
| Cost of services |
–863 |
107 |
–756 |
|
|
–795 |
69 |
–726 |
8 |
4 |
|
| Total cost of revenue |
–2,145 |
166 |
–1,978 |
|
|
–1,967 |
118 |
–1,849 |
9 |
7 |
|
| Gross profit |
5,409 |
166 |
5,576 |
|
|
5,240 |
118 |
5,358 |
3 |
4 |
|
| Research and development |
–1,565 |
204 |
–1,361 |
|
|
–1,514 |
122 |
–1,393 |
3 |
–2 |
|
| Sales and marketing |
–2,165 |
296 |
–1,869 |
|
|
–2,100 |
209 |
–1,891 |
3 |
–1 |
|
| General and administration |
–322 |
36 |
–285 |
|
|
–341 |
40 |
–301 |
–6 |
–5 |
|
| Restructuring |
3 |
–3 |
0 |
|
|
–130 |
130 |
0 |
<-100 |
NA |
|
| Other operating income/expense, net |
–3 |
0 |
–3 |
|
|
–95 |
0 |
–95 |
–97 |
–97 |
|
| Total operating expenses |
–6,196 |
700 |
–5,496 |
–107 |
–5,604 |
–6,147 |
618 |
–5,529 |
1 |
–1 |
1 |
1 Constant currency
period-over-period changes are calculated by comparing the current year's non-IFRS constant currency numbers with the non-IFRS numbers
of the previous year's respective period.
Due to rounding, numbers may not add up precisely.
| (E.3) | Reconciliation
of Non-IFRS Profit Figures, Income Tax, and Key Ratios – Quarter |
| € millions, unless otherwise stated |
Q2 2023 |
Q2 2022 |
∆ in % |
| IFRS |
Adj. |
Non-IFRS |
Currency
Impact |
Non-IFRS
Constant
Currency |
IFRS |
Adj. |
Non-IFRS |
IFRS |
Non-IFRS |
Non-IFRS
Constant
Currency1 |
| Profit Numbers |
|
|
|
|
|
|
|
|
|
|
|
| Operating profit (loss) |
1,358 |
700 |
2,058 |
88 |
2,146 |
1,060 |
618 |
1,678 |
28 |
23 |
28 |
| Profit (loss) before tax from continuing operations |
1,093 |
700 |
1,794 |
|
|
930 |
618 |
1,548 |
18 |
16 |
|
| Income tax expense |
–369 |
–176 |
–545 |
|
|
–318 |
–133 |
–451 |
16 |
21 |
|
| Profit (loss) after tax from continuing operations |
724 |
524 |
1,249 |
|
|
613 |
485 |
1,098 |
18 |
14 |
|
| Attributable to owners of parent |
728 |
523 |
1,252 |
|
|
634 |
483 |
1,117 |
15 |
12 |
|
| Attributable to non-controlling interests |
–4 |
1 |
–3 |
|
|
–21 |
2 |
–19 |
–82 |
–85 |
|
| Profit (loss) after tax3 |
3,381 |
79 |
3,460 |
|
|
203 |
890 |
1,093 |
>100 |
>100 |
|
| Attributable to owners of parent3 |
3,455 |
210 |
3,665 |
|
|
334 |
794 |
1,128 |
>100 |
>100 |
|
| Attributable to non-controlling interests3 |
–74 |
–131 |
–205 |
|
|
–131 |
96 |
–35 |
–44 |
>100 |
|
| |
|
|
|
|
|
|
|
|
|
|
|
| Key Ratios |
|
|
|
|
|
|
|
|
|
|
|
| Operating margin (in %) |
18.0 |
|
27.2 |
|
27.7 |
14.7 |
|
23.3 |
3.3pp |
4.0pp |
4.4pp |
| Effective tax rate (in %)2 |
33.8 |
|
30.4 |
|
|
34.2 |
|
29.1 |
–0.4pp |
1.3pp |
|
| Earnings per share, basic (in €) from continuing operations |
0.62 |
|
1.07 |
|
|
0.54 |
|
0.95 |
15 |
12 |
|
| Earnings per share, basic (in €)3 |
2.96 |
|
3.14 |
|
|
0.29 |
|
0.96 |
>100 |
>100 |
|
1 Constant currency
period-over-period changes are calculated by comparing the current year's non-IFRS constant currency numbers with the non-IFRS numbers
of the previous year's respective period.
2 The difference
between our effective tax rate (IFRS) and effective tax rate (non-IFRS) in Q2 2023 mainly resulted from tax effects of share-based payment
expenses and acquisition-related charges. The difference between our effective tax rate (IFRS) and effective tax rate (non-IFRS) in Q2
2022 mainly resulted from tax effects of share-based payment expenses, restructuring expenses and acquisition-related charges.
3 From continuing and discontinued operations
Due to rounding, numbers may not add up precisely.
| (E.4) | Reconciliation
of Non-IFRS Revenue – Year-to-Date |
| € millions, unless otherwise stated |
Q1–Q2 2023 |
Q1–Q2 2022 |
∆ in % |
| IFRS |
Currency
Impact |
Non-IFRS
Constant
Currency |
IFRS |
IFRS |
Non-IFRS
Constant
Currency1 |
| Revenue Numbers |
|
|
|
|
|
|
| Cloud |
6,493 |
39 |
6,532 |
5,362 |
21 |
22 |
| Software licenses |
591 |
10 |
601 |
743 |
–20 |
–19 |
| Software support |
5,778 |
54 |
5,832 |
5,900 |
–2 |
–1 |
| Software licenses and support |
6,369 |
64 |
6,433 |
6,643 |
–4 |
–3 |
| Cloud and software |
12,863 |
103 |
12,965 |
12,005 |
7 |
8 |
| Services |
2,132 |
15 |
2,147 |
1,974 |
8 |
9 |
| Total revenue |
14,995 |
117 |
15,112 |
13,980 |
7 |
8 |
1 Constant
currency period-over-period changes are calculated by comparing the current year's non-IFRS constant currency numbers with the IFRS numbers
of the previous year's respective period.
Due to rounding, numbers may not add up precisely.
| (E.5) | Reconciliation
of Non-IFRS Operating Expenses – Year-to-Date |
| € millions, unless otherwise stated |
Q1–Q2 2023 |
Q1–Q2 2022 |
∆ in % |
| IFRS |
Adj. |
Non-IFRS |
Currency
Impact |
Non-IFRS
Constant
Currency |
IFRS |
Adj. |
Non-IFRS |
IFRS |
Non-IFRS |
Non-IFRS
Constant
Currency1 |
| Operating Expense Numbers |
|
|
|
|
|
|
|
|
|
|
|
| Cost of cloud |
–1,897 |
68 |
–1,829 |
|
|
–1,650 |
46 |
–1,604 |
15 |
14 |
|
| Cost of software licenses and support |
–687 |
42 |
–645 |
|
|
–686 |
36 |
–650 |
0 |
–1 |
|
| Cost of cloud and software |
–2,584 |
110 |
–2,474 |
|
|
–2,336 |
82 |
–2,254 |
11 |
10 |
|
| Cost of services |
–1,718 |
199 |
–1,519 |
|
|
–1,516 |
97 |
–1,420 |
13 |
7 |
|
| Total cost of revenue |
–4,301 |
309 |
–3,992 |
|
|
–3,852 |
179 |
–3,674 |
12 |
9 |
|
| Gross profit |
10,693 |
309 |
11,002 |
|
|
10,127 |
179 |
10,306 |
6 |
7 |
|
| Research and development |
–3,138 |
374 |
–2,764 |
|
|
–2,910 |
167 |
–2,743 |
8 |
1 |
|
| Sales and marketing |
–4,457 |
734 |
–3,723 |
|
|
–3,842 |
310 |
–3,532 |
16 |
5 |
|
| General and administration |
–670 |
97 |
–573 |
|
|
–610 |
49 |
–561 |
10 |
2 |
|
| Restructuring |
–257 |
257 |
0 |
|
|
–119 |
119 |
0 |
>100 |
NA |
|
| Other operating income/expense, net |
–10 |
0 |
–10 |
|
|
–115 |
0 |
–115 |
–91 |
–91 |
|
| Total operating expenses |
–12,834 |
1,772 |
–11,062 |
–20 |
–11,083 |
–11,449 |
823 |
–10,626 |
12 |
4 |
4 |
1 Constant
currency period-over-period changes are calculated by comparing the current year's non-IFRS constant currency numbers with the non-IFRS
numbers of the previous year's respective period.
Due to rounding, numbers may not add up precisely.
| (E.6) | Reconciliation
of Non-IFRS Profit Figures, Income Tax, and Key Ratios – Year-to-Date |
| € millions, unless otherwise stated |
Q1–Q2 2023 |
Q1–Q2 2022 |
∆ in % |
| IFRS |
Adj. |
Non-IFRS |
Currency
Impact |
Non-IFRS
Constant
Currency |
IFRS |
Adj. |
Non-IFRS |
IFRS |
Non-IFRS |
Non-IFRS
Constant
Currency1 |
| Profit Numbers |
|
|
|
|
|
|
|
|
|
|
|
| Operating profit (loss) |
2,161 |
1,772 |
3,933 |
97 |
4,029 |
2,531 |
823 |
3,354 |
–15 |
17 |
20 |
| Profit (loss) before tax from continuing operations |
1,771 |
1,772 |
3,543 |
|
|
2,295 |
823 |
3,119 |
–23 |
14 |
|
| Income tax expense |
–643 |
–397 |
–1,040 |
|
|
–666 |
–183 |
–850 |
–3 |
22 |
|
| Profit (loss) after tax from continuing operations |
1,128 |
1,375 |
2,502 |
|
|
1,629 |
640 |
2,269 |
–31 |
10 |
|
| Attributable to owners of parent |
1,135 |
1,373 |
2,508 |
|
|
1,657 |
638 |
2,295 |
–31 |
9 |
|
| Attributable to non-controlling interests |
–7 |
2 |
–5 |
|
|
–28 |
2 |
–26 |
–74 |
–80 |
|
| Profit (loss) after tax3 |
3,890 |
1,156 |
5,047 |
|
|
835 |
1,424 |
2,259 |
>100 |
>100 |
|
| Attributable to owners of parent3 |
3,933 |
1,220 |
5,153 |
|
|
1,074 |
1,232 |
2,306 |
>100 |
>100 |
|
| Attributable to non-controlling interests3 |
–43 |
–64 |
–107 |
|
|
–239 |
192 |
–47 |
–82 |
>100 |
|
| |
|
|
|
|
|
|
|
|
|
|
|
| Key Ratios |
|
|
|
|
|
|
|
|
|
|
|
| Operating margin (in %) |
14.4 |
|
26.2 |
|
26.7 |
18.1 |
|
24.0 |
–3.7pp |
2.2pp |
2.7pp |
| Effective tax rate (in %)2 |
36.3 |
|
29.4 |
|
|
29.0 |
|
27.2 |
7.3pp |
2.1pp |
|
| Earnings per share, basic (in €) from continuing operations |
0.97 |
|
2.15 |
|
|
1.41 |
|
1.96 |
–31 |
10 |
|
| Earnings per share, basic (in €)3 |
3.37 |
|
4.41 |
|
|
0.92 |
|
1.96 |
>100 |
>100 |
|
1 Constant
currency period-over-period changes are calculated by comparing the current year's non-IFRS constant currency numbers with the non-IFRS
numbers of the previous year's respective period.
2 The difference
between our effective tax rate (IFRS) and effective tax rate (non-IFRS) in the first half of 2023 mainly resulted from tax effects of
share-based payment expenses and restructuring expenses. The difference between our effective tax rate (IFRS) and effective tax rate (non-IFRS)
in the first half of 2022 mainly resulted from tax effects of share-based payment expenses and acquisition-related charges.
3 From continuing and discontinued operations
Due to rounding, numbers may not add up precisely.
| (F) | Non-IFRS Adjustments
– Actuals and Estimates |
| € millions |
Estimated Amounts
for
Full Year 2023 |
Q1–Q2
2023 |
Q2 2023 |
Q1–Q2
2022 |
Q2 2022 |
| Operating profit (loss) (IFRS) |
|
2,161 |
1,358 |
2,531 |
1,060 |
| Adjustment for acquisition-related charges |
300–380 |
177 |
89 |
191 |
95 |
| Adjustment for share-based payment expenses |
1,850–2,250 |
1,167 |
614 |
513 |
394 |
| Adjustment for restructuring |
250–300 |
257 |
–3 |
119 |
130 |
| Adjustment for regulatory compliance matter expenses |
170 |
170 |
- |
- |
- |
| Operating expense adjustments |
|
1,772 |
700 |
823 |
618 |
| Operating profit (loss) (non-IFRS) |
|
3,933 |
2,058 |
3,354 |
1,678 |
Due to rounding, numbers may not add up precisely.
| (G) | Non-IFRS Adjustments
by Functional Areas |
| € millions |
Q2 2023 |
Q2 2022 |
| IFRS |
Acquisition
-Related |
SBP1 |
Restruc-
turing |
RCM2 |
Non-
IFRS |
IFRS |
Acquisition-
Related |
SBP1 |
Restruc-
turing |
RCM2 |
Non-
IFRS |
| Cost of cloud |
–959 |
11 |
27 |
0 |
0 |
–920 |
–833 |
13 |
14 |
0 |
- |
–806 |
| Cost of software licenses and support |
–324 |
11 |
11 |
0 |
0 |
–302 |
–339 |
8 |
14 |
0 |
- |
–316 |
| Cost of services |
–863 |
0 |
107 |
0 |
0 |
–756 |
–795 |
0 |
68 |
0 |
- |
–726 |
| Research and development |
–1,565 |
2 |
202 |
0 |
0 |
–1,361 |
–1,514 |
3 |
119 |
0 |
- |
–1,393 |
| Sales and marketing |
–2,165 |
64 |
232 |
0 |
0 |
–1,869 |
–2,100 |
70 |
139 |
0 |
- |
–1,891 |
| General and administration |
–322 |
0 |
36 |
0 |
0 |
–285 |
–341 |
1 |
39 |
0 |
- |
–301 |
| Restructuring |
3 |
0 |
0 |
–3 |
0 |
0 |
–130 |
0 |
0 |
130 |
- |
0 |
| Other operating income/expense, net |
–3 |
0 |
0 |
0 |
0 |
–3 |
–95 |
0 |
0 |
0 |
- |
–95 |
| Total operating expenses |
–6,196 |
89 |
614 |
–3 |
0 |
–5,496 |
–6,147 |
95 |
394 |
130 |
- |
–5,529 |
1 Share-based
Payments
2 Regulatory
Compliance Matters
Due to rounding, numbers may not add up precisely.
| € millions |
Q1–Q2 2023 |
Q1–Q2 2022 |
| IFRS |
Acqui-
sition-
Related |
SBP1 |
Restruc-
turing |
RCM2 |
Non-IFRS |
IFRS |
Acqui-
sition-
Related |
SBP1 |
Restruc-
turing |
RCM2 |
Non-
IFRS |
| Cost of cloud |
–1,897 |
21 |
47 |
0 |
0 |
–1,829 |
–1,650 |
27 |
19 |
0 |
- |
–1,604 |
| Cost of software licenses and support |
–687 |
22 |
20 |
0 |
0 |
–645 |
–686 |
15 |
21 |
0 |
- |
–650 |
| Cost of services |
–1,718 |
0 |
198 |
0 |
0 |
–1,519 |
–1,516 |
0 |
96 |
0 |
- |
–1,420 |
| Research and development |
–3,138 |
4 |
371 |
0 |
0 |
–2,764 |
–2,910 |
5 |
162 |
0 |
- |
–2,743 |
| Sales and marketing |
–4,457 |
129 |
435 |
0 |
170 |
–3,723 |
–3,842 |
139 |
171 |
0 |
- |
–3,532 |
| General and administration |
–670 |
1 |
96 |
0 |
0 |
–573 |
–610 |
6 |
43 |
0 |
- |
–561 |
| Restructuring |
–257 |
0 |
0 |
257 |
0 |
0 |
–119 |
0 |
0 |
119 |
- |
0 |
| Other operating income/expense, net |
–10 |
0 |
0 |
0 |
0 |
–10 |
–115 |
0 |
0 |
0 |
- |
–115 |
| Total operating expenses |
–12,834 |
177 |
1,167 |
257 |
170 |
–11,062 |
–11,449 |
191 |
513 |
119 |
- |
–10,626 |
1 Share-based
Payments
2
Regulatory Compliance Matters
Due to rounding, numbers may not
add up precisely.
If not presented in a separate line item in our income statement, the restructuring expenses
would break down as follows:
| € millions |
Q2 2023 |
Q1–Q2 2023 |
Q2 2022 |
Q1–Q2 2022 |
| Cost of cloud |
1 |
6 |
5 |
–12 |
| Cost of software licenses and support |
0 |
11 |
3 |
4 |
| Cost of services |
–1 |
34 |
59 |
61 |
| Research and development |
3 |
40 |
4 |
7 |
| Sales and marketing |
–9 |
150 |
56 |
57 |
| General and administration |
3 |
16 |
2 |
3 |
| Restructuring expenses |
–3 |
257 |
130 |
119 |
Due to rounding, numbers may not add up precisely.
Disaggregations
| (H.1) | Segment Policies and Segment Changes |
SAP has one reportable segment: the Applications, Technology & Services segment.
At the end of the second quarter 2023,
we sold Qualtrics, formerly a reportable segment which derived its revenues mainly from the sale of experience management cloud solutions.
For more information related to the sale of Qualtrics, see Note
(M) in this quarterly statement.
For a more detailed description of SAP’s
segment reporting, see Note (C.1) “Results
of Segments” of our Consolidated Half-Year Financial Statements 2023.
| (H.2) | Segment Reporting – Quarter |
Applications, Technology & Services1
|
€ millions, unless otherwise stated
(non-IFRS) |
Q2 2023 |
Q2 2022 |
∆ in % |
∆ in % |
|
Actual
Currency |
Constant
Currency |
Actual
Currency |
Actual
Currency |
Constant
Currency |
| Cloud – SaaS2 |
2,325 |
2,388 |
1,935 |
20 |
23 |
| Cloud – PaaS3 |
521 |
533 |
366 |
42 |
45 |
| Cloud – IaaS4 |
191 |
195 |
246 |
–23 |
–21 |
| Cloud |
3,037 |
3,116 |
2,548 |
19 |
22 |
| Software licenses |
316 |
325 |
426 |
–26 |
–24 |
| Software support |
2,873 |
2,946 |
2,977 |
–4 |
–1 |
| Software licenses and support |
3,188 |
3,271 |
3,403 |
–6 |
–4 |
| Cloud and software |
6,225 |
6,387 |
5,951 |
5 |
7 |
| Services |
1,046 |
1,073 |
1,004 |
4 |
7 |
| Total segment revenue |
7,269 |
7,457 |
6,953 |
5 |
7 |
| Cost of cloud |
–910 |
–930 |
–802 |
13 |
16 |
| Cost of software licenses and support |
–289 |
–294 |
–328 |
–12 |
–10 |
| Cost of cloud and software |
–1,199 |
–1,223 |
–1,130 |
6 |
8 |
| Cost of services |
–739 |
–759 |
–700 |
6 |
8 |
| Total cost of revenue |
–1,938 |
–1,982 |
–1,830 |
6 |
8 |
| Cloud gross profit – SaaS2 |
1,620 |
1,671 |
1,341 |
21 |
25 |
| Cloud gross profit – PaaS3 |
437 |
447 |
298 |
47 |
50 |
| Cloud gross profit – IaaS4 |
70 |
69 |
107 |
–35 |
–36 |
| Cloud gross profit |
2,127 |
2,186 |
1,745 |
22 |
25 |
| Segment gross profit |
5,331 |
5,475 |
5,123 |
4 |
7 |
| Other segment expenses |
–2,984 |
–3,048 |
–3,201 |
–7 |
–5 |
| Segment profit (loss) |
2,346 |
2,428 |
1,922 |
22 |
26 |
| SAP S/4 HANA5 |
|
|
|
|
|
| SAP S/4HANA Cloud revenue |
823 |
844 |
472 |
74 |
79 |
| SAP S/4HANA Current cloud backlog |
3,717 |
3,850 |
2,258 |
65 |
70 |
| Margins |
|
|
|
|
|
| Segment gross margin (in %) |
73.3 |
73.4 |
73.7 |
–0.3pp |
–0.3pp |
| Segment margin (in %) |
32.3 |
32.6 |
27.6 |
4.6pp |
4.9pp |
1
Segment information for comparative prior periods were restated to conform with the new segment
composition.
2
Software as a service: SaaS comprises all other offerings which are not shown as PaaS and
IaaS.
3
Platform as a service: PaaS primarily includes SAP Business Technology Platform and
SAP Signavio.
4
Infrastructure as a service: A major portion of IaaS comes from SAP HANA Enterprise
Cloud.
5
Mainly derived from Applications, Technology & Services segment.
Due to rounding, numbers may not
add up precisely.
Reconciliation
of Cloud Revenues – Quarter
|
€ millions, unless otherwise stated
(Non-IFRS) |
Q2 2023 |
Q2 2022 |
∆ in % |
Actual
Currency |
Currency
Impact |
Constant
Currency |
Actual
Currency |
Actual
Currency |
Constant
Currency4 |
| Cloud revenue – SaaS1 |
2,604 |
70 |
2,674 |
2,184 |
19 |
22 |
| Cloud revenue – PaaS2 |
521 |
11 |
533 |
366 |
42 |
45 |
| Cloud revenue – IaaS3 |
191 |
4 |
195 |
246 |
–23 |
–21 |
| Cloud revenue |
3,316 |
86 |
3,401 |
2,796 |
19 |
22 |
| Cloud gross profit – SaaS1 |
1,888 |
56 |
1,945 |
1,586 |
19 |
23 |
| Cloud gross profit – PaaS2 |
437 |
9 |
447 |
298 |
47 |
50 |
| Cloud gross profit – IaaS³ |
70 |
–1 |
69 |
107 |
–35 |
–36 |
| Cloud gross profit |
2,395 |
65 |
2,460 |
1,990 |
20 |
24 |
1
Software as a service: SaaS comprises all other offerings which are not shown as PaaS and
IaaS.
2
Platform as a service PaaS primarily includes SAP Business Technology Platform and SAP Signavio.
3
Infrastructure as a service: A major portion of IaaS comes from SAP HANA Enterprise
Cloud.
4
Constant currency period-over-period changes are calculated by comparing the current year's
non-IFRS constant currency numbers with the non-IFRS numbers of the previous year's respective period.
Due to rounding, numbers may not
add up precisely.
| (H.3) | Segment Reporting – Year-to-Date |
Applications, Technology & Services1
|
€ millions, unless otherwise stated
(non-IFRS) |
Q1–Q2 2023 |
Q1–Q2 2022 |
∆ in % |
∆ in % |
|
Actual
Currency |
Constant
Currency |
Actual
Currency |
Actual
Currency |
Constant
Currency |
| Cloud – SaaS2 |
4,546 |
4,575 |
3,717 |
22 |
23 |
| Cloud – PaaS3 |
1,003 |
1,009 |
694 |
45 |
45 |
| Cloud – IaaS4 |
391 |
394 |
475 |
–18 |
–17 |
| Cloud |
5,940 |
5,978 |
4,885 |
22 |
22 |
| Software licenses |
591 |
601 |
743 |
–20 |
–19 |
| Software support |
5,777 |
5,831 |
5,900 |
–2 |
–1 |
| Software licenses and support |
6,369 |
6,432 |
6,643 |
–4 |
–3 |
| Cloud and software |
12,309 |
12,410 |
11,529 |
7 |
8 |
| Services |
2,124 |
2,139 |
1,967 |
8 |
9 |
| Total segment revenue |
14,429 |
14,544 |
13,492 |
7 |
8 |
| Cost of cloud |
–1,806 |
–1,802 |
–1,589 |
14 |
13 |
| Cost of software licenses and support |
–624 |
–624 |
–661 |
–6 |
–5 |
| Cost of cloud and software |
–2,430 |
–2,426 |
–2,249 |
8 |
8 |
| Cost of services |
–1,492 |
–1,503 |
–1,380 |
8 |
9 |
| Total cost of revenue |
–3,922 |
–3,929 |
–3,629 |
8 |
8 |
| Cloud gross profit – SaaS2 |
3,144 |
3,176 |
2,561 |
23 |
24 |
| Cloud gross profit – PaaS3 |
843 |
850 |
562 |
50 |
51 |
| Cloud gross profit – IaaS4 |
146 |
149 |
174 |
–16 |
–14 |
| Cloud gross profit |
4,134 |
4,176 |
3,297 |
25 |
27 |
| Segment gross profit |
10,507 |
10,615 |
9,863 |
7 |
8 |
| Other segment expenses |
–6,042 |
–6,072 |
–6,054 |
0 |
0 |
| Segment profit (loss) |
4,465 |
4,543 |
3,809 |
17 |
19 |
| SAP S/4 HANA5 |
|
|
|
|
|
| SAP S/4HANA Cloud revenue |
1,539 |
1,552 |
876 |
76 |
77 |
| SAP S/4HANA Current cloud backlog |
3,717 |
3,850 |
2,258 |
65 |
70 |
| Margins |
|
|
|
|
|
| Segment gross margin (in %) |
72.8 |
73.0 |
73.1 |
–0.3pp |
–0.1pp |
| Segment margin (in %) |
30.9 |
31.2 |
28.2 |
2.7pp |
3.0pp |
Due to rounding, numbers may not
add up precisely.
1
Segment information for comparative prior periods were restated to conform with the new segment
composition.
2
Software as a service: SaaS comprises all other offerings which are not shown as PaaS and
IaaS.
3
Platform as a service: PaaS primarily includes SAP Business Technology Platform and
SAP Signavio.
4
Infrastructure as a service: A major portion of IaaS comes from SAP HANA Enterprise
Cloud.
5
Mainly derived from Applications, Technology & Services segment.
Reconciliation of Cloud Revenues and Gross Profit – Year-to-Date
|
€ millions, unless otherwise stated
(non-IFRS) |
Q1–Q2 2023 |
Q1–Q2 2022 |
∆ in % |
Actual
Currency |
Currency
Impact |
Constant
Currency |
Actual
Currency |
Actual
Currency |
Constant
Currency4 |
| Cloud revenue – SaaS1 |
5,099 |
30 |
5,130 |
4,193 |
22 |
22 |
| Cloud revenue – PaaS2 |
1,003 |
6 |
1,009 |
694 |
45 |
45 |
| Cloud revenue – IaaS3 |
391 |
3 |
394 |
475 |
–18 |
–17 |
| Cloud revenue |
6,493 |
39 |
6,532 |
5,362 |
21 |
22 |
| Cloud gross profit – SaaS1 |
3,675 |
34 |
3,709 |
3,021 |
22 |
23 |
| Cloud gross profit – PaaS2 |
843 |
7 |
850 |
562 |
50 |
51 |
| Cloud
gross profit – IaaS3 |
146 |
3 |
149 |
174 |
–16 |
–14 |
| Cloud gross profit |
4,664 |
45 |
4,709 |
3,758 |
24 |
25 |
1
Software as a service: SaaS comprises all other offerings which are not shown as PaaS and
IaaS.
2
Platform as a service: PaaS primarily includes SAP Business Technology Platform and
SAP Signavio.
3
Infrastructure as a service: A major portion of IaaS comes from SAP HANA Enterprise
Cloud.
4
Constant currency period-over-period changes are calculated by comparing the current year's
non-IFRS constant currency numbers with the non-IFRS numbers of the previous year's respective period.
Due to rounding, numbers may not add up precisely.
| (I) | Revenue by Region
(IFRS and Non-IFRS) |
| (I.1) | Revenue
by Region (IFRS and Non-IFRS) – Quarter |
| € millions |
Q2 2023 |
Q2 2022 |
∆ in % |
| Actual currency |
Currency
Impact |
Constant
Currency |
Actual currency |
Actual
currency |
Constant
Currency1 |
| Cloud Revenue by Region |
|
|
|
| EMEA |
1,267 |
16 |
1,283 |
1,015 |
25 |
26 |
| Americas |
1,622 |
40 |
1,662 |
1,417 |
14 |
17 |
| APJ |
427 |
30 |
457 |
364 |
17 |
25 |
| Cloud revenue |
3,316 |
86 |
3,401 |
2,796 |
19 |
22 |
| Cloud and Software Revenue by Region |
|
|
|
| EMEA |
2,878 |
34 |
2,912 |
2,689 |
7 |
8 |
| Americas |
2,646 |
67 |
2,713 |
2,558 |
3 |
6 |
| APJ |
980 |
68 |
1,048 |
953 |
3 |
10 |
| Cloud and software revenue |
6,505 |
169 |
6,673 |
6,199 |
5 |
8 |
| Total
Revenue by Region |
|
|
|
| Germany |
1,146 |
0 |
1,146 |
1,060 |
8 |
8 |
| Rest of EMEA |
2,200 |
40 |
2,240 |
2,071 |
6 |
8 |
| Total EMEA |
3,346 |
40 |
3,386 |
3,131 |
7 |
8 |
| United States |
2,477 |
55 |
2,532 |
2,388 |
4 |
6 |
| Rest of Americas |
628 |
24 |
652 |
601 |
4 |
8 |
| Total Americas |
3,105 |
79 |
3,184 |
2,990 |
4 |
6 |
| Japan |
313 |
25 |
339 |
296 |
6 |
15 |
| Rest of APJ |
790 |
51 |
841 |
790 |
0 |
7 |
| Total APJ |
1,103 |
76 |
1,180 |
1,085 |
2 |
9 |
| Total revenue |
7,554 |
196 |
7,750 |
7,207 |
5 |
8 |
1 Constant currency
period-over-period changes are calculated by comparing the current year's constant currency numbers with the actual currency numbers of
the previous year's respective period.
Due to rounding, numbers may not add up precisely.
| (I.2) | Revenue by Region (IFRS and Non-IFRS) – Year-to-Date |
| € millions |
Q1–Q2 2023 |
Q1–Q2 2022 |
∆ in % |
| Actual Currency |
Currency
Impact |
Constant
Currency |
Actual Currency |
Actual Currency |
Constant
Currency1 |
| Cloud
Revenue by Region |
|
|
|
| EMEA |
2,458 |
16 |
2,474 |
1,966 |
25 |
26 |
| Americas |
3,194 |
–19 |
3,176 |
2,695 |
19 |
18 |
| APJ |
841 |
42 |
883 |
701 |
20 |
26 |
| Cloud revenue |
6,493 |
39 |
6,532 |
5,362 |
21 |
22 |
| Cloud and Software Revenue by Region |
|
|
|
| EMEA |
5,660 |
39 |
5,699 |
5,285 |
7 |
8 |
| Americas |
5,283 |
–33 |
5,250 |
4,866 |
9 |
8 |
| APJ |
1,919 |
97 |
2,016 |
1,853 |
4 |
9 |
| Cloud and software revenue |
12,863 |
103 |
12,965 |
12,005 |
7 |
8 |
| Total Revenue by Region |
|
|
|
| Germany |
2,283 |
–1 |
2,282 |
2,114 |
8 |
8 |
| Rest of EMEA |
4,338 |
45 |
4,383 |
4,049 |
7 |
8 |
| Total EMEA |
6,621 |
44 |
6,666 |
6,163 |
7 |
8 |
| United States |
4,974 |
–47 |
4,927 |
4,566 |
9 |
8 |
| Rest of Americas |
1,233 |
9 |
1,242 |
1,136 |
9 |
9 |
| Total Americas |
6,207 |
–38 |
6,169 |
5,702 |
9 |
8 |
| Japan |
616 |
52 |
668 |
602 |
2 |
11 |
| Rest of APJ |
1,550 |
59 |
1,609 |
1,513 |
2 |
6 |
| Total APJ |
2,166 |
111 |
2,277 |
2,115 |
2 |
8 |
| Total revenue |
14,995 |
117 |
15,112 |
13,980 |
7 |
8 |
1 Constant-currency
period-over-period changes are calculated by comparing the current year's non-IFRS constant-currency numbers with the non-IFRS number
of the previous year's respective period.
Due to rounding, numbers may not
add up precisely.
| (J) | Employees by Region
and Functional Areas |
| Full-time equivalents |
6/30/2023 |
6/30/2022 |
| |
EMEA |
Americas |
APJ |
Total |
EMEA |
Americas |
APJ |
Total |
| Cloud and software |
4,010 |
4,083 |
4,000 |
12,093 |
4,497 |
3,979 |
4,403 |
12,879 |
| Services |
7,993 |
5,000 |
5,476 |
18,469 |
8,193 |
5,061 |
5,811 |
19,065 |
| Research and development |
17,910 |
5,872 |
12,318 |
36,100 |
17,075 |
5,730 |
11,379 |
34,185 |
| Sales and marketing |
11,778 |
10,121 |
5,303 |
27,202 |
11,454 |
10,649 |
5,347 |
27,450 |
| General and administration |
3,475 |
1,765 |
1,281 |
6,521 |
3,337 |
1,867 |
1,208 |
6,411 |
| Infrastructure |
2,800 |
1,284 |
859 |
4,943 |
2,774 |
1,350 |
874 |
4,997 |
| SAP Group (6/30) |
47,966 |
28,125 |
29,237 |
105,328 |
47,331 |
28,636 |
29,022 |
104,988 |
| Thereof acquisitions1 |
0 |
0 |
0 |
0 |
173 |
189 |
8 |
370 |
| SAP Group (six months' end average) |
47,917 |
28,127 |
29,337 |
105,380 |
46,834 |
28,650 |
28,991 |
104,475 |
1
Acquisitions closed between January 1 and June 30 of the respective year
Due to rounding numbers may not add
up precisely
Other Disclosures
In the second quarter of 2023, finance income mainly consisted of gains from
disposals and fair value adjustments of equity securities totaling €82 million (Q2/2022: €146 million) and €186 million
in the first half of 2023 (HY1/2022: €463 million), and interest income from loans and receivables, other financial assets (cash,
cash equivalents, and current investments) as well as from derivatives amounting to €103 million in the second quarter of 2023 (Q2/2022:
€39 million) and €190 million in the first half of 2023 (HY1/2022: €65 million).
In the second quarter of 2023, finance costs were primarily impacted by losses
from disposals and fair value adjustments of equity securities amounting to €93 million (Q2/2022: €225 million) and €226
million in the first half of 2023 (HY1/2022: €543 million) and interest expense on financial liabilities including lease liabilities
and negative effects from derivatives amounting to €238 million in the second quarter of 2023 (Q2/2022: €50 million) and €370
million in the first half of 2023 (HY1/2022: €97 million).
| (L) | Updated Cost Allocation
Policy |
Starting January 1, 2023, all activities related to changes in the code of SAP’s
cloud and on-premise solutions are treated as development-related activities. Some of those activities, specifically code corrections,
were previously considered as support-related activities. SAP believes this update aligns SAP’s accounting policy with market standards
and increases comparability to its peers.
In the second quarter 2023, this update of our cost allocation policy resulted
in an increase of the cloud gross profit by approximately €25 million, an increase of the software license and support gross profit
by approximately €60 million, and an increase of our R&D expenses by approximately €85 million.
In the first half of 2023, the update of our cost allocation policy led to an
increase of the cloud gross profit by approximately €50 million, an increase of the software license and support gross profit by
approximately €130 million, and an increase of our R&D expenses by approximately €180 million.
For the full year 2023, the updated cost allocation policy is expected to result
in decreased cost of cloud by approximately €100 million and cost of support by approximately €300
million, while in consequence increased R&D expenses by approximately €400 million.
Had SAP applied this accounting policy in 2022, its cost of cloud, cost of software
licenses and support and R&D expense would have been as follows:
| € millions |
IFRS |
Non-IFRS |
| Q1 2022 |
Q2 2022 |
Q3 2022 |
Q4 2022 |
FY 2022 |
Q1 2022 |
Q2 2022 |
Q3 2022 |
Q4 2022 |
FY 2022 |
| Cost of cloud |
–817 |
–833 |
–902 |
–947 |
–3,499 |
–798 |
–806 |
–873 |
–915 |
–3,391 |
| Cost of software licenses and support |
–347 |
–339 |
–341 |
–358 |
–1,384 |
–334 |
–316 |
–319 |
–334 |
–1,302 |
| Research and development expenses |
–1,396 |
–1,514 |
–1,571 |
–1,598 |
–6,080 |
–1,351 |
–1,393 |
–1,437 |
–1,449 |
–5,629 |
Due to rounding, numbers may not add up precisely.
| (M) | Discontinued Operations |
On March 13, resulting from a process that was initiated on January 26, SAP announced
it had agreed to sell all of its 423 million shares of Qualtrics International Inc. as part of the acquisition of Qualtrics by funds
affiliated with Silver Lake as well as the Canada Pension Plan Investment Board. The sale closed on June 28, 2023, following satisfaction
of customary closing conditions and regulatory approvals. At a purchase price of US$18.15 in cash per share, SAP’s stake was acquired
for approximately US$7.7 billion. At the time Qualtrics was classified as a discontinued operation (following IFRS 5), there was no indication
of an impairment (as the fair value less cost of disposal (calculated based on share prices) significantly exceeded the carrying amount).
SAP will remain a close go-to-market and technology partner for Qualtrics.
SAP’s financial results present Qualtrics as a discontinued operation (given
the qualitative and quantitative significance for SAP), in accordance with IFRS 5 (the comparative figures have been adjusted accordingly).
The Qualtrics disposal group was previously included in the Qualtrics reportable segment.
The pre-tax disposal gain included into discontinued operations (€3.7
billion) was calculated by adjusting the purchase price less cost of disposal (€7.0 billion) for net assets leaving the SAP Group
(-€5.8 billion, mostly goodwill (-€4.0 billion) and other intangible assets (-€1.3 billion)) and the corresponding non-controlling
interests (€2.4 billion) and amounts of other comprehensive income (€0.1 billion). SAP incurred taxes amounting to €0.5
billion in connection with the transaction.
The cash inflow resulting from the purchase price (€7.1 billion)
was offset by cash and cash equivalents of €0.7 billion leaving the SAP group.
SAP continues to provide rental guarantees for certain offices used by Qualtrics.
Qualtrics is obligated to indemnify SAP with respect to the guarantees.
Additional financial information relating to Qualtrics is presented in the following
tables (revenues and expenses are presented after consolidation of transactions between Qualtrics and SAP’s continuing operations):
| € billion, unless otherwise stated |
Q2 2023 |
Q1–Q2 2023 |
Q2 2022 |
Q1–Q2 2022 |
| Consolidated Income Statements |
|
|
|
|
| Cloud revenue |
0.3 |
0.6 |
0.3 |
0.5 |
| Total revenue |
0.4 |
0.7 |
0.3 |
0.6 |
| Cost of cloud |
–0.0 |
–0.1 |
–0.1 |
–0.1 |
| Total cost of revenue |
–0.1 |
–0.2 |
–0.1 |
–0.2 |
| Total operating expenses (including total cost of revenue) |
–0.5 |
–1.2 |
–0.7 |
–1.4 |
| Disposal gain before tax |
3.7 |
3.7 |
0.0 |
0.0 |
| Operating profit |
3.5 |
3.2 |
–0.4 |
–0.8 |
| Profit (loss) before tax |
3.5 |
3.3 |
–0.4 |
–0.8 |
| Income tax expense1 |
–0.9 |
–0.5 |
–0.0 |
0.0 |
| Profit (loss) after tax |
2.7 |
2.8 |
–0.4 |
–0.8 |
| Attributable to owners of parent |
2.7 |
2.8 |
–0.3 |
–0.6 |
| |
|
|
|
|
| Earnings per share, basic (IFRS, in €)2 |
2.33 |
2.40 |
–0.26 |
–0.50 |
| Earnings per share, diluted (IFRS, in €)2 |
2.31 |
2.38 |
–0.26 |
–0.50 |
| Earnings per share, basic (non-IFRS, in €)2 |
2.06 |
2.26 |
0.01 |
0.01 |
| |
|
|
|
|
| Consolidated Statements of Cash Flow |
|
|
|
|
| Net operating cash flow |
0.0 |
0.1 |
0.0 |
–0.0 |
| Net investing cash flow |
6.3 |
6.3 |
–0.0 |
–0.0 |
| Net financing cash flow |
0.0 |
0.0 |
–0.0 |
–0.2 |
1
For 2023, € 0.5 billion is relating to the gain on sale of discontinued operations.
2
For the three months ended June 30, 2023 and 2022, the weighted average number of shares
was 1,169 million (diluted 1,180 million) and 1,171 million (diluted: 1,174 million), respectively (treasury stock excluded).
For the six months ended June 30,
2023 and 2022, the weighted average number of shares was 1,168 million (diluted 1,176 million) and 1,174 million (diluted: 1,174 million),
respectively (treasury stock excluded).
Due to rounding, numbers may not
add up precisely.
| € billion, unless otherwise stated |
Q2 2023 |
Q1–Q2 2023 |
Q2 2022 |
Q1–Q2 2022 |
| Profit (loss) after tax (IFRS) |
2.7 |
2.8 |
–0.4 |
–0.8 |
| Adjustment for acquisition related charges |
–0.8 |
–0.8 |
0.1 |
0.1 |
| Adjustment for share-based payment expenses |
0.2 |
0.4 |
0.3 |
0.7 |
| Adjustment for restructuring expenses |
0.0 |
0.0 |
0 |
0 |
| Adjustment for tax impact of non-IFRS adjustments |
0.2 |
0.2 |
0.0 |
–0.0 |
| Profit (loss) after tax (non-IFRS) |
2.2 |
2.5 |
–0.0 |
–0.0 |
| Attributable to owners of parent |
2.4 |
2.6 |
0.0 |
0.0 |
Due to rounding, numbers may not add up precisely.
Exhibit 99.2
| |
| |
| |
| |
| |
| |
|
SAP Half-Year Report
2023
|
| |
| |
| |
| |
| |
| |
| |
| |
| |
| |
| |
| |
 |
| |

Table of Contents
Introductory Notes
This Half-Year Group Report meets the requirements of German
Accounting Standard No. 16 “Half-yearly Financial Reporting” (GAS 16). We prepared the financial data in the Half-Year
Report section for SAP SE and its subsidiaries in accordance with International Financial Reporting Standards (IFRS). In doing so,
we observed the IFRS both as issued by the International Accounting Standards Board (IASB) and as endorsed by the European Union (EU).
This does not apply to numbers expressly identified as non-IFRS. For additional IFRS and non-IFRS information, see the Supplementary
Financial Information section.
This Half-Year Group Report complies with the legal requirements
in accordance with the German Securities Trading Act (Wertpapierhandelsgesetz, WpHG) for a Half-Year Financial Report, and comprises the
consolidated Half-Year Management Report, condensed consolidated Half-Year Financial Statements, and the responsibility statement in accordance
with the German Securities Trading Act, section 115 (2).
This Half-Year Group Report updates our consolidated Financial
Statements 2022, presents significant events and transactions of the first half of 2023, and updates the forward-looking information
as well as significant non-financial key figures contained in our Management Report 2022. This Half-Year Financial Report only includes
half-year numbers. Our quarterly numbers are available in the Quarterly Statements for the first and second quarter 2023. Both the 2022
consolidated Financial Statements and the 2022 Management Report are part of our Integrated Report 2022, which is available at www.sapintegratedreport.com.
All of the information in this Half-Year Group Report is unaudited.
This means that the information has been subject neither to any audit nor to any review by an independent auditor.
Unless otherwise stated, all figures in this Half-Year Report
are based on SAP Group results from continuing operations. For the results from discontinued operations, see the Notes to the Consolidated
Half-Year Financial Statements, Note (D.1).
Consolidated Half-Year Management
Report
Strategy and Business Model
SAP continues to execute on the strategy and business model
as described in the SAP Integrated Report 2022 to “enable every organization
and every industry to become a network of intelligent, sustainable enterprises.”
Our Product Strategy
SAP’s
suite of applications allows enterprises to manage their resources, spend, employees, and customer relationships. SAP cloud
ERP and SAP Business Technology Platform (SAP BTP)
are keystones of SAP’s product portfolio. SAP BTP is the platform for
SAP, our customers, and our ecosystem. Moreover, with our SAP Business AI portfolio,
we are expanding our existing business artificial intelligence (AI) to include generative AI.
The strategic pillars of SAP’s product strategy and their
corresponding updates for the first half of 2023 are as follows:
Cloud ERP
SAP S/4HANA
provides software capabilities mainly for finance, risk management, project management, procurement, manufacturing, supply chain management,
asset management, and research and development. It also includes platform capabilities such as database (SAP HANA),
data management, and lifecycle/solution management, as well as cloud ERP solutions.
On
February 8, 2023, SAP announced a partnership with Merck KGaA, Germany, to jointly drive sustainable business-practice innovation.
The partnership is expected to further accelerate the migration of Merck KGaA’s operations to the cloud with RISE with SAP,
a core element of which is SAP S/4HANA Cloud.
In
March 2023, we announced GROW with SAP, a new offering
designed to help midmarket customers adopt cloud ERP for more speed, predictability, and continuous innovation. This comprehensive offering
is built on SAP S/4HANA Cloud, public edition and SAP BTP.
On
April 26, 2023, SAP and HP Inc. announced an expansion of its strategic relationship as HP invested in the RISE
with SAP solution to support its focus on driving digital transformation,
portfolio optimization and operational efficiency. The software will provide a platform for combining hardware, software, and services
to deliver flexible workforce solutions.
SAP Business Technology Platform
SAP BTP is a unified, business-centric, and open platform
that enables customers and partners to build, integrate, and extend applications while gaining insights from business data in a cloud-native
way. SAP BTP aims to bring together capabilities across application development, automation, data and analytics (including planning),
integration, and AI into one platform.
At
the SAP Data Unleashed event held on March 8, 2023, SAP launched SAP Datasphere –
an evolution of our SAP Data Warehouse Cloud solution that integrates key capabilities from SAP Data Intelligence
Cloud. SAP Datasphere aims to provide a unified experience for data integration,
data cataloging, semantic modeling, data warehousing, data federation, and data visualization.
SAP also announced strategic partnerships with data and AI
companies – Databricks, Collibra, Confluent, and DataRobot – to enrich SAP Datasphere and allow organizations to create
a unified data architecture that securely combines SAP software data and non-SAP data.
In May 2023, SAP and Google Cloud announced an extensive
expansion of their partnership through a comprehensive open-data offering. The offering aims to enable customers to build an end-to-end
data cloud that brings data from across the enterprise landscape using the SAP Datasphere solution together with Google’s data
cloud. SAP has also published reference architectures on how to use Generative AI in combination with SAP BTP.
SAP Business AI
SAP Business AI solutions are built into systems that
power the most critical business processes, trained using extensive industry-specific data and deep process knowledge, and created using
responsible and ethical AI practices (see also the Business Conduct section). In addition,
SAP provides a generative AI layer to SAP BTP to best facilitate the integration of generative AI functionalities across the portfolio.
SAP also aims to enable its partner ecosystem to build generative AI-infused innovations based on SAP BTP as well.
At
SAP Sapphire 2023, we announced a lineup of AI and generative AI capabilities that span across our solution portfolio. These are
examples of what has been released: intelligent collections in SAP S/4HANA, intelligent slotting in SAP Extended Warehouse
Management, line item matching in SAP Central Invoice Management,
and SAP Intelligent Product Recommendation.
On May 2, 2023, SAP and IBM announced that IBM Watson
technology will be embedded into SAP solutions to provide new AI-driven insights and automation to help accelerate innovation and create
more efficient and effective user experiences across the SAP application portfolio.
On
May 15, 2023, SAP announced the next step to its partnership with Microsoft – integrating SAP SuccessFactors
solutions with Microsoft 365 Copilot and Copilot in Viva Learning as well as with
Microsoft’s Azure OpenAI Service to access language models that analyze and generate natural language.
Sustainable Management Solutions
SAP offers sustainability solutions and services that aim to
help customers drive sustainable practices not only inside their organization, but across the entire value chain. At SAP Sapphire
2023, we introduced solutions to enable transactional carbon accounting including the green ledger – a capability that connects
carbon accounting data with financial data to better track and measure climate action initiatives. The green ledger will be embedded into
SAP S/4HANA Cloud, with additional capabilities planned in new releases and will be available with RISE with SAP and GROW with SAP.
Additional
capabilities for transactional carbon accounting include a June 2023 update to SAP Sustainability Footprint Management.
This solution calculates and manages the full range of corporate, value chain, and product-level greenhouse gas emissions in a single
environment.
Industry Solutions
SAP’s industry cloud solutions provide the opportunity
for SAP and our partners to extend SAP’s core with modular solutions addressing industry-specific functions built on SAP BTP.
Human Capital Management
SAP SuccessFactors solutions for human resources
aim to empower organizations to create an agile and future-ready workforce in a rapidly changing workplace. The portfolio includes core
HR and payroll, talent management, employee experience management, and people and workforce analytics.
Spend Management
Intelligent
spend management solutions from SAP aim to provide a more unified view of a customer’s spending to reduce costs, mitigate risks,
improve collaboration, and make sure every spend decision is aligned with the business strategy. They cover direct and indirect spend,
travel and expense, and external workforce management. SAP Ariba offerings
combine industry-leading cloud-based applications to help companies discover and collaborate with a global network of partners.
Business Network
SAP Business Network is a cloud-based collaboration
offering designed to enable companies to collaborate with trading partners for greater supply chain visibility.
In
May 2023, we introduced SAP Business Network for Industry to
address the unique needs of various industries. SAP Business Network for Industry will have an initial focus on consumer products,
life sciences, high tech, and industrial manufacturing industries.
Business Process Management
Our
business process transformation solutions are designed to help our customers scan their operations to understand and improve their business
process landscape. The portfolio includes SAP Signavio solutions
and SAP Build Process Automation.
In
February 2023, we announced SAP Signavio Process Explorer,
a solution designed to accelerate transformation projects by providing customers with access to best practice templates and industry standard
processes derived from SAP’s five decades of experience. At SAP Sapphire 2023, we announced the availability of the new
‘plug and gain’ approach which aims to shorten SAP S/4HANA migration project preparation times from months to hours,
reduce time to deploy, and simplify ongoing process optimization. We also announced new integrations for SAP Signavio Process
Transformation Suite with SAP Ariba solutions, the SAP Cloud
ALM tool, and SAP Build Process Automation.
Customer Relationship Management and Customer Experience
The
SAP Customer Experience (SAP CX) portfolio aims to deliver
a personalized view across customers and business partners, connecting the front and back office with solutions spanning from point-of-sale
to manufacturing, logistics, customer experience, and returns management. SAP Business AI functionality in our SAP CX portfolio aims
to help increase conversion rates and overall operational efficiency for sales, commerce, marketing, and services teams.
Partners and Ecosystem
SAP’s ecosystem consists of more than 20,000 partners
worldwide in more than 140 countries. Partners can choose from a variety of SAP solutions to create their own unique SAP-qualified
partner-packaged solution to provide small and midsize enterprises with fixed-scope packaged solutions. SAP expects the share of ecosystem-assisted
cloud revenue to exceed 50% in the future.
In
May 2023, new partner software certification scenarios through SAP Integration and Certification Center (SAP ICC)
to support the clean core initiative were announced at SAP Sapphire 2023. A clean core means the core system is not modified
or customized and can easily be upgraded in the cloud.
Services and Support
At
SAP Sapphire 2023, we announced new editions of our SAP Preferred Success plan.
These editions are designed to deliver expanded capabilities for specific groups of SAP solutions and provide a personalized partnership
for the lifetime of a customer's cloud solution. The new editions include SAP Preferred Success for SAP Commerce Cloud,
expanded edition; SAP Preferred Success for HXM solutions from
SAP, expanded edition; and SAP Preferred Success for SAP Business
Technology Platform, expanded edition.
Business Conduct
In accordance with our Global
AI Ethics Policy, we continue to integrate AI into our solutions and evolve our software development process. We put this policy
into place to help ensure that our AI systems and solutions are developed, deployed, and sold in line with the ethical standards laid
out in our guiding principles. The policy also complements existing guiding principles regarding AI and will ensure that the use of AI
at SAP is governed by clearly defined rules of ethics.
Our Investments in Innovation
Investment in R&D
SAP’s strong commitment to R&D is reflected in our
expenditures (see the graphic below).
Research
& Development (IFRS)
€ millions | change since previous half year

Due to the updated cost allocation policy described in Note (G.5),
R&D figures for 2019 and 2020 have not been adjusted.
Figures for 2019 and 2020 are based on continuing and discontinued
operations.
Therefore, they are only comparable to a limited extent.
In the first half of 2023, our IFRS R&D ratio, reflecting
R&D expenses as a portion of total revenue, remained constant at 21% year over year. Our non-IFRS R&D ratio decreased two percentage
points (pp) to 18% (first half of 2022: 20%). At the end of the first half of 2023, our total full-time equivalent (FTE) headcount
in development was 36,100 (first half of 2022: 34,185). Measured in FTEs, our R&D headcount was 34% of total headcount (first
half of 2022: 33%).
Competitive Intangibles
Some of the resources that are the basis for our current as
well as future success, such as our ability to innovate, software we developed ourselves, customer capital, our employees and their knowledge
and skills, our ecosystem of partners, and the brands we have built up, do not appear in the Consolidated Statements of Financial Position.
This is apparent from a comparison of the market capitalization of SAP SE with the carrying amount of our equity. With a market capitalization
of €153.7 billion at the end of the first half of 2023, the market value of our equity (based on all issued shares) is more
than three times higher than its carrying amount.
Acquisitions and Divestitures
On June 28, 2023, SAP announced that Silver Lake Management
and its co-investors along with the Canada Pension Plan Investment Board (CPPIB) had completed the acquisition of all the issued and
outstanding shares of Qualtrics International Inc. (“Qualtrics”), including all shares owned by SAP, at a purchase price
of US$18.15 in cash per share. The process was initiated on January 26 followed by an announcement on March 13 that SAP had
agreed to sell all of its shares of Qualtrics. For more information, see the Notes to the Consolidated Half-Year Financial Statements,
Note (D.1).
On July 11, Sapphire Ventures announced that it is deepening
its commitment to AI by investing more than US$1 billion in AI-powered enterprise technology startups, including those specializing
in generative AI. The commitment builds on Sapphire Ventures’ history of investing in and scaling enterprise AI startups, and will
focus on all areas of the emerging AI tech stack including foundation models, enablers and middleware, and next-gen AI applications.
On July 18, SAP announced the next step in its commitment
to deliver Business AI that is relevant, reliable, and responsible with strategic direct investments in three leading generative AI companies.
The investments in Aleph Alpha, Anthropic and Cohere reinforce SAP’s open ecosystem approach to AI, leveraging the best technology
to embed AI across SAP’s portfolio. They build on a series of AI partnerships and enterprise use cases announced in May and
complement the above-mentioned commitment from Sapphire Ventures.
Performance Management System
Change in Calculation of Customer Net Promoter Score (NPS)
In the first quarter of 2023, SAP adjusted the methodology
used to calculate its Customer NPS. Designed to improve data and better align the sample with SAP’s business priorities, the adjusted
methodology provides for the following exclusions of answered survey questionnaires: partially completed responses, respondents who self-report
that they have no influence in purchasing decisions, and a restriction in the number of eligible responses from Concur customers to ensure
a proportional and reasonable reflection based on revenue share.
For more information about the calculation of the Customer
NPS, see the Performance Management System section in our Management Report 2022.
Change in Non-IFRS Expense Measures
In the first quarter of 2023, we changed our non-IFRS expense
measures. Going forward, we adjust our IFRS expense measures by excluding expenses for regulatory compliance matters associated with the
provision for (potential) penalties and legal costs arising from certain ongoing governmental investigations into our business operations,
which are described in our Notes to the Consolidated Financial Statements 2022, Note (G.3)
under “Anti-Bribery Matters” and are limited to the scope of IAS 37.
The adjustment of our non-IFRS definition for our expense measures
also impacts our operating profit (non-IFRS), profit before tax (non-IFRS), profit after tax (non-IFRS), and our non-IFRS key ratios such
as operating margin, effective tax rate, and earnings per share, basic.
SAP believes that the changed non-IFRS definition for our expense
measures is useful for investors, as the non-IFRS measures provide additional information that enables a comparison of year-over-year
operating performance by eliminating the effects of regulatory compliance matters. Without being analyzed in conjunction with the corresponding
IFRS measures, the non-IFRS measures based on the changed non-IFRS definition, besides other reasons, are not indicative of our present
and future performance, as expenses ascribed to the regulatory compliance matters may include penalties and legal costs, all of which
would impact the operating cash flows of the business. The exclusion of expenses associated with regulatory compliance matters does not
affect Executive Board members’ compensation, i.e., those expenses measures are fully considered.
For more information, such as the explanation, the usefulness,
and the limitations of non-IFRS measures, see the Performance Management System section in
our Management Report 2022.
Financial Performance: Review and Analysis
Economy and the Market
Global Economic Trends
The global economy started stronger this year than in the fourth
quarter of 2022, mainly driven by the services sector, states the European Central Bank (ECB) in its most recent Economic Bulletin1.
This vigor was due to the reopening of the Chinese economy and the resilience of labor markets in the United States. Nevertheless, high
inflation, tightening financial conditions, and geopolitical tensions were headwinds to global growth.
In the EMEA region, according to the ECB, the euro area economy
stagnated in the first half of 2023 due to a drop in private and public consumption despite lower energy prices, the easing of supply
bottlenecks, a strong labor market, and a supportive fiscal policy. However, conditions in different sectors of the economy were uneven:
manufacturing weakened, yet services proved resilient.
The Americas region showed tighter financial and credit conditions,
but labor markets were resilient particularly in the United States. Overall, real GDP decelerated in the first half of this year, finds
the ECB.
As for the APJ region, the consumption-led recovery in demand
in China turned out stronger in the first quarter than the ECB had previously expected, as pandemic-related disruptions proved short-lived.
However, the recovery faded in the second quarter and did not spill over from services to manufacturing. In Japan, real GDP grew in the
first quarter of 2023, reflecting reopening dynamics.
The IT Market
“The digital world is here and with it comes a new wave
of enterprise application spending poised to create differentiating value for organizations of all sizes globally,”2
says International Data Corporation (IDC), a U.S.-based market research firm. “Organizations […] need enterprise applications
as they invest in their future,” but at the same time, “inflation, recession, and staffing/labor shortages [remain] concerns
for customers’ technology strategies and budgets.”2
According to IDC, while “digital transformation continues
for 49% of organizations, 51% of organizations consider themselves a digital business. For digital businesses, the investment continues;
the emphasis is on using technology to compete and as a competitive advantage; continuously innovating with AI/ML, generative AI, IoT,
and so forth; and relying more on an ecosystem of partners.”2 In this context, “organizations are still shifting
from on-premises systems to hybrid, private, and public cloud.”2
Particularly, “improvements in overall efficiency are
closely linked with IT as the means to facilitate improved energy and enterprise efficiency.”3 IDC states that such “technological
innovations […] will be essential to lower costs and reduce carbon footprints.”3 Currently, “approximately
17% of European businesses are in the more advanced stages of implementing technology solutions to track sustainability-related KPIs.
However, even these businesses are not fully ready to comply with the requirements of the forthcoming Scope 3 disclosures” based
on the European Commission’s Corporate Sustainability Reporting Directive (CSRD).3
1 European Central Bank, Economic Bulletin, Issue
4/2023, Publication Date: June 29, 2023.
2 IDC Market Perspective: June 2023:
Enterprise Application Spending Continues for the Foreseeable Future, Doc #US50665223, May 2023.
3 IDC Vendor Profile: Sustainability Index
for Software Providers: SAP, Doc #EUR147190121, May 2023.
Impact on SAP
SAP had a strong first half of 2023. Despite ongoing
macroeconomic uncertainties and elevated inflation rates, SAP continued to execute on its strategy and showed strong cloud and total
revenue performance across all regions. At Sapphire in May, SAP announced an update of its 2025 financial mid-term ambition. The
update mainly reflects the divestiture of Qualtrics, the anticipation of continuing rapid cloud revenue growth, and a great degree
of resilience in SAP’s support business.
The advances in business AI represent a significant opportunity
for SAP. Our SAP Business AI portfolio is expected to provide stronger economic growth, mainly through productivity increases.
In addition, at SAP Sapphire in May, the Company showcased multiple AI use cases and partnerships. With that, SAP continues to broaden
its ecosystem, increase customer value, and strive for leadership in this important market trend.
Performance Against Our Outlook for 2023
In this section, all discussion of the contributions to target
achievement is based either on IFRS or non-IFRS measures. Whether IFRS or non-IFRS measures are discussed is either explicitly stated
in the header of the respective subsection, or the numbers are individually identified as either IFRS or non-IFRS measures.
We present, discuss, and explain the reconciliation of IFRS
measures to non-IFRS measures in the Supplementary Financial Information section.
Outlook for 2023 (Non-IFRS)
For our outlook based on non-IFRS numbers, see the Financial
Targets and Prospects section in this consolidated Half-Year Management Report.
Key Figures – SAP Group in the First Half of 2023 (IFRS and
Non-IFRS)
| |
IFRS |
Non-IFRS |
| € millions, unless otherwise stated |
Q1–Q2
2023 |
Q1–Q2
2022 |
∆ in % |
Q1–Q2
2023 |
Q1–Q2
2022 |
∆ in % |
∆ in % (constant
currency) |
| Current Cloud Backlog |
NA |
NA |
NA |
11,537 |
9,543 |
21 |
25 |
| Cloud |
6,493 |
5,362 |
21 |
6,493 |
5,362 |
21 |
22 |
| Software licenses |
591 |
743 |
–20 |
591 |
743 |
–20 |
–19 |
| Software support |
5,778 |
5,900 |
–2 |
5,778 |
5,900 |
–2 |
–1 |
| Cloud and software |
12,863 |
12,005 |
7 |
12,863 |
12,005 |
7 |
8 |
| Total revenue |
14,995 |
13,980 |
7 |
14,995 |
13,980 |
7 |
8 |
| Operating expenses |
–12,834 |
–11,449 |
12 |
–11,062 |
–10,626 |
4 |
4 |
| Operating profit |
2,161 |
2,531 |
–15 |
3,933 |
3,354 |
17 |
20 |
| Operating margin (in %) |
14.4 |
18.1 |
–3.7pp |
26.2 |
24.0 |
2.2pp |
2.7pp |
| Profit after tax |
3,890 |
835 |
>100 |
5,047 |
2,259 |
>100 |
NA |
| Profit (loss) after tax from continuing operations |
1,128 |
1,629 |
–31 |
2,502 |
2,269 |
10 |
NA |
| Effective tax rate (in %) |
36.3 |
29.0 |
7.3pp |
29.4 |
27.2 |
2.1pp |
NA |
| Earnings per share, basic (in €) |
3.37 |
0.92 |
>100 |
4.41 |
1.96 |
>100 |
NA |
| Earnings per share, basic (in €) from continuing operations |
0.97 |
1.41 |
–31 |
2.15 |
1.96 |
10 |
NA |
Operating Performance (IFRS and Non-IFRS)
Cloud and software revenue (IFRS) was €12,863 million
(first half of 2022: €12,005 million), an increase of 7%. On a constant currency basis (non-IFRS), the increase was 8%.
This increase was mainly driven by cloud revenue growth of 21%. Software licenses revenue (IFRS) decreased 20% (19% at constant currencies,
non-IFRS) as more customers selected SAP’s cloud offerings such as RISE with SAP. Software support revenue (IFRS) was €5,778 million
(first half of 2022: €5,900 million), a decrease of 2% (1% at constant currencies, non-IFRS).
Our operating expenses (IFRS) increased 12% to €12,834 million
(first half of 2022: €11,449 million), primarily from share-based payment expenses and restructuring expenses. Operating
expenses (non-IFRS) increased 4% to €11,062 million (first half of 2022: €10,626 million) in line with revenue
growth.
Share-based payment expenses increased to €1,167 million
(first half of 2022: €513 million), mainly due to an increase in the SAP share price of around €30 in the first half of 2023
(first half of 2022: drop
in the SAP share price of around €40). For more information about share-based payment expenses, see the
Notes to the Consolidated Half-Year Financial Statements, Note (B.3).
Most of the restructuring expenses, which increased to €257 million
(first half of 2022: €119 million), relate to the targeted restructuring program in selected areas of the company that
SAP announced and launched in the first quarter to further focus on its strategic growth areas and accelerated cloud transformation. The
vast majority of projected expenses has already been recognized in the first half of 2023. For more information about restructuring, see
the Notes to the Consolidated Half-Year Financial Statements, Note (B.4).
Compared with the same period in the previous year, our operating
profit (IFRS) decreased €370 million to €2,161 million (first half of 2022: €2,531 million), a decrease
of 15%.
The described effects also apply to our non-IFRS operating
profit and non-IFRS operating margin, except for the restructuring expenses and share-based payments.
Profit After Tax and Earnings per Share (IFRS)
Profit after tax from continuing operations (IFRS) was €1,128 million
(first half of 2022: €1,629 million), a decrease of over 31% compared to the same period in 2022. Basic earnings per share
(IFRS) was €0.97 (first half of 2022: €1.41), a decrease of 31%. The change in profit after tax from continuing operations
(IFRS) and basic earnings per share from continuing operations (IFRS) is mainly due to the above-mentioned increase in shared based
compensation expenses and restructuring expenses. Profit after tax from discontinued operations (IFRS) was €2,763 million (first
half of 2022: -€794 million). The change is due to the divesture of Qualtrics and the corresponding disposal gain (IFRS)
amounting to €3.2 billion in the first half of 2023.
The effective tax rate (IFRS) was 36.3% (first half of 2022: 29.0%).
The year-over-year increase mainly resulted from changes in non-deductible expenses and valuation allowances on deferred tax assets.
Profit After Tax and Earnings per Share (Non-IFRS)
Profit after tax from continuing operations (non-IFRS) was
€2,502 million (first half of 2022: €2,269 million), an increase of 10%. Basic earnings per share (non-IFRS)
was €2.15 (first half of 2022: €1.96), an increase of 10%. The change in profit after tax from continuing operations (non-IFRS)
and basic earnings per share from continuing operations (non-IFRS) is mainly due to the above-mentioned increase of cloud revenue and
improvements in cloud margin. Profit after tax from discontinued operations (non-IFRS) was €2,544 million (first half of 2022: -€10 million).
The change is due to the divesture of Qualtrics and the corresponding disposal gain) amounting to €2.6 billion in the first
half of 2023. The effective tax rate (non-IFRS) was 29.4% (first half of 2022: 27.2%). The year-over-year increase mainly resulted
from changes in valuation allowances on deferred tax assets.
Segment Information
At the end of the first half of 2023, SAP had five operating
segments: the Applications, Technology & Services segment, the Business Network segment, the Emarsys segment, the Sustainability
segment, and the Taulia segment. Due to its size, the Applications, Technology & Services segment is a reportable segment whereas
the other operating segments are non-reportable.
At the end of the second quarter of 2023, we sold Qualtrics,
formerly a reportable segment which derived its revenues mainly from the sale of experience management cloud solutions.
For more information about our segment reporting and the changes
in the composition of our segments in the first half of 2023, see the Notes to the Consolidated Half-Year Financial Statements, Notes (C.1)
and (C.2).
Applications, Technology & Services
|
€ millions, unless otherwise stated
(non-IFRS) |
Q1–Q2 2023 |
Q1–Q2 2022 |
∆ in % |
∆ in % |
|
Actual
Currency |
Constant
Currency |
Actual
Currency |
Actual
Currency |
Constant
Currency |
| Cloud revenue – SaaS1 |
4,546 |
4,575 |
3,717 |
22 |
23 |
| Cloud revenue – PaaS2 |
1,003 |
1,009 |
694 |
45 |
45 |
| Cloud revenue – IaaS3 |
391 |
394 |
475 |
–18 |
–17 |
| Cloud revenue |
5,940 |
5,978 |
4,885 |
22 |
22 |
| Cloud gross profit – SaaS1 |
3,144 |
3,176 |
2,561 |
23 |
24 |
| Cloud gross profit – PaaS2 |
843 |
850 |
562 |
50 |
51 |
| Cloud gross profit – IaaS3 |
146 |
149 |
174 |
–16 |
–14 |
| Cloud gross profit |
4,134 |
4,176 |
3,297 |
25 |
27 |
| Segment revenue |
14,429 |
14,544 |
13,492 |
7 |
8 |
| Segment gross margin (in %) |
72.8 |
73.0 |
73.1 |
–0.3pp |
–0.1pp |
| Segment profit (loss) |
4,465 |
4,543 |
3,809 |
17 |
19 |
| Segment margin (in %) |
30.9 |
31.2 |
28.2 |
2.7pp |
3.0pp |
1 Software
as a service: SaaS comprises all other offerings which are not shown as PaaS and IaaS.
2 Platform
as a service: PaaS primarily includes SAP Business Technology Platform and SAP Signavio.
3 Infrastructure
as a service: A major portion of IaaS comes from SAP HANA Enterprise Cloud.
The Applications, Technology & Services segment
recorded an increase in cloud revenue of 22% in the first half of 2023 (22% at constant currencies), supported by SAP Business
Technology Platform as well as SAP S/4HANA, whose cloud revenue mainly occurred in the Applications, Technology &
Services segment, and increased 76% to €1,539 million. At the same time, SAP S/4HANA current cloud backlog grew 65% and
ended the first half of 2023 at €3,717 million. Cost of cloud for the Applications, Technology & Services segment
increased 14% (13% at constant currencies), which overall caused the cloud gross margin to widen 2.1 pp (2.4 pp at constant
currencies) to 69.6%. Thereof, PaaS grew 3.1pp (3.3pp at constant currencies), which resulted in a PaaS cloud gross margin of 84.1%.
The SaaS cloud gross margin grew 0.3pp (0.5pp at constant currencies) and ended the first half of the year at 69.2%. Software
support revenue decreased 2% (1% at constant currencies) compared to the prior year, ending the first half of the year 2023 at
€5,777 million. Software licenses revenue decreased 20% (19% at constant currencies) to €591 million. As such,
the segment achieved a total software licenses and support revenue of €6,369 million. Total segment revenue nevertheless
rose by 7% (8% at constant currencies) and ended the first half of 2023 at €14,429 million.
Overall, the share of more predictable revenue within the Applications,
Technology & Services segment increased 1.3pp from 79.9% in the first half of 2022 to 81.2% in 2023.
Cost of revenue increased 8% (8% at constant currencies) compared
to the prior year, ending the first half of 2023 at €3,922 million. This development was mainly driven by an increase in cost
of cloud.
Segment profit increased 17% (19% at constant currencies) and
ended the first half of 2023 at €4,465 million. The segment margin improved 2.7pp (3.0pp at constant currencies) to 30.9%.
Reconciliation of Cloud Revenues and Gross Profit
|
€ millions, unless otherwise stated
(non-IFRS) |
Q1–Q2 2023 |
Q1–Q2 2022 |
∆ in % |
| Actual Currency |
Currency Impact |
Constant Currency |
Actual
Currency |
Actual
Currency |
Constant Currency4 |
| Cloud revenue – SaaS1 |
5,099 |
30 |
5,130 |
4,193 |
22 |
22 |
| Cloud revenue – PaaS2 |
1,003 |
6 |
1,009 |
694 |
45 |
45 |
| Cloud revenue – IaaS3 |
391 |
3 |
394 |
475 |
–18 |
–17 |
| Cloud revenue |
6,493 |
39 |
6,532 |
5,362 |
21 |
22 |
| Cloud gross profit – SaaS1 |
3,675 |
34 |
3,709 |
3,021 |
22 |
23 |
| Cloud gross profit – PaaS2 |
843 |
7 |
850 |
562 |
50 |
51 |
| Cloud
gross profit – IaaS3 |
146 |
3 |
149 |
174 |
–16 |
–14 |
| Cloud gross profit |
4,664 |
45 |
4,709 |
3,758 |
24 |
25 |
1 Software
as a service: SaaS comprises all other offerings which are not shown as PaaS and IaaS.
2 Platform
as a service: PaaS primarily includes SAP Business Technology Platform and SAP Signavio.
3 Infrastructure
as a service: A major portion of IaaS comes from SAP HANA Enterprise Cloud.
4 Constant
currency period-over-period changes are calculated by comparing the current year’s non-IFRS constant currency numbers with the
non-IFRS numbers of the previous year’s respective period.
Due to rounding, numbers may not add up precisely.
Finances and Assets (IFRS)
Cash Flow
| € millions |
Q1–Q2 2023 |
Q1–Q2 2022 |
∆ |
| Net cash flows from operating activities – continuing operations |
3,160 |
2,766 |
14% |
| Capital expenditure |
–413 |
–408 |
1% |
| Payments of lease liabilities |
–188 |
–209 |
–10% |
| Free cash flow |
2,559 |
2,149 |
19% |
| Free cash flow (as a percentage of total revenue) |
17 |
15 |
2pp |
| Free cash flow (as a percentage of profit after tax) |
227 |
132 |
95pp |
The higher operating cash flow was mainly attributable to lower
share-based payments (€229 million decrease year over year), lower payments for income taxes (€54 million decrease
year over year), as well as lower net interest payments (€47 million decrease year over year).
Group Liquidity
| € millions |
|
2023* |
2022 |
| Net Debt 12/31/2022 (PY: 12/31/2021) |
Free Cash Flow |
–2,070 |
–1,563 |
| Net cash flows from operating activities – continuing operations |
2,559 |
3,160 |
2,766 |
| Capital Expenditure |
–413 |
–408 |
| Lease Payments |
–188 |
–209 |
| Business Combinations |
|
0 |
–664 |
| Dividends |
|
–2,395 |
–2,865 |
| Treasury shares |
|
0 |
–1,000 |
| Net proceeds from Qualtrics sale |
|
6,323 |
0 |
| Other |
|
-237 |
–103 |
| Net Debt 6/30/2023 (PY: 6/30/2022) |
|
4,180 |
–4,046 |
* Net debt as at 12/31/2022 includes continuing and discontinued
operations, net debt as at 6/30/2023 only includes continuing operations.
Liquidity and Financial Position
| € millions |
6/30/2023 |
12/31/2022 |
∆ |
| Financial debt |
–10,146 |
–11,764 |
+1,618 |
| Cash and cash equivalents |
14,142 |
9,008 |
+5,134 |
| Current time deposits and debt securities |
184 |
686 |
–502 |
| Group liquidity |
14,326 |
9,694 |
+4,632 |
| Net debt |
4,180 |
–2,070 |
+6,250 |
| |
|
|
|
| Goodwill |
28,581 |
33,077 |
–4,495 |
| Total assets |
69,719 |
72,159 |
–2,440 |
| Total equity |
42,229 |
42,848 |
–619 |
| Equity ratio (total equity as a percentage of total assets) |
61 |
59 |
+1pp |
In the first half of 2023, we repaid €1,600 million
in Eurobonds. As at June 30, 2023, we had issued €930 million under our Commercial Paper (CP) program with short-term
maturities. The increase in cash and cash equivalents includes a net inflow of 6,265 million from the sale of SAP’s stake in
Qualtrics.
Employees
People are the heart of our organization. SAP works to attract
and keep the best talent by aiming for a highly engaged, diverse, and future-fit workforce equipped with the right skills, all while adapting
to new market trends. For a detailed description of our People Strategy, see the Employees section in our Integrated
Report 2022.
With
our Pledge to Flex working model, we have successfully laid the
foundation for hybrid work at SAP. We have established a new market standard, offering flexibility for our workforce in accordance with
business requirements and local legislation. Looking forward, we will focus on ensuring a mix between working in the office and working
remotely. We have launched our global “I’m In” campaign.
It promotes the value of being in the office on a regular basis as a standard element of effective and productive hybrid work –
based on individual role, team set-up, and business requirements. In taking a holistic approach to hybrid work, we offer managers and
employees a variety of comprehensive enablement assets complemented by further engagement formats on a local level. This approach allows
our employees to thrive, while strengthening our employer attractiveness, productivity, and innovation.
To
compete in our dynamic industry, SAP needs to continuously adapt our skills. We do this by managing skill-based development
for our workforce and ecosystem. SAP is establishing the scalable data foundation
necessary for skill-based learning recommendations. This foundation helps us anticipate and react to market changes, by providing a unified,
industry-standard skills taxonomy. Uniformity across internal and external scenarios that utilize skills taxonomies allows SAP to harness
immense benefits from a shared language. This adds value for partners and customers and enables SAP to become a more adaptive enterprise.
We have made great strides in this regard recently in our Sales, Presales, and Development areas. For example, with the help of an internally
developed tool, our Sales organization identified over 60 key skills, relevant for 75% of quota carriers. They have demonstrated that
quota carriers proficient in key skills related to selling generally have quota attainments 15% higher than those who are not proficient.
SAP also offers a vast library of digital learning content across the SAP solution portfolio via the SAP
Learning Web site, SAP Learning Hub, openSAP, and instructor-led training, so people can build and maintain their SAP software
skills. We reached over 1 million external active learners in 2022 and 700,000 in the first half of 2023.
Diversity
in the workplace means celebrating our differences and acknowledging the unique contributions and perspectives we all bring to the Company.
We aim to increase diversity in our workforce at all levels of SAP to reflect the spectrum of diversity in society, including visible
diversity such as race, ethnicity, gender, and age, as well as invisible diversity such as neurodiversity, gender identity, and socio-economic
background. At SAP, we are committed to fostering equality by achieving our ultimate goal of gender parity at all levels of the organization.
We are making progress with our goals to increase women in the workforce1 and
women in management2. In the first half of 2023,
women comprised 35% of our workforce (first half of 2022: 34.7%; end of 2022: 35%) and hold 29.5% of all management positions at the Company
(first half of 2022: 28.9%; end of 2022: 29.4%). We aim to increase the share of women in management to 30% by the end of 2023. To reach
our ultimate goal of gender parity, we are building a leadership pipeline through our Women to Watch program piloted in the first half
of 2023 with 262 participants. We are also encouraging an inclusive leadership mindset, recognizing and overcoming biases through our
intentional inclusion workshops for leaders. Furthermore, women in management was integrated as one of the ESG (environment, social, governance)
KPIs in a new sustainability-linked revolving credit facility and the long-term incentive compensation of the SAP Executive Board
(effective 2024). For further ESG-related information, see the Energy and Emissions section.
Looking at our people-related KPIs, the Employee Engagement
Index comes in at 80%, a slight increase of 1pp compared to the score of 79% in October 2022, and no change compared to the full-year
score published in our Integrated Report 2022. Just like at the end of 2022, our Leadership Trust Net Promoter Score remains at its
all-time high of 72. And at 81%, the Business Health Culture Index remains as strong as at the end of 2022. At the end of the first half
of 2023, SAP’s Employee Retention
Rate was still high at 96.2% (compared to 95.3% at the
end of the first half of 2022 and 91.4% at the end of 2022). We define retention as the ratio of the average number of employees
minus the number of employees who voluntarily departed, to the average number of employees (in full time equivalents, FTEs). On
June 30, 2023, we had 105,328 FTEs worldwide (June 30, 2022: 104,988;
December 31, 2022: 106,312). For a breakdown of headcount by function and geography, see the Notes to the
Consolidated Half Year Financial Statements, Note (B.1).
1 We define “women in the workforce”
as the share of women in the total workforce.
2 We define “women in management”
as the share of women in management positions as compared to the total number of managers, expressed by the number of individuals and
not FTEs. It includes three categories: 1) Managers managing teams: Refers to managing teams of at least one employee or vacant positions;
2) Managers managing managers: Refers to managing managers who manage teams; 3) Executive Board members.
Energy and Emissions
In the first half of 2023, we maintained our commitment to
help rebuild a more resilient, restorative, and inclusive economy within the planetary boundaries – both as an enabler and exemplar.
We strive towards achieving a world of zero waste, zero emissions, and zero inequality.
To help our customers on this journey, we offer an expanded
portfolio of sustainable business solutions. For more information, see the Our Product Strategy
section in this consolidated Half-Year Management Report.
In Q1 2023, we achieved SAP’s carbon neutrality
target, meaning that our net carbon emissions reached 0 kilotons (kt) of CO2equivalents (CO2e) after decreasing
to 85 kt at year end 2022. In Q2 2023, the emissions remained at 0 kt. This downward trend reflects our strategic three-fold
approach of “avoid-reduce-compensate” where we aim to compensate only for those emissions which cannot yet be avoided. SAP’s
amount of compensated emissions per FTE dropped from about 2 tons of CO2e (2018) to less than 1 ton of CO2e
(2022).
Having
reached our carbon neutrality target, we are now focused on our next goal: becoming net zero along our entire value chain by
2030 in line with a 1.5°C future. In this regard, we aim to apply the
demanding Corporate Net-Zero Standard set by the Science-Based Targets initiative (SBTi).
In March 2023, we incorporated environmental, social,
and governance (ESG) components into a new revolving credit facility for the first time. In line with our sustainable corporate strategy,
we integrated ‘net zero’ alongside ‘women in management’ as components of our new sustainability-linked revolving
credit facility of €3 billion. At the Annual General Meeting of Shareholders in May 2023, the shareholders approved the
inclusion of the same two new ESG KPIs alongside financial metrics in the long-term incentive compensation of the SAP Executive Board
starting 2024.
SAP’s ESG efforts – along with its measures, initiatives,
and targets – have been recognized by renowned sustainability ratings and ranking organizations:
| – | In IDC's report "Sustainability Index for Software Providers”, SAP was placed in the top 3 of 23 assessed software
vendors. |
| – | SAP upholds its prime status (B rating) and remains in the first decile rank of the Institutional Shareholder Services (ISS)
ESG rating based on the July 2023 update. |
| – | SAP’s continuous sustainability leadership is reflected in its “A–” rating in CDP’s climate change assessment.
In March 2023, SAP was again recognized as a CDP Supplier Engagement Leader. |
| – | We ranked 41st in Corporate Knights’ 2023 Global 100 Most Sustainable Corporations in the World. |
Organization and Changes in Management
On March 31, 2023, SAP announced that the Supervisory
Board had extended the contracts of Executive Board members Julia White, Chief Marketing & Solutions Officer, and Scott Russell,
who leads SAP’s Customer Success organization, for three years until 2027.
Furthermore, Sabine Bendiek, Chief People & Operating
Officer and Labor Relations Director, informed the Supervisory Board that she will not renew her contract which expires on December 31, 2023.
Risk Management and Risks
We have comprehensive risk-management structures in place that
are intended to enable us to recognize and analyze risks early on, take the appropriate action, and mitigate any risks that materialize
as presented in the Risk Management and Risks chapter in our Integrated Report 2022 and
our Annual Report on Form 20-F for 2022.
For changes in our Litigation, Claims, and Legal Contingencies
since our last Integrated Report, see the Notes to the Consolidated Half-Year Financial Statements, Note (G.1).
Based on our aggregation approach and taking into consideration
the mitigations implemented for all our risk factors and risks, as at June 30, 2023, we see no material change relative to our
2022 risk assessment or 2022 risk-bearing capacity. We do not believe that any of the risks we identified in our Integrated Report 2022
and Annual Report on Form 20-F for 2022, and as outlined herein, jeopardize our ability to continue as a going concern.
Expected Developments and Opportunities
Future Trends in the Global Economy
The global growth and inflation outlook in the European Central
Bank’s (ECB) current projections1 remains broadly unchanged, but with a small upward revision due to a recovery in demand
in China. However, this outlook remains highly uncertain, with broader geopolitical tensions and renewed financial market tensions as
downside risks and the strong labor market and increasing confidence as upside risks.
The ECB expects inflation to remain high in the EMEA region
at 5.4% in 2023 but to decrease thereafter because of lower commodity prices. The ECB has also lowered its economic growth projections
for the euro area until 2025. However, it still expects economic growth to strengthen in the coming quarters as energy prices moderate,
foreign demand strengthens, supply bottlenecks are resolved, and uncertainty continues to recede.
As for the Americas region, the resilience of labor markets
in the United States is underpinning consumer demand. The ECB projects U.S. economic activity to be driven mainly by the services sector,
whereas manufacturing output could remain relatively subdued. In summary, the ECB expects real GDP in the United States to recover tepidly
in the second half of 2023.
In the APJ region, projects the ECB, recovery in China will
presumably continue but could lose momentum if the rapid recovery of consumer spending after the reopening of the economy does not expand
to manufacturing. In Japan, economic activity is likely to expand at a moderate pace, supported by pent-up demand and ongoing policy support.
Economic Trends
GDP Growth Year Over Year
| |
% |
2022 |
2023p |
2024p |
| |
World |
3.4 |
2.8 |
3.0 |
| |
Advanced Economies |
2.7 |
1.3 |
1.4 |
| |
Emerging Markets and Developing Economies |
4.0 |
3.9 |
4.2 |
| |
Regions (according to IMF taxonomy) |
|
|
|
| |
Euro Area |
3.5 |
0.8 |
1.4 |
| |
Germany |
1.8 |
-0.1 |
1.1 |
| |
Emerging and Developing Europe |
0.8 |
1.2 |
2.5 |
| |
Middle East and Central Asia |
5.3 |
2.9 |
3.5 |
| |
Sub-Saharan Africa |
3.9 |
3.6 |
4.2 |
| |
United States |
2.1 |
1.6 |
1.1 |
| |
Canada |
3.4 |
1.5 |
1.5 |
| |
Latin America and the Caribbean |
4.0 |
1.6 |
2.2 |
| |
Japan |
1.1 |
1.3 |
1.0 |
| |
Emerging and Developing Asia |
4.4 |
5.3 |
5.1 |
| |
China |
3.0 |
5.2 |
4.5 |
| |
p = projection |
|
|
|
| |
Source: International Monetary Fund (IMF), World Economic Outlook April 2023, A Rocky Recovery (https://www.imf.org/-/media/Files/Publications/WEO/2023/April/English/text.ashx), p. 29. |
The IT Market:
Outlook for 2023 and Beyond
“In the digital world, organizations need to continue
their investment in enterprise applications,”2 says International Data Corporation (IDC), a U.S.-based market research firm. It
does not find this “a surprise considering organizations are hyperfocused on the macroeconomic headwinds of inflation, labor shortages,
and the recession.”2
For IDC, “it is clear the digital world is increasing
investments for SaaS software […], as on average, 31% of organizations are planning on replacing their current systems within 12 months,
11% in 12–24 months, and 5% in 24–36 months.”2 However, “the deployment model is critical
to buyers. Some will only move to a hybrid environment, while others are moving quickly to private or public cloud.”2
In particular, “technological innovations that generate
improvements in overall energy efficiencies will be essential to lower costs and reduce carbon footprints.”3 Therefore,
“demand for ESG data consolidation platforms will rise because the future enterprise will increasingly need digitalized and/or automated
business processes, which will lead to a need for data integration platforms. ESG data must be consolidated in a centralized manner and
be available for different types of data/KPI monitoring […]. Organizations that master ESG performance metrics monitoring in a
holistic manner and integrate ESG insights into steering their strategy execution will gain a competitive advantage by moving beyond mere
regulatory compliance to driving business benefits,”3 reports IDC. Particularly “in Europe, pressure is increasing
to provide visibility into ESG KPIs and publicly disclose nonfinancial indicators. The European Commission’s forthcoming Corporate
Sustainability Reporting Directive (CSRD) requires a large amount of specific new qualitative and quantitative information to be disclosed.”3
1 European Central Bank, Economic Bulletin, Issue
4/2023, Publication Date: June 29, 2023.
2 IDC Market Perspective: June 2023:
Enterprise Application Spending Continues for the Foreseeable Future, Doc #US50665223, May 2023.
3 IDC Vendor Profile: Sustainability Index
for Software Providers: SAP, Doc #EUR147190121, May 2023.
Impact on SAP
Looking ahead, SAP’s cloud transformation is expected
to drive further opportunities for our customers. Macroeconomic challenges such as inflation or supply chain disruptions as well as increasing
global regulatory requirements are prompting many customers to reinvent how their businesses run to become more resilient and agile. Therefore,
SAP is executing on its cloud-led strategy, which is driving accelerating cloud growth through both new business and cloud adoption by
existing customers. Our broad solution portfolio, including our modular cloud ERP suite, SAP Business Technology Platform, our industry
cloud, SAP Business Network, and our enhanced sustainability portfolio, helps create value not only for our customers but for our
entire ecosystem. This strategy resonates with customers even in an increasingly challenging environment. As such, SAP is well positioned
to capitalize on an expanding addressable market.
Financial Targets and Prospects (Non-IFRS)
Revenue and Operating Profit Targets and Prospects
In April 2023, SAP revisited its 2023 outlook, confirmed
its performance expectations underlying its January 2023 outlook for continuing operations, and reflected the anticipated divestiture
of Qualtrics. Based hereon, SAP updated its revenue and operating profit outlook in July 2023 and now expects:
| – | €14.0 billion to €14.2 billion in cloud revenue at constant currencies (2022: €11.43 billion),
up 23% to 24% at constant currencies. The previous range as communicated in April 2023 was €14.0 billion to €14.4 billion
at constant currencies, the initial range (including Qualtrics) was €15.3 billion to €15.7 billion at constant currencies. |
| – | €27.0 billion to €27.4 billion in cloud and software revenue at constant currencies (2022: €25.39 billion),
up 6% to 8% at constant currencies. The previous range as communicated in April 2023 was €26.9 billion to €27.4 billion
at constant currencies, the initial range (including Qualtrics) was €28.2 billion to €28.7 billion at constant currencies. |
| – | €8.65 billion to €8.95 billion in non-IFRS operating profit at constant currencies (2022: €7.99 billion),
up 8% to 12% at constant currencies. The previous range as communicated in April 2023 was €8.6 billion to €8.9 billion
at constant currencies, the initial range (including Qualtrics) was €8.8 billion to €9.1 billion at constant currencies. |
SAP continues to expect:
| – | A share of more predictable revenue of approximately 82% (2022: 79%). It is defined as the total of cloud revenue and software
support revenue divided by total revenue. The initial guidance (including Qualtrics) was approximately 83%. |
| – | A full-year effective tax rate (IFRS) of 28.0% to 32.0% (2022: 32.0%) and an effective tax rate (non-IFRS) of 26.0% to 28.0%
(2022: 29.6%). |
Additionally, SAP continues to expect:
| – | Current Cloud Backlog: A year-end growth rate similar to 2022, but at a larger scale |
| – | SAP S/4HANA cloud revenue: continued high growth in 2023 |
| – | Cloud gross margin: a steady increase in the years 2023 through 2025 to allow SAP to achieve its 2025 cloud gross profit ambition |
We continuously strive for profit expansion in all of our operating
segments.
While SAP’s full-year 2023 business outlook is at constant
currencies, actual-currency reported figures are expected to be impacted by currency exchange rate fluctuations as the Company progresses
through the year. For the third-quarter and full-year 2023 expected currency impacts, see the table below:
Expected Currency Impact for the rest of the year based
on June 2023 Level
| |
In percentage points |
Q3 |
FY |
| |
Cloud |
−7pp to −5pp |
−4pp to −2pp |
| |
Cloud and software |
−6pp to −4pp |
−3.5pp to −1.5pp |
| |
Operating profit |
−6.5pp to −4.5pp |
−4.5pp to −2.5pp |
The following table shows the estimates of the items that represent
the differences between our IFRS financial measures and our non-IFRS financial measures:
Non-IFRS Measures
| |
€ millions |
Estimated Amounts for
Full Year 2023 |
Q1–Q2
2023 |
Q1–Q2
2022 |
| |
Acquisition-related charges |
300–380 |
177 |
191 |
| |
Share-based payment expenses |
1,850–2,250 |
1,167 |
513 |
| |
Restructuring |
250–300 |
257 |
119 |
| |
Regulatory compliance matters |
170 |
170 |
- |
Medium-Term Prospects
SAP updated its medium-term ambitions on May 16, 2023.
For 2025, SAP now expects:
| – | Cloud revenue of more than €21.5 billion |
| – | Total revenue of more than €37.5 billion |
| – | Non-IFRS cloud gross profit of approximately €16.3 billion |
| – | Non-IFRS operating profit of approximately €11.5 billion |
| – | A share of more predictable revenue of approximately 86% |
| – | Free cash flow of approximately €7.5 billion |
Building Blocks of the Ambition 2025 Update
| |
|
Original Ambition
2025 (incl.
Qualtrics) |
Estimated Impact
of Qualtrics
Divestiture |
Update for
Continuing
Operations |
Updated
Ambition 2025
(excl. Qualtrics) |
CAGR 2022–
2025e*
(continuing
operations) |
| |
Cloud revenue |
>€22.0bn |
–€2.0bn |
+€1.5bn |
>€21.5bn |
>23% |
| |
Total revenue |
>€36.0bn |
–€2.3bn |
+€3.8bn |
>€37.5bn |
>8% |
| |
Cloud gross profit
(non-IFRS) |
~€17.6bn |
–€1.8bn |
+€0.5bn |
~€16.3bn |
~27% |
| |
Operating profit
(non-IFRS) |
>€11.5bn |
–€0.5bn |
+€0.5bn |
~€11.5bn |
~13% |
*expected
The update demonstrates SAP’s strong cloud momentum and
reflects the divestiture of Qualtrics. The €3.8 billion increase in our 2025 total revenue ambition is driven by an expected
stronger cloud revenue growth, a higher degree of resilience in our support business, and a more favorable 2025 currency environment as
compared to the original ambition published in October 2020.
Furthermore, SAP expects:
| – | Cloud revenue growth to continue to benefit from conversions of support revenue to cloud revenue at average conversion factors of
two to three times |
| – | PaaS revenue to grow at higher rates than SaaS revenue for the foreseeable future |
| – | Total revenue growth to accelerate beyond 2023 towards double-digit growth |
Goals for Liquidity, Finance, and Investments
SAP believes that its liquid assets combined with its undrawn
credit facilities are sufficient to meet its operating financing needs in the second half of 2023 as well, and, together with expected
cash flows from operations, will support debt repayments and its currently planned capital expenditure requirements over the near and
medium term.
In 2023 and compared to 2022, SAP expects an increase in free
cash flow of approximately €4.9 billion due to improvements in profitability and working capital, which are expected to be partially
offset by higher tax payments and payouts for restructuring. Compared to what SAP disclosed in its Integrated Report 2022, SAP adjusted
its expectations for FCF to approximately €4.9 billion in 2023 (formerly approximately €5.0 billion) and approximately
€7.5 billion in 2025 (formerly approximately €8.0 billion).
In addition to the repayment of €1.6 billion in Eurobonds
in the first half of 2023, SAP intends to repay portions or the full amounts of the two fully drawn bilateral bank loans of €1.45 billion
in the third quarter of 2023.
SAP expects the ratio of net debt as at December 31, 2023,
divided by the total of operating profit (IFRS) plus depreciation and amortization, to be negative due to the positive impact of the sales
proceeds of Qualtrics. As such, SAP plans to start the new share repurchase program with a volume of up to €5.0 billion in the
second half of 2023 and complete it in full by the end of 2025.
SAP’s planned investment expenditures for 2023 and 2024,
other than from business combinations, consist primarily of the purchase of IT infrastructure (such as data centers) and the construction
of new buildings. Primarily driven by lower investment expenditures for IT, SAP now expects planned investment expenditures of slightly
below €900 million for 2023, compared to the approximately €950 million disclosed in the Integrated Report 2022.
For 2024, SAP expects capital expenditures to stay at a similar level as in 2023.
Non-Financial Goals 2023 and Ambitions for 2025
In addition to our financial goals, we focus on three non-financial
targets: customer loyalty, employee engagement, and carbon emissions.
In 2023, SAP continues to expect:
| – | A Customer Net Promoter Score of 8 to 12. The guidance is based on an adjusted methodology for 2023 to better reflect the business
priorities of the company. The baseline for 2022, calculated using the new methodology, is 7. |
| – | An Employee Engagement Index to be in a range of 76% to 80% |
| – | Net carbon emissions of 0 kt, meaning the Company will be carbon neutral in its own operations |
For 2025 non-financial performance, SAP now expects to:
| – | Steadily increase the Employee Engagement Index |
In addition, it continues to expect to:
| – | Steadily increase the Customer Net Promoter Score |
| – | Maintain net carbon emissions in our own operations of 0 kt. In addition, SAP is committed to achieving net-zero along our value
chain by 2030. |
21/59
Premises on Which Our Outlook and Prospects Are Based
In preparing our outlook and prospects, we have taken into
account all events known to us at the time we prepared this report that could influence SAP’s business going forward.
Opportunities
We have comprehensive opportunity-management structures in
place that are intended to enable us to recognize and analyze opportunities early and to take the appropriate action. The opportunities
remain largely unchanged compared to what we disclosed in our Integrated Report 2022.
22/59
Consolidated Half-Year
Financial Statements – IFRS
23/59
|  | Consolidated Income Statement of SAP Group (IFRS) –
Half Year |
| € millions, unless otherwise stated |
|
Q1–Q2
2023 |
Q1–Q2
2022 |
∆ in % |
| Cloud |
|
6,493 |
5,362 |
21 |
| Software licenses |
|
591 |
743 |
–20 |
| Software support |
|
5,778 |
5,900 |
–2 |
| Software licenses and support |
|
6,369 |
6,643 |
–4 |
| Cloud and software |
|
12,863 |
12,005 |
7 |
| Services |
|
2,132 |
1,974 |
8 |
| Total revenue |
(A.1), (C.2) |
14,995 |
13,980 |
7 |
| |
|
|
|
|
| Cost of cloud |
|
–1,897 |
–1,650 |
15 |
| Cost of software licenses and support |
|
–687 |
–686 |
0 |
| Cost of cloud and software |
|
–2,584 |
–2,336 |
11 |
| Cost of services |
|
–1,718 |
–1,516 |
13 |
| Total cost of revenue |
|
–4,301 |
–3,852 |
12 |
| Gross profit |
|
10,693 |
10,127 |
6 |
| Research and development |
|
–3,138 |
–2,910 |
8 |
| Sales and marketing |
|
–4,457 |
–3,842 |
16 |
| General and administration |
|
–670 |
–610 |
10 |
| Restructuring |
(B.4) |
–257 |
–119 |
>100 |
| Other operating income/expense, net |
|
–10 |
–115 |
–91 |
| Total operating expenses |
|
–12,834 |
–11,449 |
12 |
| Operating profit (loss) |
|
2,161 |
2,531 |
–15 |
| |
|
|
|
|
| Other non-operating income/expense, net |
|
–103 |
–63 |
64 |
| Finance income |
|
369 |
520 |
–29 |
| Finance costs |
|
–656 |
–692 |
–5 |
| Financial income, net |
(C.3) |
–287 |
–173 |
66 |
| Profit (loss) before tax from continuing operations |
(C.2) |
1,771 |
2,295 |
–23 |
| |
|
|
|
|
| Income tax expense |
|
–643 |
–666 |
–3 |
| Profit (loss) after tax from continuing operations |
|
1,128 |
1,629 |
–31 |
| Attributable to owners of parent |
|
1,135 |
1,657 |
–31 |
| Attributable to non-controlling interests |
|
–7 |
–28 |
–74 |
| Profit (loss) after tax from discontinued operations |
(D.1) |
2,763 |
–794 |
<-100 |
| Profit (loss) after tax2 |
|
3,890 |
835 |
>100 |
| Attributable to owners of parent2 |
|
3,933 |
1,074 |
>100 |
| Attributable to non-controlling interests2 |
|
–43 |
–239 |
–82 |
| |
|
|
|
|
| Earnings per share, basic (in €)1 from continuing operations |
|
0.97 |
1.41 |
–31 |
| Earnings per share, basic (in €)1, 2 |
|
3.37 |
0.92 |
>100 |
| Earnings per share, diluted (in €)1 from continuing operations |
|
0.97 |
1.41 |
–32 |
| Earnings per share, diluted (in €)1, 2 |
|
3.34 |
0.91 |
>100 |
1 For the six months ended June 30, 2023
and 2023, the weighted average number of shares was 1,168 million (diluted: 1,176 million) and 1,174 million (diluted:
1,174 million), respectively (treasury stock excluded).
2 From continuing and discontinued operations
Due to rounding, numbers may not add up precisely.
Consolidated Statements of Comprehensive Income of SAP Group (IFRS)
– Half Year
| € millions |
Q1–Q2 2023 |
Q1–Q2 2022 |
|
Profit after tax |
3,890 |
835 |
| Items that will not be reclassified to profit or loss |
|
|
| Remeasurements on defined benefit pension plans, before tax |
0 |
1 |
| Income taxes relating to remeasurements on defined benefit pension plans |
0 |
–2 |
| Remeasurements on defined benefit pension plans, net of tax |
0 |
–2 |
| Other comprehensive income for items that will not be reclassified to profit or loss, net of tax |
0 |
–2 |
| Items that will be reclassified subsequently to profit or loss |
|
|
| Gains (losses) on exchange differences on translation, before tax |
–755 |
3,513 |
| Reclassification adjustments on exchange differences on translation, before tax |
–129 |
0 |
| Exchange differences, before tax |
–884 |
3,513 |
| Income taxes relating to exchange differences on translation |
8 |
–7 |
| Exchange differences, net of tax |
–876 |
3,505 |
| Gains (losses) on cash flow hedges/cost of hedging, before tax |
45 |
–11 |
| Reclassification adjustments on cash flow hedges/cost of hedging, before tax |
–32 |
46 |
| Cash flow hedges/cost of hedging, before tax |
13 |
35 |
| Income taxes relating to cash flow hedges/cost of hedging |
–4 |
–9 |
| Cash flow hedges/cost of hedging, net of tax |
10 |
26 |
| Other comprehensive income for items that will be reclassified to profit or loss, net of tax |
–866 |
3,531 |
| Other comprehensive income, net of tax |
–866 |
3,530 |
| Total comprehensive income1 |
3,024 |
4,365 |
| Attributable to owners of parent1 |
3,233 |
4,347 |
| Attributable to non-controlling interests1 |
–208 |
18 |
|
1 From
continuing and discontinued operations
Due to rounding, numbers may not add up precisely. |
|  | Consolidated Statement of Financial Position of SAP Group
(IFRS) |
| as at 6/30/2023 and 12/31/2022 |
| € millions |
|
2023 |
20221 |
| Cash and cash equivalents |
|
14,142 |
9,008 |
| Other financial assets |
|
480 |
853 |
| Trade and other receivables |
|
5,594 |
6,236 |
| Other non-financial assets |
(A.2) |
2,371 |
2,139 |
| Tax assets |
|
403 |
287 |
| Total current assets |
|
22,990 |
18,522 |
| Goodwill |
(D.2) |
28,581 |
33,077 |
| Intangible assets |
|
2,259 |
3,835 |
| Property, plant, and equipment |
(D.3) |
4,361 |
4,934 |
| Other financial assets |
|
5,513 |
5,626 |
| Trade and other receivables |
|
121 |
169 |
| Other non-financial assets |
(A.2) |
3,397 |
3,580 |
| Tax assets |
|
315 |
323 |
| Deferred tax assets |
|
2,182 |
2,095 |
| Total non-current assets |
|
46,730 |
53,638 |
| Total assets |
69,719 |
72,159 |
| |
| € millions |
2023 |
20221 |
| Trade and other payables |
1,584 |
2,147 |
| Tax liabilities |
582 |
283 |
| Financial liabilities |
(E.2) |
3,068 |
4,808 |
| Other non-financial liabilities |
3,859 |
4,818 |
| Provisions |
(B.4) |
339 |
90 |
| Contract liabilities |
6,743 |
5,309 |
| Total current liabilities |
16,176 |
17,453 |
| Trade and other payables |
57 |
79 |
| Tax liabilities |
901 |
893 |
| Financial liabilities |
(E.2) |
9,169 |
9,547 |
| Other non-financial liabilities |
677 |
705 |
| Provisions |
336 |
359 |
| Deferred tax liabilities |
146 |
241 |
| Contract liabilities |
28 |
33 |
| Total non-current liabilities |
11,314 |
11,858 |
| Total liabilities |
27,490 |
29,311 |
| Issued capital |
1,229 |
1,229 |
| Share premium |
1,552 |
3,081 |
| Retained earnings |
40,225 |
36,418 |
| Other components of equity |
3,100 |
3,801 |
| Treasury shares |
–4,159 |
–4,341 |
| Equity attributable to owners of parent |
41,946 |
40,186 |
| |
|
|
| Non-controlling interests |
283 |
2,662 |
| Total equity |
(E.1) |
42,229 |
42,848 |
| Total equity and liabilities |
69,719 |
72,159 |
1 According to IFRS 5, Consolidated Statements of Financial
Position as of 12/31/2022 for our continuing operations is unchanged from what previously has been reported.
Due to rounding, numbers may not add up precisely.
Consolidated Statements of Changes in Equity of SAP Group (IFRS)
| € millions |
Equity Attributable to Owners of Parent |
Non-
Controlling
Interests |
Total Equity |
|
Issued
Capital |
Share
Premium |
Retained
Earnings |
Other
Components
of Equity |
Treasury
Shares |
Total |
|
| |
| 12/31/2021 |
1,229 |
1,918 |
37,022 |
1,757 |
–3,072 |
38,853 |
2,670 |
41,523 |
|
|
Profit after tax |
|
|
1,074 |
|
|
1,074 |
–239 |
835 |
|
| Other comprehensive income |
|
|
–2 |
3,275 |
|
3,273 |
257 |
3,530 |
|
| Comprehensive income |
|
|
1,073 |
3,275 |
|
4,347 |
18 |
4,365 |
|
| Share-based payments |
|
629 |
|
|
|
629 |
181 |
810 |
|
| Dividends |
|
|
–2,865 |
|
|
–2,865 |
–18 |
–2,883 |
|
| Purchase of treasury shares |
|
|
|
|
–1,000 |
–1,000 |
|
–1,000 |
|
| Transactions with non-controlling interests |
|
|
–83 |
|
|
–83 |
85 |
1 |
|
| Other changes |
|
|
–37 |
|
|
–37 |
7 |
–29 |
|
| 6/30/2022 |
1,229 |
2,547 |
35,109 |
5,031 |
–4,072 |
39,844 |
2,943 |
42,787 |
|
| |
|
|
|
|
|
|
|
|
|
|
12/31/2022 |
1,229 |
3,081 |
36,418 |
3,801 |
–4,341 |
40,186 |
2,662 |
42,848 |
|
|
Profit
after tax |
|
|
3,933 |
|
|
3,933 |
–43 |
3,890 |
|
| Other comprehensive income |
|
|
0 |
–701 |
|
–701 |
–165 |
–866 |
|
| Comprehensive income |
|
|
3,933 |
–701 |
|
3,233 |
–208 |
3,024 |
|
| Share-based payments |
|
777 |
|
|
|
777 |
111 |
888 |
|
| Dividends |
|
|
–2,395 |
|
|
–2,395 |
–21 |
–2,416 |
|
| Reissuance of treasury shares under share-based payments |
|
|
|
|
182 |
182 |
|
182 |
|
| Transactions with non-controlling interests |
|
–2,306 |
2,306 |
|
|
0 |
–2,261 |
–2,261 |
|
| Other changes |
|
0 |
–37 |
|
|
–37 |
0 |
–37 |
|
|
6/30/2023 |
1,229 |
1,552 |
40,225 |
3,100 |
–4,159 |
41,946 |
283 |
42,229 |
|
|
Due to rounding, numbers may not add up precisely. |
|
Consolidated
Statement of Cash Flows of SAP Group (IFRS)
| €
millions |
Q1–Q2
2023 |
Q1–Q2
20221 |
 Profit (loss) after tax
 |
3,890 |
835 |
| Adjustments
to reconcile profit (loss) after tax to net cash flows from operating activities: |
|
|
| (Profit)
loss after tax from discontinued operations |
–2,763 |
794 |
| Depreciation
and amortization |
714 |
774 |
| Share-based
payment expense |
1,167 |
513 |
 Income tax expense
 |
643 |
666 |
 Financial
income, net Financial
income, net |
287 |
173 |
| Decrease/increase
in allowances on trade receivables |
5 |
104 |
| Other
adjustments for non-cash items |
76 |
11 |
| Decrease/increase
in trade and other receivables |
396 |
865 |
| Decrease/increase
in other assets |
–600 |
–600 |
| Increase/decrease
in trade payables, provisions, and other liabilities |
–896 |
–1,240 |
| Increase/decrease
in contract liabilities |
2,109 |
2,073 |
| Share-based
payments |
–697 |
–927 |
| Interest
paid |
–244 |
–138 |
| Interest
received |
197 |
44 |
| Income
taxes paid, net of refunds |
–1,127 |
–1,181 |
| Net
cash flows from operating activities – continuing operations |
3,160 |
2,766 |
| Net
cash flows from operating activities – discontinued operations |
80 |
–14 |
| Net
cash flows from operating activities |
3,240 |
2,752 |
| Business
combinations, net of cash and cash equivalents acquired |
0 |
–664 |
| Cash
flows from derivative financial instruments related to the sale of subsidiaries or businesses |
–91 |
0 |
| Purchase
of intangible assets or property, plant, and equipment |
–413 |
–408 |
| Proceeds
from sales of intangible assets or property, plant, and equipment |
43 |
46 |
| Purchase
of equity or debt instruments of other entities |
–220 |
–2,256 |
| Proceeds
from sales of equity or debt instruments of other entities |
722 |
4,005 |
| Net
cash flows from investing activities – continuing operations |
41 |
723 |
| Net
cash flows from investing activities – discontinued operations |
6,323 |
–15 |
| Net
cash flows from investing activities |
6,364 |
708 |
| Dividends
paid |
–2,395 |
–2,865 |
| Dividends
paid on non-controlling interests |
–18 |
–3 |
| Purchase
of treasury shares |
0 |
–1,000 |
| Proceeds
from borrowings |
0 |
38 |
| Repayments
of borrowings |
–1,724 |
–944 |
| Payments
of lease liabilities |
–188 |
–209 |
| Transactions
with non-controlling interests |
43 |
0 |
| Net
cash flows from financing activities – continuing operations |
–4,283 |
–4,982 |
| Net
cash flows from financing activities – discontinued operations |
24 |
–209 |
| Net
cash flows from financing activities |
–4,259 |
–5,191 |
| Effect
of foreign currency rates on cash and cash equivalents |
–212 |
305 |
| Net
decrease/increase in cash and cash equivalents |
5,134 |
–1,427 |
 Cash and cash equivalents at the beginning of the period
 |
9,008 |
8,898 |
 Cash and cash equivalents at the end of the period
 |
14,142 |
7,472 |
| 1 We
no longer show cash flows linked to the supply chain financing (SCF) transactions from Taulia in investing/financing cash flow separately
and therefore adjusted the comparative figures accordingly. |
| Due
to rounding, numbers may not add up precisely. |
Notes
to the Consolidated Half-Year Financial Statements
(IN.1)
Basis for Preparation
General
Information About Consolidated Half-Year Financial Statements
The
registered seat of SAP SE is in Walldorf, Germany (Commercial Register of the Lower Court of Mannheim HRB 719915). The condensed
Consolidated Half-Year Financial Statements of SAP SE and its subsidiaries (collectively, “we,” “us,” “our,”
“SAP,” “Group,” and “Company”) have been prepared in accordance with the International Financial
Reporting Standards (IFRS) and in particular in compliance with International Accounting Standard (IAS) 34. In this context, IFRS
includes all standards issued by the International Accounting Standards Board (IASB) and related interpretations issued by the IFRS Interpretations
Committee (IFRS IC). The variances between the applicable IFRS standards as issued by the IASB and the standards as used by the
European Union are not relevant to these financial statements.
Certain
information and disclosures normally included in the notes to annual financial statements prepared in accordance with IFRS have been
condensed or omitted. We believe that the disclosures made are adequate and that the information gives a true and fair view.
Our
business activities are influenced by certain seasonal effects. Historically, our overall revenue tends to be highest in the fourth quarter.
Interim results are therefore not necessarily indicative of results for a full year.
Amounts
reported in previous years have been reclassified if appropriate to conform to the presentation in this half-year report.
These
unaudited condensed Consolidated Half-Year Financial Statements should be read in conjunction with SAP’s audited Consolidated IFRS
Financial Statements for the Year Ended December 31, 2022, included in our Integrated Report 2022 and our Annual Report
on Form 20-F for 2022.
Due
to rounding, numbers presented throughout these Consolidated Half-Year Financial Statements may not add up precisely to the totals we
provide and percentages may not precisely reflect the absolute figures.
Amounts
disclosed in our Consolidated Half-Year Financial Statements that are taken directly from our Consolidated Income Statements
or our
Consolidated Income Statements
or our Consolidated Statements of Financial Position are marked by the symbols
 and
and  , respectively.
Accounting
Policies, Management Judgments, and Sources of Estimation Uncertainty
How
We Present Our Accounting Policies, Judgments, and Estimates
To
ease the understanding of our financial statements, we present the accounting policies, judgments, and estimates on a given subject
together with other disclosures related to the same subject in the Note that deals with this subject, and highlighted this
disclosure with a light gray box and the symbol  . We describe, however, only material
changes of our accounting policies, judgments, and estimates in relation to our Consolidated Financial Statements for
2022.
. We describe, however, only material
changes of our accounting policies, judgments, and estimates in relation to our Consolidated Financial Statements for
2022.
 New Accounting Standards Not Yet Adopted
The
IASB has issued amendments to standards such IAS 1 (Classification of Liabilities as Current or Non-current), that are relevant
for SAP but not yet effective. We are currently in the process of finalizing the assessment of the impact on SAP, but do not expect material
effects on our financial position or results of operations.
Section A
– Customers
This
section discusses disclosures related to contracts with our customers. These consist of revenue breakdowns and information about our
trade receivables. For more information, see our Consolidated Financial Statements for 2022, Section A
– Customers.
(A.1)
Revenue
Geographic
Information
The
amounts for revenue by region in the following tables are based on the location of customers.
Cloud
Revenue by Region
| €
millions |
Q1–Q2
2023 |
Q1–Q2
2022 |
| EMEA |
2,458 |
1,966 |
| Americas |
3,194 |
2,695 |
| APJ |
841 |
701 |
 SAP
Group SAP
Group |
6,493 |
5,362 |
Cloud
and Software Revenue by Region
| €
millions |
Q1–Q2
2023 |
Q1–Q2
2022 |
| EMEA |
5,660 |
5,285 |
| Americas |
5,283 |
4,866 |
| APJ |
1,919 |
1,853 |
| SAP
Group |
12,863 |
12,005 |
Total
Revenue by Region
| €
millions |
Q1–Q2
2023 |
Q1–Q2
2022 |
| Germany |
2,283 |
2,114 |
| Rest
of EMEA |
4,338 |
4,049 |
| EMEA |
6,621 |
6,163 |
| United
States |
4,974 |
4,566 |
| Rest
of Americas |
1,233 |
1,136 |
| Americas |
6,207 |
5,702 |
| Japan |
616 |
602 |
| Rest
of APJ |
1,550 |
1,513 |
| APJ |
2,166 |
2,115 |
| SAP
Group |
14,995 |
13,980 |
For
information about the breakdown of revenue by segment and segment revenue by region, see Note (C.1).
For more information about our revenue accounting policies, see our Consolidated Financial Statements for 2022, Note (A.1).
(A.2)
Trade and Other Receivables
| €
millions |
6/30/2023 |
| Current |
Non-Current
|
Total |
| Trade
receivables, net |
5,243 |
0 |
5,243 |
| Other
receivables |
351 |
121 |
472 |
 Total Total |
5,594 |
121 |
5,715 |
| €
millions |
12/31/2022 |
| Current |
Non-Current
|
Total |
| Trade
receivables, net |
5,782 |
0 |
5,782 |
| Other
receivables |
454 |
169 |
623 |
 Total Total |
6,236 |
169 |
6,405 |
Section B – Employees
This section provides financial insights into our employee
benefit arrangements. It should be read in conjunction with the compensation disclosures for key management personnel in Note (G.5)
in our Consolidated Financial Statements for 2022, as well as SAP’s Compensation Report.
For more information, see our Consolidated Financial Statements for 2022, Section B – Employees.
(B.1) Employee Headcount
On June 30, 2023, the breakdown of our full-time
equivalent employee numbers by function and by region was as shown in the table below.
Number of Employees (in Full-Time Equivalents)
| Full-time equivalents |
6/30/2023 |
6/30/2022 |
| |
EMEA |
Americas |
APJ |
Total |
EMEA |
Americas |
APJ |
Total |
| Cloud and software1 |
4,010 |
4,083 |
4,000 |
12,093 |
4,497 |
3,979 |
4,403 |
12,879 |
| Services |
7,993 |
5,000 |
5,476 |
18,469 |
8,193 |
5,061 |
5,811 |
19,065 |
| Research and development1 |
17,910 |
5,872 |
12,318 |
36,100 |
17,075 |
5,730 |
11,379 |
34,185 |
| Sales and marketing |
11,778 |
10,121 |
5,303 |
27,202 |
11,454 |
10,649 |
5,347 |
27,450 |
| General and administration |
3,475 |
1,765 |
1,281 |
6,521 |
3,337 |
1,867 |
1,208 |
6,411 |
| Infrastructure |
2,800 |
1,284 |
859 |
4,943 |
2,774 |
1,350 |
874 |
4,997 |
| SAP Group (6/30) |
47,966 |
28,125 |
29,237 |
105,328 |
47,331 |
28,636 |
29,022 |
104,988 |
| Thereof acquisitions |
0 |
0 |
0 |
0 |
173 |
189 |
8 |
370 |
| SAP Group (six months' end average) |
47,917 |
28,127 |
29,337 |
105,380 |
46,834 |
28,650 |
28,991 |
104,475 |
| 1 Due to the updated cost allocation policy described in Note (G.5), headcount numbers for the comparative period were adjusted accordingly |
(B.2) Employee Benefits Expenses
| € millions |
Q1–Q2 2023 |
Q1–Q2 2022 |
| Salaries |
5,915 |
5,572 |
| Social security expenses |
975 |
910 |
| Share-based payment expenses |
1,167 |
513 |
| Pension expenses |
235 |
236 |
| Employee-related restructuring expenses |
250 |
61 |
| Termination benefits |
22 |
23 |
| Employee benefits expenses |
8,565 |
7,315 |
(B.3) Share-Based Payments
The allocations of expenses for share-based payments to the
various expense items are as follows:
Share-Based Payments
| € millions |
Q1–Q2 2023 |
Q1–Q2 2022 |
| Cost of cloud |
47 |
19 |
| Cost of software licenses and support |
20 |
21 |
| Cost of services |
198 |
96 |
| Research and development |
371 |
162 |
| Sales and marketing |
435 |
171 |
| General and administration |
96 |
43 |
| Share-based payment expenses |
1,167 |
513 |
| Thereof cash-settled share-based payments |
473 |
–9 |
| Thereof equity-settled share-based payments |
694 |
522 |
Share-based payment expenses related to the Qualtrics plan
are included in the results from discontinued operations (see Note (D.1)).
Move SAP Plan and Grow SAP Plan
In the first half of 2023, we granted 13.9 million (first
half of 2022: 16.8 million) share units. This includes 12.4 million (first half of 2022: 14.3 million) share
units which we intend to settle in shares. The dilutive effect of outstanding equity-settled share units is reflected in the calculation
of earnings per share, diluted. Of the share units we intend to settle in cash, 0.8 million share units were granted in June 2023
under the Grow SAP plan (June 2022: 1.1 million).
Own SAP Plan
Under the Own SAP plan, employees can purchase, on a monthly
basis, SAP shares without any required holding period. The number of shares purchased by our employees under this plan was 3.5 million
in the first half of 2023 (first half of 2022: 4.6 million).
For more information about our share-based payments and a detailed
description of our share-based payment plans, see the Notes to the Consolidated Financial Statements for 2022, Note (B.3).
(B.4) Restructuring
| € millions |
Q1–Q2 2023 |
Q1–Q2 2022 |
| Employee-related restructuring expenses |
250 |
61 |
|
Onerous contract-related restructuring expenses and restructuring
related impairment losses |
8 |
58 |
| Restructuring expenses |
257 |
119 |
Most of the restructuring expenses recognized in the first
half of 2023 relate to the targeted restructuring program in selected areas of the company that SAP announced and launched in the first
quarter to further focus on its strategic growth areas and accelerated cloud transformation. Restructuring expenses primarily include
employee-related benefits such as severance payments. The restructuring costs presented in 2022 mainly include expenses related to the
wind-down of business in Russia and Belarus.
If not presented separately, these restructuring expenses would
break down in our income statements as follows:
Restructuring Expenses by Functional Area
| € millions |
Q1–Q2 2023 |
Q1–Q2 2022 |
| Cost of cloud |
6 |
–12 |
| Cost of software licenses and support |
11 |
4 |
| Cost of services |
34 |
61 |
| Research and development |
40 |
7 |
| Sales and marketing |
150 |
57 |
| General and administration |
16 |
3 |
| Restructuring expenses |
257 |
119 |
Section C – Financial Results
This section provides insight into the financial results of
SAP's reportable segments and of SAP overall, as far as not already covered by previous sections. This includes segment results and income
taxes. For more information, see our Consolidated Financial Statements for 2022, Section C –
Financial Results.
(C.1) Results of Segments
General Information
SAP has five operating segments that are regularly reviewed
by our Executive Board, which is responsible for assessing the performance of our Company and for making resource allocation decisions
as our Chief Operating Decision Maker (CODM). The operating segments are largely organized and managed separately according to their product
and service offerings, notably whether the products and services relate to our network offerings (Business Network), our customer experience
portfolio of Emarsys, our portfolio of sustainability-related solutions (Sustainability), our working capital management solutions (Taulia),
or cover other areas of our business including support and services activities (Applications, Technology & Services). For more
information about our segments, see the Notes to the Consolidated Financial Statements for 2022, Note (C.1).
In the first quarter of 2023, the non-reportable SAP Signavio
segment was dissolved and integrated into the Applications, Technology & Services segment. The segment information for comparative
prior periods was restated to conform with the new segment composition.
At the end of the second quarter of 2023, we sold Qualtrics,
formerly a reportable segment which derived its revenues mainly from the sale of experience management cloud solutions. For more information
related to the sale of Qualtrics, see Note (D.1).
Applications, Technology & Services
|
€ millions, unless otherwise stated
(non-IFRS) |
Q1–Q2 2023 |
Q1–Q2 2022 |
|
Actual
Currency |
Constant
Currency |
Actual
Currency |
| Cloud |
5,940 |
5,978 |
4,885 |
| Software licenses |
591 |
601 |
743 |
| Software support |
5,777 |
5,831 |
5,900 |
| Software licenses and support |
6,369 |
6,432 |
6,643 |
| Cloud and software |
12,309 |
12,410 |
11,529 |
| Services |
2,124 |
2,139 |
1,967 |
| Total segment revenue |
14,429 |
14,544 |
13,492 |
| Cost of cloud |
–1,806 |
–1,802 |
–1,589 |
| Cost of software licenses and support |
–624 |
–624 |
–661 |
| Cost of cloud and software |
–2,430 |
–2,426 |
–2,249 |
| Cost of services |
–1,492 |
–1,503 |
–1,380 |
| Total cost of revenue |
–3,922 |
–3,929 |
–3,629 |
| Cloud gross profit |
4,134 |
4,176 |
3,297 |
| Segment gross profit |
10,507 |
10,615 |
9,863 |
| Other segment expenses |
–6,042 |
–6,072 |
–6,054 |
| Segment profit (loss) |
4,465 |
4,543 |
3,809 |
Segment Revenue by Region
| € millions |
EMEA |
Americas |
APJ |
Total Segment Revenue |
| Q1–Q2 2023 |
Q1–Q2 2022 |
Q1–Q2 2023 |
Q1–Q2 2022 |
Q1–Q2 2023 |
Q1–Q2 2022 |
Q1–Q2 2023 |
Q1–Q2 2022 |
| Actual Currency |
Constant Currency |
Actual Currency |
Actual Currency |
Constant Currency |
Actual Currency |
Actual Currency |
Constant Currency |
Actual Currency |
Actual Currency |
Constant Currency |
Actual Currency |
| Applications, Technology & Services |
6,448 |
6,492 |
6,017 |
5,874 |
5,837 |
5,415 |
2,107 |
2,216 |
2,060 |
14,429 |
14,544 |
13,492 |
(C.2) Reconciliation of Segment Measures to Income Statement
| € millions |
Q1–Q2 2023 |
Q1–Q2 2022 |
|
Actual
Currency |
Constant
Currency |
Actual
Currency |
| Applications, Technology & Services |
14,429 |
14,544 |
13,492 |
| Total segment revenue for the reportable segment |
14,429 |
14,544 |
13,492 |
| Other revenue |
566 |
568 |
487 |
| Adjustment for currency impact |
0 |
117 |
0 |
|
Total revenue |
14,995 |
15,229 |
13,980 |
| Applications, Technology & Services |
4,465 |
4,543 |
3,809 |
| Total segment profit for the reportable segment |
4,465 |
4,543 |
3,809 |
| Other revenue |
566 |
568 |
487 |
| Other expenses |
–1,098 |
–1,081 |
–943 |
| Adjustment for currency impact |
0 |
–97 |
0 |
| Adjustment for |
|
|
|
| Acquisition-related charges |
–177 |
–177 |
–191 |
| Share-based payment expenses |
–1,167 |
–1,167 |
–513 |
| Restructuring |
–257 |
–257 |
–119 |
| Adjustment for regulatory compliance matter expenses |
–170 |
–170 |
0 |
|
Operating profit |
2,161 |
2,161 |
2,531 |
| Other
non-operating income/expense, net |
–103 |
–103 |
–63 |
|
Financial income, net |
–287 |
–287 |
–173 |
|
Profit before tax1 |
1,771 |
1,771 |
2,295 |
1 From
continuing operations
(C.3) Financial Income, Net
In the first half of 2023, finance income mainly consisted
of income from gains from disposals and fair value adjustments of equity securities totaling €186 million (first half of 2022: €463 million),
and interest income from loans and receivables, other financial assets (cash, cash equivalents, and current investments) as well as from
derivatives amounting to €190 million (first half of 2022: €65 million).
In the first half of 2023, finance costs were primarily impacted
by losses from disposals and fair value adjustments of equity securities amounting to €226 million (first half of 2022: €543 million),
and interest expense on financial liabilities including lease liabilities as well as negative effects from derivatives amounting to €370 million
(first half of 2022: €97 million). The increase in interest expenses in the first half of 2023 compared to the first half
of 2022 is due to:
| – | Our interest rate swaps through which we are exposed to variable interest rates, and |
| – | A forward contract to hedge the USD purchase price from the Qualtrics sale against EUR-USD fluctuations. This forward contract matured
on June 28, 2023, and we realized a loss of € 106 million in finance cost. |
For more information about our financial income, net, see the
Notes to the Consolidated Financial Statements for 2022, Note (C.4).
(C.4) Income Taxes
We are subject to ongoing tax audits by domestic and foreign
tax authorities. Currently, we are in dispute mainly with the German and only a few foreign tax authorities. The German dispute is in
respect of certain secured capital investments, while the few foreign disputes are in respect of the deductibility of intercompany royalty
payments and intercompany services. In all cases, we expect that a favorable outcome can only be achieved through litigation. For all
of these matters, we have not recorded a provision as we believe that the tax authorities’ claims have no merit and that no adjustment
is warranted. If, contrary to our view, the tax authorities were to prevail in their arguments before the court, we would expect to have
an additional expense of approximately €1,837 million (2022: €1,571 million) in total (including related interest
expenses and penalties of €1,013 million (2022: €857 million)). The contingent liabilities increased in 2023 mainly
due to tax effects (including interest) for the current year as well as foreign currency exchange rate fluctuations.
Section D – Invested Capital
This section highlights the non-current assets including investments
that form the basis of our operating activities. Additions in invested capital include separate asset acquisitions or business combinations.
For more information, see our Consolidated Financial Statements for 2022, Section D – Invested
Capital.
(D.1) Business Combinations and Divestitures
Qualtrics Disposal
On March 13, resulting from a process that was initiated
on January 26, SAP announced it had agreed to sell all of its 423 million shares of Qualtrics International Inc. as part of
the acquisition of Qualtrics by funds affiliated with Silver Lake as well as the Canada Pension Plan Investment Board. The sale closed
on June 28, 2023, following satisfaction of customary closing conditions and regulatory approvals. At a purchase price of US$18.15
in cash per share, SAP’s stake was acquired for approximately US$7.7 billion. At the time Qualtrics was classified as a discontinued
operation (following IFRS 5), there was no indication of an impairment (as the fair value less cost of disposal (calculated based on share
prices) significantly exceeded the carrying amount).
SAP will remain a close go-to-market and technology partner
for Qualtrics.
SAP’s financial results present Qualtrics as a discontinued
operation (given the qualitative and quantitative significance for SAP), in accordance with IFRS 5 (the comparative figures have
been adjusted accordingly). The Qualtrics disposal group was previously included in the Qualtrics reportable segment.
The pre-tax disposal gain included into discontinued operations
(€3.7 billion) was calculated by adjusting the purchase price less cost of disposal (€7.0 billion) for net assets leaving the
SAP Group (-€5.8 billion, mostly goodwill (-€4.0 billion) and other intangible assets (-€1.3 billion)) and the corresponding
non-controlling interests (€2.4 billion) and amounts of other comprehensive income (€0.1 billion). SAP incurred taxes amounting
to €0.5 billion in connection with the transaction.
The cash inflow resulting from the purchase price (€7.1
billion) was offset by cash and cash equivalents of €0.7 billion leaving the SAP Group.
SAP continues to provide rental guarantees for certain offices
used by Qualtrics. Qualtrics is obligated to indemnify SAP with respect to the guarantees.
Additional financial information relating to Qualtrics is presented
in the following tables (revenues and expenses are presented after consolidation of transactions between Qualtrics and SAP’s continuing
operations):
| € billion, unless otherwise stated |
Q1–Q2 2023 |
Q1–Q2 2022 |
| Consolidated Income Statements |
|
|
| Cloud revenue |
0.6 |
0.5 |
| Total revenue |
0.7 |
0.6 |
| Cost of cloud |
–0.1 |
–0.1 |
| Total cost of revenue |
–0.2 |
–0.2 |
| Total operating expenses (including total cost of revenue) |
–1.2 |
–1.4 |
| Disposal gain before tax |
3.7 |
0.0 |
| Operating profit |
3.2 |
–0.8 |
| € billion, unless otherwise stated |
Q1–Q2 2023 |
Q1–Q2 2022 |
| Profit (loss) before tax |
3.3 |
–0.8 |
| Income tax expense1 |
–0.5 |
0.0 |
| Profit (loss) after tax |
2.8 |
–0.8 |
| Attributable to owners of parent |
2.8 |
–0.6 |
| |
|
|
| Earnings per share, basic (IFRS, in €)2 |
2.40 |
–0.50 |
| Earnings per share, diluted (IFRS, in €)2 |
2.38 |
–0.50 |
| |
|
|
| Consolidated Statements of Cash Flow |
|
|
| Net operating cash flow |
0.1 |
–0.0 |
| Net investing cash flow |
6.3 |
–0.0 |
| Net financing cash flow |
0.0 |
–0.2 |
1 For
2023, €0.5 billion relates to the gain on sale of discontinued operations.
2 For
the six months ended June 30, 2023 and 2022, the weighted average number of shares was 1,168 million (diluted: 1,176 million)
and 1,174 million (diluted: 1,174 million), respectively (treasury stock excluded).
Due to rounding, numbers may not add up precisely.
(D.2) Goodwill
For goodwill, we have – through a qualitative and quantitative
analysis – been continuously monitoring the existence of triggering events that would require an impairment test in the first half
of 2023. The review of internal and external factors led us to conclude that no triggering events occurred since our annual goodwill impairment
test in 2022. No impairment tests were performed in the first half of 2023.
Due to the integration of the SAP Signavio segment into
the Applications, Technology & Services segment at the beginning of 2023, the goodwill in the SAP Signavio segment
was moved to this segment. Given the close proximity to the 2022 annual goodwill impairment test, no formal impairment test was performed
on the reallocation date of the SAP Signavio segment. For more information, see Note (C.1).
(D.3) Property, Plant, and Equipment
Property, Plant, and Equipment (Summary)
| € millions |
6/30/2023 |
12/31/2022 |
| Property, plant, and equipment excluding leases |
2,880 |
3,133 |
| Right-of-use assets |
1,481 |
1,801 |
|
Total |
4,361 |
4,934 |
| |
|
|
| Additions |
Q1–Q2 2023 |
Q1–Q4 2022 |
| Property, plant, and equipment excluding leases |
288 |
700 |
| Right-of-use assets |
88 |
429 |
| Total |
376 |
1,129 |
(D.4) Purchase Obligations
SAP purchased – under an existing deal that expires on
December 31, 2028 – additional cloud infrastructure services amounting to approximately €0.4 billion from a
hyperscaler. For more information about our purchase obligations, see the Notes to the Consolidated Financial Statements for 2022, Note (D.8).
Section E – Capital Structure, Financing and
Liquidity
This section provides information related to how SAP manages
its capital structure. Our capital management is based on a high equity ratio, modest financial leverage, a well-balanced maturity profile,
and deep debt capacity. For more information, see our Consolidated Financial Statements for 2022, Section E
– Capital Structure, Financing, and Liquidity.
(E.1) Total Equity
Number of Shares
| millions |
Issued Capital |
Treasury Shares |
| 12/31/2021 |
1,228.5 |
–48.9 |
| Purchase |
0 |
–10.0 |
| 6/30/2022 |
1,228.5 |
–58.9 |
| |
|
|
| 12/31/2022 |
1,228.5 |
–61.4 |
| Reissuance under share-based payments |
0 |
2.6 |
| 6/30/2023 |
1,228.5 |
–58.8 |
In the first half of 2022, we bought back 10.0 million
shares to support the transition of SAP’s share-based compensation programs to equity settlement. In the first half of 2023, we
reissued 2.6 million treasury shares to service share-based payment awards under our Move SAP Plan.
Other Components of Equity
| € millions |
Exchange Differences |
Cash Flow Hedges |
Total |
| 12/31/2021 |
1,779 |
–22 |
1,757 |
| Other comprehensive income |
3,249 |
26 |
3,275 |
| 6/30/2022 |
5,028 |
4 |
5,031 |
| |
|
|
|
| 12/31/2022 |
3,784 |
16 |
3,801 |
| Other comprehensive income |
–711 |
10 |
–701 |
| 6/30/2023 |
3,074 |
26 |
3,100 |
(E.2) Liquidity
| € millions |
6/30/2023 |
| Nominal Volume |
Carrying Amount |
| Current |
Non-Current |
Current |
Non-Current |
Total |
| Bonds |
0 |
7,376 |
0 |
6,580 |
6,580 |
| Private placement transactions |
0 |
389 |
0 |
395 |
395 |
| Commercial Paper |
930 |
0 |
926 |
0 |
926 |
| Bank loans |
1,450 |
0 |
1,450 |
0 |
1,450 |
| Financial debt |
2,380 |
7,765 |
2,376 |
6,975 |
9,352 |
| Lease liabilities |
NA |
NA |
322 |
1,424 |
1,745 |
| Other financial liabilities |
NA |
NA |
370 |
770 |
1,140 |
| Financial
liabilities |
|
|
3,068 |
9,169 |
12,237 |
| Financial
debt as % of financial liabilities |
|
|
77 |
76 |
76 |
| € millions |
12/31/2022 |
| Nominal Volume |
Carrying Amount |
| Current |
Non-Current |
Current |
Non-Current |
Total |
| Bonds |
1,600 |
7,381 |
1,600 |
6,556 |
8,155 |
| Private placement transactions |
0 |
397 |
0 |
405 |
405 |
| Commercial Paper |
930 |
0 |
928 |
0 |
928 |
| Bank loans |
1,456 |
0 |
1,456 |
0 |
1,456 |
| Financial debt |
3,986 |
7,778 |
3,983 |
6,960 |
10,943 |
| Lease liabilities |
NA |
NA |
349 |
1,791 |
2,140 |
| Other financial liabilities |
NA |
NA |
475 |
795 |
1,270 |
| Financial
liabilities |
|
|
4,808 |
9,547 |
14,354 |
| Financial
debt as % of financial liabilities |
|
|
83 |
73 |
76 |
Section F – Management of Financial Risk Factors
This section discusses financial risk factors and risk management.
In our half-year report, this includes the transfers between levels of the fair value hierarchy. For more information, particularly about
our risk management related to foreign currency exchange rate risk, interest rate risk, equity price risk, credit risk, liquidity risk,
and other financial risk factors, see our Consolidated Financial Statements for 2022, Section F –
Management of Financial Risk Factors.
(F.1) Financial Risk Factors, Financial Risk Management,
and Fair Value Disclosures on Financial Instruments
A detailed overview of our other financial instruments, financial
risk factors, the management of financial risks, and the determination of fair value as well as the classification of our other financial
instruments into the fair value hierarchy of IFRS 13 are presented in Notes (F.1)
and (F.2) in the Consolidated Financial Statements for 2022.
We do not disclose the fair value of our financial instruments
as at June 30, 2023, for the following reasons:
| – | For a large number of our financial instruments, their carrying amounts are a reasonable approximation of their fair values, and |
| – | For those financial instruments where the carrying amount differs from fair value, there was no material change in the relation between
carrying amount and fair value since December 31, 2022. |
Section G – Other Disclosures
This section provides additional disclosures on miscellaneous
topics, including information pertaining to other litigation, claims, and legal contingencies, and related party transactions. For more
information, see our Consolidated Financial Statements for 2022, Section G – Other Disclosures.
(G.1) Other Litigation, Claims, and Legal Contingencies
We are subject to a variety of claims and lawsuits that arise
from time to time in the ordinary course of our business, including proceedings and claims that relate to companies we have acquired.
We will continue to vigorously defend against all claims and lawsuits against us. We currently believe that resolving the claims and lawsuits
pending as at June 30, 2023, will neither individually nor in the aggregate have a material adverse effect on our business.
Among the claims and lawsuits are the following classes (for
more information about these classes, see the Notes to the Consolidated Financial Statements for 2022, Note (G.3)).
Intellectual Property-Related Litigation and Claims
For individual cases of intellectual property-related litigation
and claims disclosed in our Integrated Report 2022, there were no significant developments in the first half of 2023.
The provisions recorded for intellectual property-related litigation
and claims continue to be not material. There are also no material contingent liabilities from intellectual property-related litigation
and claims for which no provision has been recognized.
Tax-Related Litigation
There have been no significant changes in contingent liabilities
from non-income tax-related litigation for which no provision has been recognized compared to our Consolidated Financial Statements for
2022, Note (G.3).
For more information about income tax-related litigation, see
Note (C.4).
Anti-Bribery Matters
SAP received communications alleging conduct that may violate
anti-bribery laws in the United States (including the U.S. Foreign Corrupt Practices Act (FCPA)) and other countries. Most of the investigations
are ongoing and neither the final outcome of the investigations nor the date when substantiated definitive findings will be available
is predictable at this point in time. There could be an unfavorable outcome in one or more of the ongoing investigations. Management’s
current best estimate of possible outcome and financial effect is determined by reasonable judgement based on multiple factors.
As a consequence, as at June 30, 2023, provisions
for potential regulatory compliance matters totaling €170 million (December 31, 2022: €0 million) have
been recognized in our Consolidated Half-Year Financial Statements.
For more information, see the Notes to the Consolidated Financial
Statements for 2022, Note (G.3).
(G.2) Related Party Transactions
Certain Executive Board and Supervisory Board members of SAP SE
currently hold or have held positions of significant responsibility with other entities (for more information, see the Notes to the Consolidated
Financial Statements for 2022, Note (G.4)). We have relationships with certain of these
entities in the ordinary course of business.
On May 11, 2023, the Annual General Meeting of Shareholders
elected Punit Renjen to the Supervisory Board, as a successor to Gesche Joost who resigned with effect from that date. As of his election
date, Punit Renjen became a related party. He has been designated as the successor to Supervisory Board chairperson Hasso Plattner whose
term of office will expire with the Annual General Meeting of Shareholders in 2024.
| |
Executive Board Members |
Supervisory Board Members |
Companies Controlled by
Supervisory Board Members |
Associated Entities |
| € millions |
Q1–Q2 2023 |
Q1–Q2 2022 |
Q1–Q2 2023 |
Q1–Q2 2022 |
Q1–Q2 2023 |
Q1–Q2 2022 |
Q1–Q2 2023 |
Q1–Q2 2022 |
|
Products and services provided |
NA |
NA |
0 |
0 |
0 |
1 |
9 |
1 |
|
Products and services received |
NA |
NA |
11 |
11 |
2 |
2 |
49 |
37 |
| Sponsoring and other financial support provided |
NA |
NA |
NA |
NA |
2 |
3 |
NA |
NA |
| Outstanding balances on 6/30 (Vendors) |
NA |
NA |
0 |
1 |
0 |
0 |
–2 |
–3 |
| Outstanding balances on 6/30 (Customers) |
NA |
NA |
0 |
0 |
0 |
0 |
1 |
4 |
| Commitments on 6/30 |
NA |
NA |
0 |
0 |
482 |
3 |
NA |
NA |
| 1 Including services from employee representatives on the Supervisory Board in their capacity as employees of SAP |
| 2 The longest of these commitments is five years. |
For more information about related party transactions, see
the Notes to the Consolidated Financial Statements for 2022, Note (G.6).
(G.3) Events After the Reporting Period
Other than that, no events have occurred since June 30, 2023,
that have a material impact on the Company’s Consolidated Half-Year Financial Statements.
(G.4) Scope of Consolidation
Entities Consolidated in the Financial Statements
| |
Total |
| 12/31/2022 |
288 |
| Additions |
0 |
| Disposals |
–52 |
| 6/30/2023 |
236 |
The disposals in the first half of 2023 relate mainly to the
sale of SAP’s stake in Qualtrics.
For more information about our business combinations and the
effect on our Consolidated Financial Statements, see Note (D.1) and our Integrated
Report 2022.
(G.5) Updated Cost Allocation Policy
Starting January 1, 2023, all activities related
to changes in the code of SAP’s cloud and on-premise solutions are treated as development-related activities. Some of those activities,
specifically code corrections, were previously considered as support-related activities. SAP believes this update aligns SAP’s accounting
policy with market standards and increases comparability to its peers.
In the first half of 2023, the update of our cost allocation
policy led to an increase in our cloud gross profit by approximately €50 million, an increase in our software license and support
gross profit by approximately €130 million, and an increase in our R&D expenses by approximately €180 million.
For the full year 2023, the updated cost allocation policy
is expected to decrease our cost of cloud by approximately €100 million and cost of support by approximately €300 million,
while in consequence increase our R&D expense by approximately €400 million.
Had SAP applied this accounting policy in 2022, its cost of
cloud, cost of software licenses and support, and R&D expense would have been as follows:
| € millions |
IFRS |
Non-IFRS |
| Q1 2022 |
Q2 2022 |
Q3 2022 |
Q4 2022 |
FY 2022 |
Q1 2022 |
Q2 2022 |
Q3 2022 |
Q4 2022 |
FY 2022 |
| Cost of cloud |
–817 |
–833 |
–902 |
–947 |
–3,499 |
–798 |
–806 |
–873 |
–915 |
–3,391 |
| Cost of software licenses and support |
–347 |
–339 |
–341 |
–358 |
–1,384 |
–334 |
–316 |
–319 |
–334 |
–1,302 |
| Research and development expenses |
–1,396 |
–1,514 |
–1,571 |
–1,598 |
–6,080 |
–1,351 |
–1,393 |
–1,437 |
–1,449 |
–5,629 |
Due to rounding, numbers may not add up precisely.
Release of the Consolidated Half-Year Financial Statements
The Executive Board of SAP SE approved these consolidated
half-year financial statements on July 19, 2023, for submission to the Audit and Compliance Committee of the Supervisory Board
and for subsequent issuance.
Responsibility Statement
To the best of our knowledge, and in accordance with the applicable
reporting principles for half-year financial reporting, the Consolidated Half-Year Financial Statements give a true and fair view of the
assets, liabilities, financial position, and profit or loss of the SAP Group, and the Consolidated Half-Year Management Report of
the SAP Group includes a fair review of the development and performance of the business and the position of the SAP Group, together
with a description of the material opportunities and risks associated with the expected development of the SAP Group for the remaining
months of the financial year.
Walldorf, July 19, 2023
SAP SE
Walldorf, Baden
The Executive Board
| |
Christian Klein |
Dominik Asam |
| |
| |
| |
| |
| |
| |
Sabine Bendiek |
Dr. Juergen Mueller |
| |
| |
| |
| |
| |
| |
Scott Russell |
Thomas Saueressig |
| |
| |
| |
| |
| |
| |
Julia White |
|
Supplementary Financial Information
Financial and Non-Financial Key Facts (IFRS and Non-IFRS)
| € millions, unless otherwise stated |
Q1
2022 |
Q2
2022 |
Q3
2022 |
Q4
2022 |
TY
2022 |
Q1
2023 |
Q2
2023 |
| Revenues |
|
|
|
|
|
|
|
| Cloud |
2,565 |
2,796 |
2,986 |
3,078 |
11,426 |
3,178 |
3,316 |
| % change – yoy |
29 |
32 |
36 |
29 |
31 |
24 |
19 |
| % change constant currency – yoy |
23 |
23 |
23 |
21 |
23 |
22 |
22 |
| SAP S/4HANA Cloud |
404 |
472 |
546 |
660 |
2,081 |
716 |
823 |
| % change – yoy |
78 |
84 |
98 |
101 |
91 |
77 |
74 |
| % change constant currency – yoy |
71 |
72 |
81 |
90 |
79 |
75 |
79 |
| Software licenses |
317 |
426 |
406 |
907 |
2,056 |
276 |
316 |
| % change – yoy |
–34 |
–34 |
–38 |
–38 |
–37 |
–13 |
–26 |
| % change constant currency – yoy |
–36 |
–38 |
–42 |
–39 |
–39 |
–13 |
–24 |
| Software support |
2,923 |
2,977 |
3,016 |
2,993 |
11,909 |
2,905 |
2,873 |
| % change – yoy |
4 |
5 |
5 |
3 |
4 |
–1 |
–3 |
| % change constant currency – yoy |
1 |
0 |
–2 |
–1 |
0 |
–1 |
–1 |
| Software licenses and support |
3,240 |
3,403 |
3,422 |
3,900 |
13,965 |
3,180 |
3,189 |
| % change – yoy |
–1 |
–2 |
–3 |
–11 |
–5 |
–2 |
–6 |
| % change constant currency – yoy |
–4 |
–7 |
–9 |
–14 |
–9 |
–2 |
–4 |
| Cloud and software |
5,806 |
6,199 |
6,408 |
6,978 |
25,391 |
6,358 |
6,505 |
| % change – yoy |
10 |
11 |
12 |
3 |
9 |
10 |
5 |
| % change constant currency – yoy |
6 |
4 |
3 |
–1 |
3 |
8 |
8 |
| Total revenue |
6,773 |
7,207 |
7,476 |
8,064 |
29,520 |
7,441 |
7,554 |
| % change – yoy |
10 |
11 |
13 |
5 |
10 |
10 |
5 |
| % change constant currency – yoy |
6 |
5 |
4 |
0 |
4 |
9 |
8 |
| Share of more predictable revenue (in %) |
81 |
80 |
80 |
75 |
79 |
82 |
82 |
| Profits |
|
|
|
|
|
|
|
| Operating profit (loss) (IFRS) |
1,471 |
1,060 |
1,557 |
2,002 |
6,090 |
803 |
1,358 |
| Operating profit (loss) (non-IFRS) |
1,676 |
1,678 |
2,075 |
2,560 |
7,989 |
1,875 |
2,058 |
| % change |
–3 |
–12 |
–1 |
3 |
–3 |
12 |
23 |
| % change constant currency |
–6 |
–15 |
–8 |
1 |
–7 |
12 |
28 |
| Profit (loss) after tax (IFRS) |
1,016 |
613 |
839 |
600 |
3,068 |
403 |
724 |
| Profit (loss) after tax (non-IFRS) |
1,171 |
1,098 |
1,240 |
1,008 |
4,517 |
1,254 |
1,249 |
| % change |
–29 |
–50 |
–42 |
–56 |
–45 |
7 |
14 |
| Margins |
|
|
|
|
|
|
|
| Cloud gross margin (IFRS, in %) |
68.2 |
70.2 |
69.8 |
69.2 |
69.4 |
70.5 |
71.1 |
| Cloud gross margin (non-IFRS, in %) |
68.9 |
71.2 |
70.8 |
70.3 |
70.3 |
71.4 |
72.2 |
| Software license and support gross margin (IFRS, in %) |
89.3 |
90.1 |
90.0 |
90.8 |
90.1 |
88.6 |
90.1 |
| Software license and support gross margin (non-IFRS, in %) |
89.7 |
90.7 |
90.7 |
91.4 |
90.7 |
89.2 |
90.5 |
| Cloud and software gross margin (IFRS, in %) |
80.0 |
81.1 |
80.6 |
81.3 |
80.8 |
79.5 |
80.3 |
| Cloud and software gross margin (non-IFRS, in %) |
80.5 |
81.9 |
81.4 |
82.1 |
81.5 |
80.3 |
81.2 |
| Gross margin (IFRS, in %) |
72.2 |
72.7 |
72.8 |
73.4 |
72.8 |
71.0 |
71.6 |
| Gross margin (non-IFRS, in %) |
73.1 |
74.3 |
74.4 |
75.1 |
74.3 |
72.9 |
73.8 |
| Operating margin (IFRS, in %) |
21.7 |
14.7 |
20.8 |
24.8 |
20.6 |
10.8 |
18.0 |
| Operating margin (non-IFRS, in %) |
24.8 |
23.3 |
27.8 |
31.7 |
27.1 |
25.2 |
27.2 |
| ATS segment – Segment gross margin (in %) |
72.5 |
73.7 |
73.3 |
74.5 |
73.5 |
72.3 |
73.3 |
| ATS segment – Segment margin in % |
28.9 |
27.6 |
31.4 |
35.0 |
30.9 |
29.6 |
32.3 |
| Key Profit Ratios |
|
|
|
|
|
|
|
| Effective tax rate (IFRS, in %) |
25.5 |
34.2 |
28.3 |
42.8 |
32.0 |
40.5 |
33.8 |
| Effective tax rate (non-IFRS, in %) |
25.4 |
29.1 |
26.6 |
37.2 |
29.6 |
28.3 |
30.4 |
| € millions, unless otherwise stated |
Q1
2022 |
Q2
2022 |
Q3
2022 |
Q4
2022 |
TY
2022 |
Q1
2023 |
Q2
2023 |
| Earnings per share, basic (IFRS, in €) from continuing operations |
0.87 |
0.54 |
0.75 |
0.63 |
2.80 |
0.35 |
0.62 |
| Earnings per share, basic (non-IFRS, in €) from continuing operations |
1.00 |
0.95 |
1.10 |
0.98 |
4.03 |
1.08 |
1.07 |
| Earnings per share, basic (IFRS, in €)4 |
0.63 |
0.29 |
0.57 |
0.46 |
1.95 |
0.41 |
2.96 |
| Earnings per share, basic (non-IFRS, in €)4 |
1.00 |
0.96 |
1.12 |
1.00 |
4.08 |
1.27 |
3.14 |
| Order Entry and current cloud backlog |
|
|
|
|
|
|
|
| Current cloud backlog |
8,937 |
9,543 |
10,334 |
11,024 |
11,024 |
11,148 |
11,537 |
| % change – yoy |
25 |
32 |
36 |
27 |
27 |
25 |
21 |
| % change constant currency – yoy |
21 |
23 |
24 |
24 |
24 |
25 |
25 |
| SAP S/4HANA Current cloud backlog |
1,925 |
2,258 |
2,662 |
3,171 |
3,171 |
3,418 |
3,717 |
| % change – yoy |
86 |
100 |
108 |
86 |
86 |
78 |
65 |
| % change constant currency – yoy |
79 |
87 |
90 |
82 |
82 |
79 |
70 |
| Share of cloud orders greater than €5 million based on total cloud order entry volume (in %)3 |
43 |
49 |
42 |
55 |
50 |
45 |
46 |
| Share of cloud orders smaller than €1 million based on total cloud order entry volume (in %)3 |
29 |
25 |
26 |
18 |
23 |
26 |
25 |
| Share of on-premise orders greater than €5 million based on total software order entry volume (in %) |
40 |
33 |
28 |
29 |
31 |
26 |
22 |
| Share of on-premise orders smaller than €1 million based on total software order entry volume (in %) |
33 |
40 |
49 |
37 |
40 |
50 |
50 |
| Liquidity and Cash Flow |
|
|
|
|
|
|
|
| Net cash flows from operating activities |
2,465 |
301 |
887 |
2,022 |
5,675 |
2,311 |
848 |
| Capital expenditure |
–212 |
–196 |
–277 |
–193 |
–877 |
–257 |
–156 |
| Payments of lease liabilities |
–93 |
–116 |
–97 |
–103 |
–410 |
–99 |
–89 |
| Free cash flow |
2,159 |
–10 |
513 |
1,726 |
4,388 |
1,955 |
604 |
| % of total revenue |
32 |
0 |
7 |
21 |
15 |
26 |
8 |
| % of profit after tax (IFRS) |
213 |
–2 |
61 |
288 |
143 |
485 |
83 |
| Group liquidity |
11,267 |
8,236 |
8,554 |
9,694 |
9,694 |
9,700 |
14,326 |
| Financial debt (–) |
–12,171 |
–12,282 |
–12,282 |
–11,764 |
–11,764 |
–10,751 |
–10,146 |
| Net debt (–) |
–904 |
–4,046 |
–3,728 |
–2,070 |
–2,070 |
–1,050 |
4,180 |
| Financial Position5 |
|
|
|
|
|
|
|
| Cash and cash equivalents |
8,927 |
7,472 |
7,316 |
9,008 |
9,008 |
8,766 |
14,142 |
| Goodwill |
32,140 |
33,879 |
35,664 |
33,077 |
33,077 |
28,563 |
28,581 |
| Total assets |
73,754 |
72,605 |
74,840 |
72,159 |
72,159 |
73,533 |
69,719 |
| Contract liabilities (current) |
7,630 |
6,883 |
5,487 |
5,309 |
5,309 |
7,547 |
6,743 |
| Equity ratio (total equity in % of total assets) |
58 |
59 |
62 |
59 |
59 |
58 |
61 |
| Non-Financials |
|
|
|
|
|
|
|
| Number of employees (quarter end)1 |
104,670 |
104,988 |
106,912 |
106,312 |
106,312 |
105,132 |
105,328 |
| Employee retention (in %, rolling 12 months) |
92.5 |
92.0 |
92.2 |
92.8 |
92.8 |
93.8 |
95.1 |
| Women in management (in %, quarter end) |
28.6 |
28.9 |
29.2 |
29.3 |
29.3 |
29.4 |
29.5 |
| Net carbon emissions2 (in kilotons) |
20 |
20 |
20 |
20 |
85 |
0 |
0 |
1 In full-time equivalents
2 In CO2 equivalents. SAP’s carbon
emission numbers are rounded to the nearest 5 kt. Therefore, the rounded full-year totals may not precisely equal the sum of the
rounded quarterly numbers.
³ To conform to refined calculation logic, prior quarters
have been adjusted.
4 From continuing and discontinued operations.
5 According to IFRS 5, comparison quarters 2022
for our continuing operations is unchanged from what previously has been reported.
Due to rounding, numbers may not add up precisely.
Reconciliation of Non-IFRS Numbers to IFRS Numbers
Reconciliation of Non-IFRS Revenue
| € millions, unless otherwise stated |
Q1–Q2 2023 |
Q1–Q2 2022 |
∆ in % |
| IFRS |
Currency
Impact |
Non-IFRS
Constant
Currency |
IFRS |
IFRS |
Non-IFRS
Constant
Currency1 |
| Revenue Numbers |
|
|
|
|
|
|
| Cloud |
6,493 |
39 |
6,532 |
5,362 |
21 |
22 |
| Software licenses |
591 |
10 |
601 |
743 |
–20 |
–19 |
| Software support |
5,778 |
54 |
5,832 |
5,900 |
–2 |
–1 |
| Software licenses and support |
6,369 |
64 |
6,433 |
6,643 |
–4 |
–3 |
| Cloud and software |
12,863 |
103 |
12,965 |
12,005 |
7 |
8 |
| Services |
2,132 |
15 |
2,147 |
1,974 |
8 |
9 |
| Total revenue |
14,995 |
117 |
15,112 |
13,980 |
7 |
8 |
1 Constant currency period-over-period changes are
calculated by comparing the current year's non-IFRS constant currency numbers with the IFRS numbers of the previous year's respective
period.
Due to rounding, numbers may not add up precisely.
Reconciliation of Non-IFRS Operating Expenses
| € millions, unless otherwise stated |
Q1–Q2 2023 |
Q1–Q2 2022 |
∆ in % |
| IFRS |
Adj. |
Non-IFRS |
Currency
Impact |
Non-IFRS
Constant
Currency |
IFRS |
Adj. |
Non-IFRS |
IFRS |
Non-IFRS |
Non-IFRS
Constant
Currency1 |
| Operating Expense Numbers |
|
|
|
|
|
|
|
|
|
|
|
| Cost of cloud |
–1,897 |
68 |
–1,829 |
|
|
–1,650 |
46 |
–1,604 |
15 |
14 |
|
| Cost of software licenses and support |
–687 |
42 |
–645 |
|
|
–686 |
36 |
–650 |
0 |
–1 |
|
| Cost of cloud and software |
–2,584 |
110 |
–2,474 |
|
|
–2,336 |
82 |
–2,254 |
11 |
10 |
|
| Cost of services |
–1,718 |
199 |
–1,519 |
|
|
–1,516 |
97 |
–1,420 |
13 |
7 |
|
| Total cost of revenue |
–4,301 |
309 |
–3,992 |
|
|
–3,852 |
179 |
–3,674 |
12 |
9 |
|
| Gross profit |
10,693 |
309 |
11,002 |
|
|
10,127 |
179 |
10,306 |
6 |
7 |
|
| Research and development |
–3,138 |
374 |
–2,764 |
|
|
–2,910 |
167 |
–2,743 |
8 |
1 |
|
| Sales and marketing |
–4,457 |
734 |
–3,723 |
|
|
–3,842 |
310 |
–3,532 |
16 |
5 |
|
| General and administration |
–670 |
97 |
–573 |
|
|
–610 |
49 |
–561 |
10 |
2 |
|
| Restructuring |
–257 |
257 |
0 |
|
|
–119 |
119 |
0 |
>100 |
NA |
|
| Other operating income/expense, net |
–10 |
0 |
–10 |
|
|
–115 |
0 |
–115 |
–91 |
–91 |
|
| Total operating expenses |
–12,834 |
1,772 |
–11,062 |
–20 |
–11,083 |
–11,449 |
823 |
–10,626 |
12 |
4 |
4 |
1 Constant currency period-over-period changes are
calculated by comparing the current year's non-IFRS constant currency numbers with the non-IFRS numbers of the previous year's respective
period.
Due to rounding, numbers may not add up precisely.
Reconciliation of Non-IFRS Profit Figures, Income Tax, and Key
Ratios
| € millions, unless otherwise stated |
Q1–Q2 2023 |
Q1–Q2 2022 |
∆ in % |
| IFRS |
Adj. |
Non-IFRS |
Currency
Impact |
Non-IFRS
Constant
Currency |
IFRS |
Adj. |
Non-IFRS |
IFRS |
Non-IFRS |
Non-IFRS
Constant
Currency1 |
| Profit Numbers |
|
|
|
|
|
|
|
|
|
|
|
| Operating profit (loss) |
2,161 |
1,772 |
3,933 |
97 |
4,029 |
2,531 |
823 |
3,354 |
–15 |
17 |
20 |
| Profit (loss) before tax from continuing operations |
1,771 |
1,772 |
3,543 |
|
|
2,295 |
823 |
3,119 |
–23 |
14 |
|
| Income tax expense |
–643 |
–397 |
–1,040 |
|
|
–666 |
–183 |
–850 |
–3 |
22 |
|
| Profit (loss) after tax from continuing operations |
1,128 |
1,375 |
2,502 |
|
|
1,629 |
640 |
2,269 |
–31 |
10 |
|
| Attributable to owners of parent |
1,135 |
1,373 |
2,508 |
|
|
1,657 |
638 |
2,295 |
–31 |
9 |
|
| Attributable to non-controlling interests |
–7 |
2 |
–5 |
|
|
–28 |
2 |
–26 |
–74 |
–80 |
|
| Profit (loss) after tax3 |
3,890 |
1,156 |
5,047 |
|
|
835 |
1,424 |
2,259 |
>100 |
>100 |
|
| Attributable to owners of parent3 |
3,933 |
1,220 |
5,153 |
|
|
1,074 |
1,232 |
2,306 |
>100 |
>100 |
|
| Attributable to non-controlling interests3 |
–43 |
–64 |
–107 |
|
|
–239 |
192 |
–47 |
–82 |
>100 |
|
| |
|
|
|
|
|
|
|
|
|
|
|
| Key Ratios |
|
|
|
|
|
|
|
|
|
|
|
| Operating margin (in %) |
14.4 |
|
26.2 |
|
26.7 |
18.1 |
|
24.0 |
–3.7pp |
2.2pp |
2.7pp |
| Effective tax rate (in %)2 |
36.3 |
|
29.4 |
|
|
29.0 |
|
27.2 |
7.3pp |
2.1pp |
|
| Earnings per share, basic (in €) from continuing operations |
0.97 |
|
2.15 |
|
|
1.41 |
|
1.96 |
–31 |
10 |
|
| Earnings per share, basic (in €)3 |
3.37 |
|
4.41 |
|
|
0.92 |
|
1.96 |
>100 |
>100 |
|
1 Constant currency period-over-period changes are
calculated by comparing the current year's non-IFRS constant currency numbers with the non-IFRS numbers of the previous year's respective
period.
2 The difference between our effective tax rate (IFRS)
and effective tax rate (non-IFRS) in the first half of 2023 mainly resulted from tax effects of share-based payment expenses and restructuring
expenses. The difference between our effective tax rate (IFRS) and effective tax rate (non-IFRS) in the first half of 2022 mainly resulted
from tax effects of share-based payment expenses and acquisition-related charges.
3 From continuing and discontinued operations
Due to rounding, numbers may not add up precisely.
Non-IFRS Adjustments Actuals and Estimates
| € millions |
Estimated Amounts for
Full Year 2023 |
Q1–Q2 2023 |
Q1–Q2 2022 |
| Operating profit (loss) (IFRS) |
|
2,161 |
2,531 |
| Adjustment for acquisition-related charges |
300–380 |
177 |
191 |
| Adjustment for share-based payment expenses |
1,850–2,250 |
1,167 |
513 |
| Adjustment for restructuring |
250–300 |
257 |
119 |
| Adjustment for regulatory compliance matter expenses |
170 |
170 |
- |
| Operating expense adjustments |
|
1,772 |
823 |
| Operating profit (loss) (non-IFRS) |
|
3,933 |
3,354 |
Non-IFRS-Adjustments by Functional Areas
| € millions |
Q1–Q2 2023 |
Q1–Q2 2022 |
| IFRS |
Acqui-
sition-
related |
SBP1 |
Restruc-turing |
RCM2 |
Non-IFRS |
IFRS |
Acqui-sition-
related |
SBP1 |
Restruc-turing |
RCM2 |
Non-
IFRS |
| Cost of cloud |
–1,897 |
21 |
47 |
0 |
0 |
–1,829 |
–1,650 |
27 |
19 |
0 |
- |
–1,604 |
| Cost of software licenses and support |
–687 |
22 |
20 |
0 |
0 |
–645 |
–686 |
15 |
21 |
0 |
- |
–650 |
| Cost of services |
–1,718 |
0 |
198 |
0 |
0 |
–1,519 |
–1,516 |
0 |
96 |
0 |
- |
–1,420 |
| Research and development |
–3,138 |
4 |
371 |
0 |
0 |
–2,764 |
–2,910 |
5 |
162 |
0 |
- |
–2,743 |
| Sales and marketing |
–4,457 |
129 |
435 |
0 |
170 |
–3,723 |
–3,842 |
139 |
171 |
0 |
- |
–3,532 |
| General and administration |
–670 |
1 |
96 |
0 |
0 |
–573 |
–610 |
6 |
43 |
0 |
- |
–561 |
| Restructuring |
–257 |
0 |
0 |
257 |
0 |
0 |
–119 |
0 |
0 |
119 |
- |
0 |
| Other operating income/expense, net |
–10 |
0 |
0 |
0 |
0 |
–10 |
–115 |
0 |
0 |
0 |
- |
–115 |
| Total operating expenses |
–12,834 |
177 |
1,167 |
257 |
170 |
–11,062 |
–11,449 |
191 |
513 |
119 |
- |
–10,626 |
| |
|
|
|
|
|
|
|
|
|
|
|
|
|
1 Share-based
payments
2 Regulatory
Compliance Matters
Due to rounding, numbers may not add up precisely.
Reconciliation of Non-IFRS Profit After Tax for Discontinued Operations
| € billion, unless otherwise stated |
Q1–Q2 2023 |
Q1–Q2 2022 |
| Profit (loss) after tax (IFRS) from discontinued operations |
2.8 |
–0.8 |
| Adjustment for acquisition related charges |
–0.8 |
0.1 |
| Adjustment for share-based payment expenses |
0.4 |
0.7 |
| Adjustment for restructuring expenses |
0.0 |
0.0 |
| Adjustment for tax impact of non-IFRS adjustments |
0.2 |
–0.0 |
| Profit (loss) after tax (non-IFRS) from discontinued operations |
2.5 |
–0.0 |
| Attributable to owners of parent |
2.6 |
0.0 |
Due to rounding, numbers may not add up precisely.
Revenue by Region (IFRS and Non-IFRS)
| € millions |
Q1–Q2 2023 |
Q1–Q2 2022 |
∆ in % |
| Actual Currency |
Currency
Impact |
Constant
Currency |
Actual Currency |
Actual
Currency |
Constant
Currency1 |
| Cloud
Revenue by Region |
|
|
|
| EMEA |
2,458 |
16 |
2,474 |
1,966 |
25 |
26 |
| Americas |
3,194 |
–19 |
3,176 |
2,695 |
19 |
18 |
| APJ |
841 |
42 |
883 |
701 |
20 |
26 |
| Cloud revenue |
6,493 |
39 |
6,532 |
5,362 |
21 |
22 |
| Cloud and Software Revenue by Region |
|
|
|
| EMEA |
5,660 |
39 |
5,699 |
5,285 |
7 |
8 |
| Americas |
5,283 |
–33 |
5,250 |
4,866 |
9 |
8 |
| APJ |
1,919 |
97 |
2,016 |
1,853 |
4 |
9 |
| Cloud and software revenue |
12,863 |
103 |
12,965 |
12,005 |
7 |
8 |
| Total Revenue by Region |
|
|
|
| Germany |
2,283 |
–1 |
2,282 |
2,114 |
8 |
8 |
| Rest of EMEA |
4,338 |
45 |
4,383 |
4,049 |
7 |
8 |
| Total EMEA |
6,621 |
44 |
6,666 |
6,163 |
7 |
8 |
| United States |
4,974 |
–47 |
4,927 |
4,566 |
9 |
8 |
| Rest of Americas |
1,233 |
9 |
1,242 |
1,136 |
9 |
9 |
| Total Americas |
6,207 |
–38 |
6,169 |
5,702 |
9 |
8 |
| Japan |
616 |
52 |
668 |
602 |
2 |
11 |
| Rest of APJ |
1,550 |
59 |
1,609 |
1,513 |
2 |
6 |
| Total APJ |
2,166 |
111 |
2,277 |
2,115 |
2 |
8 |
| Total revenue |
14,995 |
117 |
15,112 |
13,980 |
7 |
8 |
1 Constant-currency
period-over-period changes are calculated by comparing the current year's non-IFRS constant-currency numbers with the non-IFRS number
of the previous year's respective period.
Due to rounding, numbers may not add up precisely.
General Information
Forward-Looking Statements
This half-year report contains forward-looking statements and
information based on the beliefs of, and assumptions made by, our management using information currently available to them. Any statements
contained in this report that are not historical facts are forward-looking statements as defined in the U.S. Private Securities Litigation
Reform Act of 1995. We have based these forward-looking statements on our current expectations, assumptions, and projections about future
conditions and events. As a result, our forward-looking statements and information are subject to uncertainties and risks, many of which
are beyond our control. If one or more of these uncertainties or risks materializes, or if management’s underlying assumptions prove
incorrect, our actual results could differ materially from those described in or inferred from our forward-looking statements and information.
We describe these risks and uncertainties in the Risk Management and Risks section, respectively
in the there-mentioned sources.
The words “aim,” “anticipate,” “assume,”
“believe,” “continue,” “could,” “counting on,” “is confident,” “development,”
“estimate,” “expect,” “forecast,” ”future trends,” “guidance,” “intend,”
“may,” ”might,” “outlook,” “plan,” “project,” “predict,” “seek,”
“should,” “strategy,” “want,” “will,” “would,” and similar expressions as
they relate to us are intended to identify such forward-looking statements. Such statements include, for example, those made in the Performance
Against Our Outlook 2023 section, the Risk Management and Risks section (including
but not limited to statements in this section pertaining to the Russia/Ukraine crisis or cyber incidents), the Expected
Developments and Opportunities section, and other forward-looking information appearing in other parts of this half-year financial
report. To fully consider the factors that could affect our future financial results, both our Integrated Report 2022 and our Annual
Report on Form 20-F for 2022, should be considered, as well as all of our other filings with the Securities and Exchange Commission
(SEC). In addition, any delays in our structured exit from Russia and Belarus, or further adverse developments in Russia’s war against
Ukraine, or cybersecurity or related incidents (for example, initiated by malware) impacting SAP could cause our actual results and performance
to differ materially from any projections expressed in or implied by our forward-looking statements. Readers are cautioned not to place
undue reliance on these forward-looking statements, which speak only as at the date specified or the date of this report. We undertake
no obligation to publicly update or revise any forward-looking statements as a result of new information that we receive about conditions
that existed upon issuance of this report, future events, or otherwise unless we are required to do so by law.
This report includes statistical data about the IT industry
and global economic trends that comes from information published by sources including IDC, the ECB, and the IMF. This type of data represents
only the estimates of IDC, ECB, IMF, and other sources of industry data. SAP does not adopt or endorse any of the statistical information
provided by sources such as IDC, ECB, IMF, or other similar sources that is contained in this report. The data from these sources
is subject to risks and uncertainties, and subject to change based on various factors, including those described above, in the Risk
Management and Risks section, and elsewhere in this report. These and other factors could cause our results to differ materially
from those expressed in the estimates made by third parties and SAP. We caution readers not to place undue reliance on this data.
All of the information in this report relates to the situation
as at June 30, 2023, or the half year ended on that date unless otherwise stated.
Non-IFRS Financial Information
This half-year report contains non-IFRS measures as well as
financial data prepared in accordance with IFRS. We present and discuss the reconciliation of these non-IFRS measures to the respective
IFRS measures in the Supplementary Financial Information section. For more information about
non-IFRS measures, see our Web site http://www.sap.com/investors/sap-non-ifrs-measures.
Additional
Information
Financial
Calendar
October 19, 2023
Third-quarter
2023 earnings release, conference call for financial analysts and investors
January 24, 2024
Fourth-quarter
and full-year 2023 preliminary earnings release, conference call for financial analysts and investors
May 15, 2024
Annual
General Meeting of Shareholders, Mannheim, Germany
Investor
Services
Additional
information about this half-year report is available online at www.sap.com/investors, including
the official quarterly statement, a presentation about the quarterly results, and a recording of the conference call for financial analysts.
The
“Financial Reports” tab contains the following publications:
| – | SAP
Integrated Report (IFRS, PDF, www.sapintegratedreport.com) |
| – | SAP
Annual Report on Form 20-F (IFRS, PDF) |
| – | SAP SE
Statutory Financial Statements and Review of Operations (HGB, German only, PDF) |
| – | Half-Year
Report (IFRS, PDF) |
| – | Quarterly
Statements (IFRS, PDF) |
www.sap.com/investors is
also the place to look for in-depth information about stock, debt, and corporate governance; financial and event news; and various
services designed to help investors find the information they need fast (see "Investor Services”). These include our free
SAP INVESTOR magazine for shareholders, an e-mail and text message news service, and a Twitter feed.
For
sustainability reasons and faster distribution, SAP decided to refrain from printing reports.
You
can reach us by phone at +49 6227 7-67336, send a fax to +49 6227 7-40805, or e-mail us at investor@sap.com.
Addresses
SAP SE
Dietmar-Hopp-Allee
16
69190
Walldorf
Germany
Tel.
+49 6227 7-47474
Fax
+49 6227 7-57575
Internet
www.sap.com
E-mail
info@sap.com
The
addresses of all our international offices are available on our public Web site at www.sap.com/offices.
Information
About Content
Investor
Relations
Tel.
+49 6227 7-67336
Fax
+49 6227 7-40805
E-mail
investor@sap.com
Twitter
@SAPinvestor
Internet
www.sap.com/investors
Imprint
Overall
responsibility:
SAP SE
Corporate
Financial Reporting
Published
on July 20, 2023.
The
German version of this Half-Year Report can be found under www.sap.com/corporate/de/investors.
Copyright
Usage in Collateral
©
2023 SAP SE or an SAP affiliate company. All rights reserved.
No
part of this publication may be reproduced or transmitted in any form or for any purpose without the express permission of SAP SE
or an SAP affiliate company.
SAP
and other SAP products and services mentioned herein as well as their respective logos are trademarks or registered trademarks of
SAP SE (or an SAP affiliate company) in Germany and other countries. Please see https://www.sap.com/corporate/en/legal/copyright.html
for additional trademark information and notices.
| |
| |
| |
| |
| |
| Group Headquarters |
| SAP
SE |
| Dietmar-Hopp-Allee 16 |
| 69190
Walldorf |
| Germany |
| |
www.sap.com
www.sap.com/investor |
| |
| |
| |
| |
| |
| |
| |
| |
| |
| |
| |
| |
| |
| |
| |
| |
| |
| |
| |
| |
| |
| |
| |
| |
| |
| |
| |
| |
| |
| |
|
| |
| |
| |
SAP (NYSE:SAP)
Historical Stock Chart
From Jan 2025 to Feb 2025

SAP (NYSE:SAP)
Historical Stock Chart
From Feb 2024 to Feb 2025

