Gulf & Pacific Equities Reports First Quarter Results
28 May 2010 - 11:01PM
Marketwired Canada
NOT FOR DISTRIBUTION TO U.S. WIRE SERVICES OR FOR DISTRIBUTION INTO THE UNITED
STATES


Gulf & Pacific Equities Corp. (TSX VENTURE:GUF) an established company focused
on the acquisition, management and development of anchored shopping centres in
Western Canada, is pleased to announce the first quarter 2010 revenues of
$931,531 up from $914,331 in the same quarter last year, representing a 1.9%
increase.


Details of the three months financial results for fiscal 2010 and 2009 as
summarized below are also available at www.sedar.com or at the company's website
www.gpequities.com.


                                                         Three Months Ended
                                                             (Unaudited)
                                                              March 31,
                                                          2010         2009
                                                 ---------------------------
Revenue                                            $   931,531  $   914,331
Loss for the period                                $  (176,688) $  (241,669)
Loss per common share - basic and diluted          $     (0.02) $     (0.03)
Funds from (Used in) operations for the period     $  (214,336) $   (56,294)
Funds from (Used in) operations per common
 share - basic and diluted                         $     (0.02) $     (0.01)
Weighted average number of common
 shares outstanding during the period
 - basic and diluted                                 8,861,678    8,861,678


Cautionary Statements

This news release contains "forward-looking statements", within the meaning of
the United States Private Securities Litigation Reform Act of 1995 and similar
Canadian legislation, concerning the business, operations and financial
performance and condition of Gulf & Pacific Equities. Forward-looking statements
include, but are not limited to, statements with respect to the benefits of the
offering and option transaction. Generally, these forward-looking statements can
be identified by the use of forward-looking terminology such as "plans",
"expects" or "does not expect", "is expected", "budget", "scheduled",
"estimates", "forecasts", "intends", "anticipates" or "does not anticipate", or
"believes", or variations of such words and phrases or state that certain
actions, events or results "may", "could", "would", "might" or "will be taken",
"occur" or "be achieved". Forward-looking statements are based on the opinions
and estimates of management as of the date such statements are made, and they
are subject to known and unknown risks, uncertainties and other factors that may
cause the actual results, level of activity, performance or achievements of Gulf
& Pacific Equities to be materially different from those expressed or implied by
such forward-looking statements, including but not limited to risks related to:
economic conditions in Western Canada, interest rates, raising less than the
required capital; not realizing on the anticipated benefits from the transaction
or not realizing on such anticipated benefits within the expected time frame;
and other risks of the real estate industry. Although management of Gulf &
Pacific Equities has attempted to identify important factors that could cause
actual results to differ materially from those contained in forward-looking
statements, there may be other factors that cause results not to be as
anticipated, estimated or intended. There can be no assurance that such
statements will prove to be accurate, as actual results and future events could
differ materially from those anticipated in such statements. Accordingly,
readers should not place undue reliance on forward-looking statements. Gulf &
Pacific Equities does not undertake to update any forward-looking statements
that are incorporated by reference herein, except in accordance with applicable
securities laws.
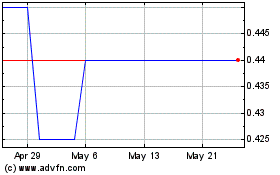
Gulf and Pacific Equities (TSXV:GUF)
Historical Stock Chart
From Jun 2024 to Jul 2024

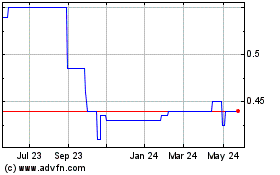
Gulf and Pacific Equities (TSXV:GUF)
Historical Stock Chart
From Jul 2023 to Jul 2024
