The Marketing Alliance, Inc. (Pink Sheets: MAAL) (�TMA�), a
consortium of independent life insurance brokerage general agencies
located throughout the United States, today announced financial
results for its fiscal fourth quarter and year ended March 31,
2008. Timothy M. Klusas, TMA�s President, stated, �We are very
pleased with our operating results for the fourth quarter and
fiscal year ended March 31, 2008. We posted double-digit percentage
increases in revenue and operating income for the fiscal 2008
fourth quarter and year. Fiscal 2008 also marked the third
consecutive year of operating margin improvement, reflecting
further realization of the benefits of a streamlined
infrastructure. We believe that our expanding carrier network and
balance sheet at March 31, 2008, have put us is in position to have
the opportunity to capitalize on future growth initiatives.� Mr.
Klusas continued, �With regards to our annuity business (TMAM), our
wide range of annuity products, service options, and overall
flexibility seem to appeal to agencies looking to expand their
annuity business without incurring significant start-up costs or
capital expenditures. Our new platform, launched in March 2007,
continues to engage agencies as it encourages them to increase
focus on developing their annuity businesses. During the past
fiscal year, we continued to work with existing carriers to further
grow the business and enhance these supplier relationships. We are
now very excited to announce the additions of Prudential Financial
and Transamerica, both of which were added to our network
subsequent to the close of our reporting period. We look forward to
working with these carriers to fully integrate them into our
network, which we have found can take up to 24 months. We remain
encouraged by the recent growth in our life and annuity businesses,
and will continue to strive to nurture new revenue streams that
also create value for our customers.� Mr. Klusas concluded, �Our
investment portfolio has grown substantially over the years, and
our gains in past years and periods have roughly offset our current
losses. While these recent losses impact our earnings, so far they
have not meaningfully impacted our ability to execute our strategic
initiatives. We continue to monitor our investment holdings and are
adjusting for the changing economic environment in an attempt to
reduce the volatility of our returns. Despite this effect on our
earnings, we feel fortunate to have a strong balance sheet in this
economy and operating environment.� FISCAL 2008 FOURTH QUARTER
REVIEW Total revenues for the three-month period ended March 31,
2008 increased 34% to $4.3 million from $3.2 million for the
three-month period ended March 31, 2007. The increase in revenues
was due to favorable timing as well as increased revenues from new
additions to the Company�s carrier network in the last three years.
Distributor bonus and commissions increased to $1.6 million from
$690,000 in the same period last year, due primarily to increases
in revenue and customers thriving in new incentive programs.
Benefits and processing expenses declined to $702,000, or 16.4% of
revenues, from $746,000, or 23.3% of revenues, in the fourth
quarter of fiscal 2007, due to TMA�s continued focus on
centralization and economies of scale. Net operating revenue (gross
profit) grew 14% to $2.0 million from $1.8 million in the
comparable fiscal 2007 period. Operating expenses as a percentage
of revenues declined to 19.7% from 25.7% in the prior year�s fourth
quarter, as higher revenues and lower processing costs offset the
rise in bonuses and commissions. Operating income rose 23% to $1.2
million, or 27.1% of revenues, from operating income of $941,000,
or 29.4% of revenues for the prior fourth quarter. Realized and
unrealized loss on investments of $602,000 compared to a realized
and unrealized loss of $35,000 for the fourth quarter of fiscal
2007. The wider loss in the current year period was attributable to
current market conditions. Net income for the fiscal 2008 fourth
quarter was $342,000, or $0.18 per share, based on 1.95 million
shares outstanding, as compared to net income of $637,000, or $0.32
per share, based on 2.0 million shares outstanding, for the fiscal
2007 fourth quarter. The decrease in shares outstanding is due to
the Company�s execution of its share repurchase program. FISCAL
2008 ANNUAL REVIEW As a result of the factors listed above, total
revenues for fiscal 2008 increased 10% to $16.6 million versus
$15.0 million in fiscal 2007. Distributor and bonus commissions
rose to $9.3 million from $8.0 million. Benefits and processing
expenses declined to $2.5 million, or 15.2% of revenues, from $2.8
million, or 18.8% of revenues last year. Fiscal 2008 net operating
revenue (gross profit) increased to $4.8 million, or 28.7% of
revenues, from $4.2 million, or 28.2% of revenue. Fiscal 2008
operating income increased 53% to $2.1 million, or 12.4% of
revenues, from $1.3 million, or 9.0% of revenues, in fiscal 2007.
TMA reported fiscal 2008 net income of $522,000, or $0.27 per
share, as compared to net income of $888,000, or $0.44 per share,
in fiscal 2007. SELECTED OTHER FINANCIAL INFORMATION TMA�s balance
sheet at March 31, 2008 reflected cash of $1.7 million, working
capital of $3.8 million and no long-term debt. Shareholders� equity
at March 31, 2008 totaled $4.1 million. On January 31, 2008, TMA
paid a $0.21 per share cash dividend for shareholders of record on
December 1, 2007. This is the latest dividend payment to
shareholders and an increase of 24% over last year�s cash dividend
of $0.17 per share. ABOUT THE MARKETING ALLIANCE, INC.
Headquartered in St. Louis, MO, TMA is one of the largest
organizations providing support to independent insurance brokerage
agencies, with a goal of providing members value-added services on
a more efficient basis than they can achieve individually. TMA�s
network is comprised of independent life brokerage and general
agencies in 43 states. Investor information can be accessed through
the shareholder section of TMA�s website at
http://www.themarketingalliance.com/si_who.cfm. TMA stock is quoted
in the �pink sheets� (www.pinksheets.com) under the symbol �MAAL�.
FORWARD LOOKING STATEMENT Investors are cautioned that
forward-looking statements involve risks and uncertainties that may
affect TMA's business and prospects. Any forward-looking statements
contained in this press release represent our estimates only as of
the date hereof, or as of such earlier dates as are indicated, and
should not be relied upon as representing our estimates as of any
subsequent date. These statements involve a number of risks and
uncertainties, including, but not limited to, general changes in
economic conditions. While we may elect to update forward-looking
statements at some point in the future, we specifically disclaim
any obligation to do so. CONSOLIDATED STATEMENT OF OPERATIONS � � �
Quarter Ended Year to Date 3 Months Ended 12 Months Ended 3/31/2008
3/31/2007 3/31/2008 3/31/2007 � Revenues $ 4,278,750 � $ 3,199,947
� $ 16,592,849 � $ 15,002,688 � � Distributor Related Expenses
Distributor bonus & commissions paid 1,573,497 690,194
9,306,398 7,963,988 Distributor benefits & processing � 702,144
� � 746,456 � � 2,523,122 � � 2,814,959 � Total � 2,275,641 � �
1,436,650 � � 11,829,520 � � 10,778,947 � � Net Operating Revenue
2,003,109 1,763,297 4,763,329 4,223,741 � � Operating Expenses �
842,528 � � 822,384 � � 2,699,519 � � 2,875,577 � � Operating
Income 1,160,581 940,913 2,063,810 1,348,164 � Other Income
(Expense) Interest & dividend income [net] 31,341 25,595
103,800 55,733 Realized & unrealized gains [losses]on
investments (net) (601,815 ) (35,150 ) (1,295,397 ) (40,679 ) �
Interest expense � (5,466 ) � (1,354 ) � (7,529 ) � (15,762 ) �
Income (Loss) Before Provision for Income Tax 584,641 930,004
864,684 1,347,456 � Benefit (Provision) for income taxes � (242,844
) � (293,424 ) � (342,244 ) � (459,424 ) � Net Income (Loss) �
341,797 � $ 636,580 � $ 522,440 � $ 888,032 � � Average Shares
Outstanding 1,945,702 2,001,360 1,945,702 2,001,360 � Operating
Income per Share $ 0.60 $ 0.47 $ 1.06 $ 0.67 Net Income (Loss) per
Share $ 0.18 $ 0.32 $ 0.27 $ 0.44 CONSOLIDATED SELECTED BALANCE
SHEET ITEMS � � As of � Assets 3/31/2008 3/31/2007 Current Assets
Cash $ 1,709,172 $ 1,283,240 Receivables 4,529,119 4,389,604
Investments 2,256,120 2,715,997 Other � 421,698 � 140,488 Total
Current Assets 8,916,109 8,529,329 � Other Non Current Assets �
289,792 � 367,570 � Total Assets $ 9,205,901 $ 8,896,899 �
Liabilities & Stockholders' Equity � Total Current Liabilities
$ 5,084,543 $ 4,707,408 � Total Liabilities 5,084,543 4,707,408 �
Stockholders' Equity � 4,121,358 � 4,189,491 � Liabilities &
Stockholders' Equity $ 9,205,901 $ 8,896,899
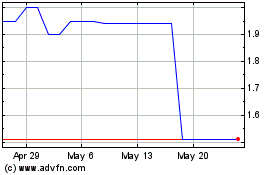
Marketing Alliance (PK) (USOTC:MAAL)
Historical Stock Chart
From Jun 2024 to Jul 2024

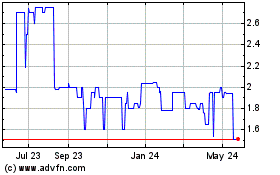
Marketing Alliance (PK) (USOTC:MAAL)
Historical Stock Chart
From Jul 2023 to Jul 2024
