
We could not find any results for:
Make sure your spelling is correct or try broadening your search.

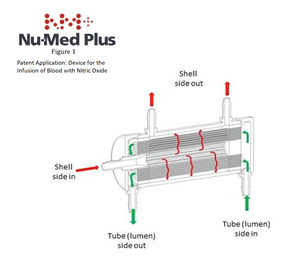
The mission of NU-MED is to design, develop, and market technologies in the medical device field. Our technologies will focus on market niches in high growth trend areas. We hope each developed technology will fill a current need in medical procedures by improving upon an existing technology or devi... The mission of NU-MED is to design, develop, and market technologies in the medical device field. Our technologies will focus on market niches in high growth trend areas. We hope each developed technology will fill a current need in medical procedures by improving upon an existing technology or device, or by designing a device to serve a need that is clearly defined and acknowledged by medical professionals. Show more


| Period | Change | Change % | Open | High | Low | Avg. Daily Vol | VWAP | |
|---|---|---|---|---|---|---|---|---|
| 1 | 0.00095 | 9.40594059406 | 0.0101 | 0.01105 | 0.0101 | 4637 | 0.01053776 | CS |
| 4 | 0.000175 | 1.6091954023 | 0.010875 | 0.0135 | 0.01 | 7787 | 0.01036538 | CS |
| 12 | -0.003725 | -25.2115059222 | 0.014775 | 0.018905 | 0.0095 | 28036 | 0.0123489 | CS |
| 26 | -0.05395 | -83 | 0.065 | 0.065 | 0.0095 | 35374 | 0.02727385 | CS |
| 52 | -0.016 | -59.1497227357 | 0.02705 | 0.09 | 0.0095 | 40072 | 0.04605062 | CS |
| 156 | -0.01195 | -51.9565217391 | 0.023 | 0.09 | 0.009 | 173995 | 0.03109932 | CS |
| 260 | -0.43895 | -97.5444444444 | 0.45 | 2.5 | 0.009 | 112247 | 0.04016328 | CS |
 Double-K
6 months ago
Double-K
9 months ago
Double-K
6 months ago
Double-K
9 months ago
 oldman69
9 months ago
oldman69
9 months ago
oldman69
9 months ago
oldman69
9 months ago
oldman69
9 months ago
oldman69
10 months ago
oldman69
10 months ago
BurgerKing82
10 months ago
oldman69
10 months ago
BurgerKing82
10 months ago
BurgerKing82
10 months ago
oldman69
10 months ago
BurgerKing82
10 months ago
oldman69
10 months ago
oldman69
10 months ago
JesterPaladin46
12 months ago
JesterPaladin46
12 months ago
JesterPaladin46
12 months ago
JesterPaladin46
12 months ago
Newc
12 months ago
BurgerKing82
12 months ago
jdcpa1
1 year ago
oldman69
9 months ago
oldman69
9 months ago
oldman69
9 months ago
oldman69
9 months ago
oldman69
9 months ago
oldman69
10 months ago
oldman69
10 months ago
BurgerKing82
10 months ago
oldman69
10 months ago
BurgerKing82
10 months ago
BurgerKing82
10 months ago
oldman69
10 months ago
BurgerKing82
10 months ago
oldman69
10 months ago
oldman69
10 months ago
JesterPaladin46
12 months ago
JesterPaladin46
12 months ago
JesterPaladin46
12 months ago
JesterPaladin46
12 months ago
Newc
12 months ago
BurgerKing82
12 months ago
jdcpa1
1 year ago
 Lottalead
1 year ago
Lottalead
1 year ago
Lottalead
1 year ago
Lottalead
1 year ago
Lottalead
1 year ago
Lottalead
1 year ago
ANTI-BAGHOLDER
2 years ago
DDHOUND
2 years ago
ANTI-BAGHOLDER
2 years ago
DDHOUND
2 years ago
JJZander
2 years ago
Newc
2 years ago
ANTI-BAGHOLDER
2 years ago
Lottalead
1 year ago
Lottalead
1 year ago
Lottalead
1 year ago
Lottalead
1 year ago
Lottalead
1 year ago
Lottalead
1 year ago
ANTI-BAGHOLDER
2 years ago
DDHOUND
2 years ago
ANTI-BAGHOLDER
2 years ago
DDHOUND
2 years ago
JJZander
2 years ago
Newc
2 years ago
ANTI-BAGHOLDER
2 years ago
 i_like_bb_stock
2 years ago
i_like_bb_stock
2 years ago
Power_Triangle
2 years ago
i_like_bb_stock
2 years ago
Power_Triangle
2 years ago
Power_Triangle
2 years ago
BOOOOOM
2 years ago
Newc
2 years ago
Power_Triangle
2 years ago
i_like_bb_stock
2 years ago
i_like_bb_stock
2 years ago
Power_Triangle
2 years ago
i_like_bb_stock
2 years ago
Power_Triangle
2 years ago
Power_Triangle
2 years ago
BOOOOOM
2 years ago
Newc
2 years ago
Power_Triangle
2 years ago
 Hercules1
2 years ago
Power_Triangle
2 years ago
Hercules1
2 years ago
Hercules1
2 years ago
Hercules1
2 years ago
Power_Triangle
2 years ago
Hercules1
2 years ago
Hercules1
2 years ago

It looks like you are not logged in. Click the button below to log in and keep track of your recent history.
Support: +44 (0) 203 8794 460 | support@advfn.com
By accessing the services available at ADVFN you are agreeing to be bound by ADVFN's Terms & Conditions

 Hot Features
