TIDMJAN
RNS Number : 0229O
Jangada Mines PLC
15 May 2018
Jangada Mines plc / EPIC: JAN.L / Market: AIM / Sector:
Mining
15 May 2018
Jangada Mines plc ('Jangada' or the 'Company')
Substantial Resources Increase at Pedra Branca PGM Project
Jangada Mines plc, a natural resources company developing South
America's largest and most advanced platinum group metals ('PGM')
project, is pleased to announce a substantial increase of the JORC
compliant mineral resources at its Pedra Branca PGM project ('Pedra
Branca' or 'the Project') in north-eastern Brazil, which enhances
the already positive economics of the Project.
Overview
-- Independently assessed, substantial JORC resource increases across commodity basket
o 50% increase in global ore volume to 34.5 million tonnes at
1.3 g/t PGM+Au
o 53% increase in PGM resource to 1.45 million ounces
o 28% increase in nickel resource to 140 million pounds
o 11% increase in copper resource to 26 million pounds
o 4% increase in cobalt resource to 6.7 million pounds
-- Increase in resources obtained from the inclusion of the
Santo Amaro prospect to inferred resources
-- Six more known targets to be evaluated across the
50,000-hectare licence, providing the potential for additional
major upside in future resource figures
-- Metallurgical test work results expected soon closely
followed by the publication of further technical assessment
-- Scale, polymetallic nature and jurisdiction, increase wider
industry importance of Pedra Branca
Brian McMaster, Executive Chairman of Jangada, said: "The
increase in the JORC resource by half a million ounces of PGMs and
the strengthening of major base metal credits including nickel,
copper and cobalt, all significant commodities in the electric
battery economy, are expected to have a major material impact on
the already positive economics of Pedra Branca. Importantly, we
have a further six known targets to explore which, with the overall
district expansion potential, translates to Pedra Branca being
potentially much larger and of significantly greater value than
originally anticipated.
"With the increase in scale and the realisation of significant
base metal credits, we have been working hard to understand the
Project's true potential and its optimal development path.
Metallurgical test work including flow sheets will be published
imminently, which will be closely followed by the publication of
further technical assessment.
"We believe this is an industry important project given that
it's not located in the increasingly expensive, and geopolitical
turbulent, historical areas of PGM exploitation; and it has scale,
grade and credits. We are therefore excited about its development
path and look forward to quantifying further value, which has
already been transformed since listing."
Further information on the Project and resource upgrade
Pedra Branca is the largest and most advanced PGM project in
South America, located 280 km from the port city of Fortaleza in
the northeast of Brazil and holding three mining licences and 43
exploration licences over an area of 50,000 hectares. Following the
evaluation of the Santo Amaro prospect, the JORC (2012) compliant
resource has been increased to approximately 1.45 million ounces of
PGM+Au at a grade of 1.3g/t PGM+Au (2.5 g/t Pd Eq), 140 million
pounds of nickel, 26 million pounds of copper and 6.7 million
pounds of cobalt. Importantly, the Company has six more known
targets across the licence providing the potential for additional
major upside in future resource figures.
Please see the below table, prepared by independent consultants,
GE21 Consultoria Mineral Ltda ("GE21"), for a breakdown of the
resources by prospect and category at the Project.
 Grade Tonnage Table - Pedra Branca Deposit -
               Mineral Resources
 Block Model: 20m X 20m X 2m (5m X 5m X 0.5m)
   Equivalent Gold Cut-Off Grade: 0.30 g/t
---------------------------------------------


    Cedro                  Tonnes    PGM     Pd      Pt      Au      Cu      Ni     Cr2O3(%)     Co       PGM     Pd      Pt      Au
                            (kt)    (g/t)   (g/t)   (g/t)   (g/t)    (%)     (%)                (g/t)    (koz)   (koz)   (koz)   (koz)
  ---------  -----------  -------  ------  ------  ------  ------  ------  ------  ---------  --------  ------  ------  ------  ------
         Indicated         3 798    1.066   0.665   0.383   0.018   0.043   0.196    0.789     118.73    130.2   81.2    46.8     2.2
   ---------------------  -------  ------  ------  ------  ------  ------  ------  ---------  --------  ------  ------  ------  ------
          Inferred         2 003    1.522   0.934   0.569   0.019   0.032   0.179    0.812     109.40    98.0    60.2    36.6     1.2
   ---------------------  -------  ------  ------  ------  ------  ------  ------  ---------  --------  ------  ------  ------  ------

    Curiu      Measured    1 061    2.091   1.043   0.957   0.091   0.038   0.218    1.156     130.123   71.3    35.6    32.6     3.1
  ---------  -----------  -------  ------  ------  ------  ------  ------  ------  ---------  --------  ------  ------  ------  ------
         Indicated          382     2.046   1.035   0.893   0.119   0.037   0.199    2.382     122.121   25.1    12.7    11.0     1.5
   ---------------------  -------  ------  ------  ------  ------  ------  ------  ---------  --------  ------  ------  ------  ------
          Inferred           37     2.967   1.550   1.294   0.123   0.056   0.206    2.099     109.791    3.5     1.8     1.5     0.1
   ---------------------  -------  ------  ------  ------  ------  ------  ------  ---------  --------  ------  ------  ------  ------

   Esbarro     Measured    2 985    1.316   0.863   0.428   0.025   0.047   0.249    1.145     139.677   126.3   82.8    41.1     2.4
  ---------  -----------  -------  ------  ------  ------  ------  ------  ------  ---------  --------  ------  ------  ------  ------
         Indicated         7 126    1.206   0.771   0.405   0.031   0.047   0.227    0.600     128.516   276.3   176.6   92.8     7.1
   ---------------------  -------  ------  ------  ------  ------  ------  ------  ---------  --------  ------  ------  ------  ------
          Inferred          495     0.996   0.549   0.424   0.023   0.056   0.178    0.276     109.553   15.9     8.7     6.7     0.4
   ---------------------  -------  ------  ------  ------  ------  ------  ------  ---------  --------  ------  ------  ------  ------

    Trapia    Indicated    2 529    1.113   0.639   0.422   0.052   0.055   0.216    0.910     133.035   90.5    52.0    34.3     4.2
  ---------  -----------  -------  ------  ------  ------  ------  ------  ------  ---------  --------  ------  ------  ------  ------
          Inferred         2 717    1.320   0.605   0.616   0.099   0.045   0.202    1.184     122.955   115.3   52.9    53.8     8.6
   ---------------------  -------  ------  ------  ------  ------  ------  ------  ---------  --------  ------  ------  ------  ------

                                                                  Santo
     Amaro     Inferred    11 380   1.360   0.650   0.690   0.020   0.010   0.120    0.710     105.870   497.0   237.0   252.0    7.0
  ---------  -----------  -------  ------  ------  ------  ------  ------  ------  ---------  --------  ------  ------  ------  ------

    Total      Meas+Ind    17 881   1.252   0.767   0.450   0.036   0.047   0.221    0.846     128.898   719.7   440.9   258.6   20.5
  ---------  -----------  -------  ------  ------  ------  ------  ------  ------  ---------  --------  ------  ------  ------  ------
          Inferred         16 632   1.366   0.676   0.657   0.033   0.020   0.142    0.790     109.205   729.7   360.6   350.7   17.4
   ---------------------  -------  ------  ------  ------  ------  ------  ------  ---------  --------  ------  ------  ------  ------
--------------------------------------------------------------------------------------------------------------------------------------
Competent Person Statement
The information in this statement which relates to the Mineral
Resource is based on information compiled by Mr Porfirio Cabaleiros
Rodriquez who is a mining engineer and full-time director and owner
of GE21 and is registered as a Competent Person with the MAIG. Mr
Rodriquez has sufficient relevant experience to the style of
mineralisation to qualify as a Competent Person as defined in the
JORC Code (2012). Mr Rodriquez also meets the requirements of a
qualified person under the AIM Note for Mining, Oil and Gas
Companies.
Cautionary Statements
The reader is cautioned that a Mineral Resource is an estimate
only and not a precise and completely accurate calculation, being
dependent on the interpretation of the limited information on the
location, shape, and the continuity of the occurrence and the
available sampling results. Actual mineralisation can be more or
less than estimated depending upon the actual geological
conditions. Mineral Resources are not Mineral Reserves and do not
have demonstrated economic viability. No Mineral Reserves are being
stated.
This announcement contains inside information for the purposes
of Article 7 of EU Regulation 596/2014.
ENDS
For further information, please visit www.jangadamines.com or
contact:
 Jangada Mines plc                   E: info@jangadamines.com

 Strand Hanson Limited (Financial           T: +44 (0)20 7409
  & Nominated Adviser)                                   3494
  James Spinney / Ritchie Balmer
  / Jack Botros

 Brandon Hill (Broker)                      T: +44 (0)20 3463
  Jonathan Evans/Oliver Stansfield                       5000

 St Brides Partners Ltd (Financial          T: +44 (0)20 7236
  PR)                                                    1177
  Isabel de Salis/Gaby Jenner
This information is provided by RNS
The company news service from the London Stock Exchange
END
MSCSFDFILFASEEI
(END) Dow Jones Newswires
May 15, 2018 02:00 ET (06:00 GMT)
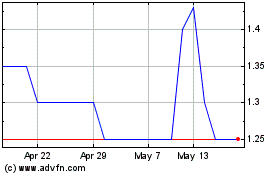
Jangada Mines (LSE:JAN)
Historical Stock Chart
From Jun 2024 to Jul 2024

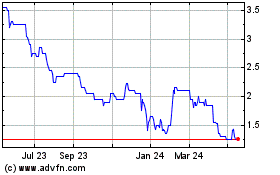
Jangada Mines (LSE:JAN)
Historical Stock Chart
From Jul 2023 to Jul 2024
