Corbion first half-year 2022 results
10 August 2022 - 3:00PM

Corbion first half-year 2022 results
Corbion reported net sales of €
687.4 million in
H1 2022.
Organic net sales growth was
23.4% for the first
half year. Adjusted EBITDA in
H1 2022
increased by
16.6% to € 89.9
million.
Olivier Rigaud, CEO, commented: “We are proud to have delivered
strong growth in sales and EBITDA during a period of unprecedented
cost inflation and supply chain disruptions. Given that we are
prioritizing price increases and mix improvements, we are
encouraged to see that this has not led to adverse volume impact.
This confirms the strength of our differentiated portfolio. I am
happy to report that our AlgaPrime DHA business has been profitable
as of June. Looking forward, we are on track to substantially
improve our absolute Adjusted EBITDA for the company compared to
last year, as we continue to adapt to the inflationary environment
with price adjustments, and the realization of operational
efficiencies. Given our growth prospects, we continue to invest in
our production capabilities. Our major investment initiatives are
progressing well and according to plan. We remain confident on the
delivery of our Advance 2025 targets.
We are clearly ahead of schedule on reducing greenhouse gas
emissions. As we already achieved our 2025 CO2 reduction target, we
have increased our commitment by submitting updated 1.5°C targets
to the Science Based Targets initiative, in line with the most
ambitious goal of the Paris Agreement.
Key financial highlights H1
2022*:
- Total net sales was € 687.4 million (H1 2021: € 515.6
million)
- Net sales organic growth was 23.4%. Core net sales organic
growth: 23.0%
- Adjusted EBITDA was € 89.9 million (H1 2021: € 77.1 million;
organic growth: -0.4%)
- Adjusted EBITDA margin was 13.1% (H1 2021: 15.0%)
- Operating result was € 59.1 million (H1 2021: € 70.3
million)
- Free cash flow was € -68.6 million (H1 2021: € -13.6
million)
- Covenant net debt/covenant EBITDA at half year-end was 3.3x
(year-end 2021: 2.6x)
|
€ million |
YTD 2022 |
YTD 2021 |
Total growth |
Organic growth |
|
Net sales |
687.4 |
515.6 |
33.3% |
23.4% |
|
Adjusted EBITDA |
89.9 |
77.1 |
16.6% |
-0.4% |
|
Adjusted EBITDA margin |
13.1% |
15.0% |
|
|
|
Operating result |
59.1 |
70.3 |
-15.9% |
-32.3% |
|
ROCE |
10.9% |
13.0% |
|
|
- 20220810 Corbion 2Q22 ENG
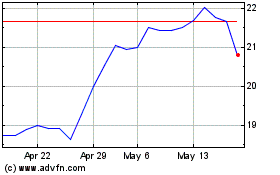
Corbion N.V (EU:CRBN)
Historical Stock Chart
From Dec 2024 to Jan 2025

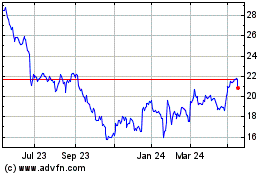
Corbion N.V (EU:CRBN)
Historical Stock Chart
From Jan 2024 to Jan 2025
