
We could not find any results for:
Make sure your spelling is correct or try broadening your search.

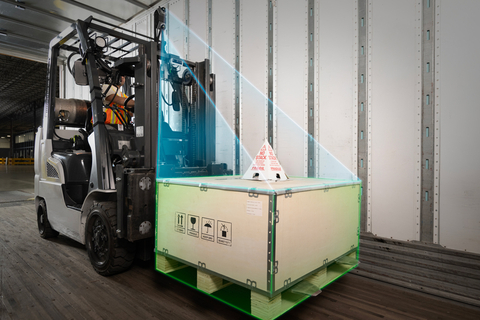
ArcBest Corp is engaged in logistics operations. The company operates in three business segments namely Asset-Based, ArcBest and FleetNet. Asset-Based segment operates a less-than-truckload (LTL) network across North America to provide freight transportation services. It consists of ABF Freight Syst... ArcBest Corp is engaged in logistics operations. The company operates in three business segments namely Asset-Based, ArcBest and FleetNet. Asset-Based segment operates a less-than-truckload (LTL) network across North America to provide freight transportation services. It consists of ABF Freight System, Inc and certain other subsidiaries. ArcBest segment revenues consist primarily of asset-light logistics services using third-party vendors to provide transportation services. FleetNet segment revenues consist of service fee revenue, roadside repair revenue, and routine maintenance services revenue. The ArcBest and FleetNet reportable segments, combined, represent its Asset-Light operations. Show more


| Period | Change | Change % | Open | High | Low | Avg. Daily Vol | VWAP | |
|---|---|---|---|---|---|---|---|---|
| 1 | -5.3 | -6.66750534658 | 79.49 | 80.22 | 71.57 | 323111 | 74.98444921 | CS |
| 4 | -17.68 | -19.2445847393 | 91.87 | 96.229 | 71.57 | 354052 | 84.48546476 | CS |
| 12 | -34.26 | -31.5905947441 | 108.45 | 109.975 | 71.57 | 307108 | 91.52238614 | CS |
| 26 | -25.34 | -25.4596604039 | 99.53 | 123.255 | 71.57 | 283789 | 100.34140234 | CS |
| 52 | -62.81 | -45.8467153285 | 137 | 153.605 | 71.57 | 288843 | 110.42622377 | CS |
| 156 | -10.81 | -12.7176470588 | 85 | 153.605 | 65.155 | 300216 | 99.86774023 | CS |
| 260 | 54.33 | 273.564954683 | 19.86 | 153.605 | 13.54 | 294987 | 86.35274621 | CS |

It looks like you are not logged in. Click the button below to log in and keep track of your recent history.
Support: +44 (0) 203 8794 460 | support@advfn.com
By accessing the services available at ADVFN you are agreeing to be bound by ADVFN's Terms & Conditions

 Hot Features


