The research-based product has attracted over
$1 billion in client assets due to consistently strong
performance
Columbia Threadneedle Investments recently celebrated the
five-year anniversary of its equity exchange-traded fund (ETF)—the
Columbia Research Enhanced Core ETF (NYSE Arca: RECS). In the five
years since its launch, RECS has attracted more than $1 billion in
client assets due to consistently strong performance.
RECS has outperformed its performance benchmark, the Russell
1000 Index®, through its unique rules-based approach that
emphasizes the application of proprietary investment research.1
This approach aims to optimize the ETF’s core equity exposure by
eliminating stocks from the performance benchmark that are rated
unfavorably by the Columbia Threadneedle quantitative research
team. In doing so, this strategy addresses a key issue expressed by
recently surveyed financial advisors -- nearly 9-in-10 advisors
feel frustrated with not being able to remove underperforming
stocks in their index investments.2
“Our goal when we launched RECS was to take a common-sense
research approach to US large capitalization core investing and
clearly that goal is still resonating today,” said Marc Zeitoun,
Head of North America Product and Business Intelligence. “Five
years later, strong returns and positive investor response have
encouraged us to further broaden our research-enhanced offering
across other asset classes and to offer the strategy in other
wrappers, such as retail SMAs.”
Driven by strong performance, RECS boasts a 5-star Overall
Morningstar Rating, with its returns falling within the top 10% of
Morningstar’s U.S. Large Blend category for the five-year time
period ending on September 30, 2024. Launched in September 2019,
this ETF offers a cost-effective and tax-efficient solution to
investors seeking core equity exposure and has earned a Morningstar
Medalist Rating of Silver. RECS has a total expense ratio of
0.15%.3
RECS is managed by Christopher Lo, Head of Managed and Indexed
Portfolio Solutions, Jason Wang, Head of Quantitative Research, and
Henry Hom, Senior Portfolio Manager. The rules-based approach
designed by the team uses Columbia Threadneedle’s proprietary
quantitative investment models to evaluate and categorize companies
in the Russell 1000 Index®. These models are designed to rate each
company based on quality, value, and catalyst factors, including
favorably rated securities while excluding those that do not meet
the criteria.
“RECS seeks to generate alpha through the elimination of names
that our quantitative models rate unfavorably – an approach that is
often overlooked in favor of overweighting stocks with a positive
view,” added Lo, who has been managing the Fund since its
inception. “As evidenced by it crossing the $1 billion threshold in
client assets, RECS is a powerful example of the value that
Columbia Threadneedle’s strong quantitative research and investment
expertise can generate for investors.”
As of September 30, 2024, the RECS ETF contained 357 US
large-cap stocks, across growth and value, each
market-capitalization weighted.
Ratings and rankings4
Time Period
Overall
1-Year
3-Year
5-Year
Percentile Ranking
16%
19%
9%
10%
# of Peers
1292
1414
1292
1292
Star Rating
5
-
5
5
About Columbia Threadneedle
Investments
Columbia Threadneedle Investments is a leading global asset
manager that provides a broad range of investment strategies and
solutions for individual, institutional and corporate clients
around the world. With more than 2,500 people, including over 650
investment professionals based in North America, Europe and Asia,
we manage $642 billion of assets across developed and emerging
market equities, fixed income, asset allocation solutions and
alternatives.5
Columbia Threadneedle Investments is the global asset management
group of Ameriprise Financial, Inc. (NYSE: AMP). For more
information, please visit columbiathreadneedleus.com.
Columbia Threadneedle Investments (Columbia Threadneedle) is the
global brand name of the Columbia and Threadneedle group of
companies.
1 Rules are as defined in the Columbia Threadneedle custom
index, the Beta Advantage® Researched Enhanced U.S. Equity Index
(the RECS Index) 2 Columbia Threadneedle Investments ETF Survey
conducted in November 2023 of 172 financial advisors 3 Morningstar,
as of September 2024 4 Based on Morningstar category: Large Blend,
as of September 30, 2024 5 As of June 30, 2024
Past performance does not guarantee future results.
Investors should consider the investment objectives, risks,
charges and expenses of a mutual fund carefully before investing.
For a free prospectus or a summary prospectus, which contains this
and other important information about the funds, visit
www.columbiathreadneedleus.com/investor/. Read the prospectus
carefully before investing.
Investing involves risks, including the risk of loss of
principal. Market risk may affect a single issuer, sector of
the economy, industry or the market as a whole. The fund is
passively managed and seeks to track the performance of an
index. The fund’s use of a “representative sampling” approach in
seeking to track the performance of its index (investing in only
some of the components of the index that collectively are believed
to have an investment profile similar to that of the index) may not
allow the fund to track its index with the same degree of accuracy
as would an investment vehicle replicating the entire Index. There
is no guarantee that the index and, correspondingly, the fund will
achieve positive returns. Risk exists that the index provider may
not follow its methodology for index construction. Errors
may result in a negative fund performance. The fund’s net
value will generally decline when the market value of its
targeted index declines. The fund concentrates its
investments in issuers of one or more particular industries to the
same extent as the underlying index. Investments in a narrowly
focused sector may exhibit higher volatility than investments with
a broader focus. Investments selected using quantitative
methods may perform differently from the market as a whole and
may not enable the fund to achieve its objective. Investment in
larger companies may involve certain risks associated with
their larger size and may be less able to respond quickly to new
competitive challenges than smaller competitors. Investments in
mid-cap companies often involve greater risks that
investments in larger companies and may have less predictable
earning and be less liquid than the securities of larger firms.
Growth securities, at times, may not perform as well as
value securities or the stock market in general and may be out of
favor with investors. Although the fund’s shares are listed on an
exchange, there can be no assurance that an active, liquid
or otherwise orderly trading market for shares will be established
or maintained. The Fund may have portfolio turnover, which
may cause an adverse cost impact. There may be additional
portfolio turnover risk as active market trading of the
fund’s shares may cause more frequent creation or redemption
activities that could, in certain circumstances, increase the
number of portfolio transactions as well as tracking error to the
Index and as high levels of transactions increase brokerage and
other transaction costs and may result in increased taxable capital
gains. This fund is new and has limited operating history.
Morningstar category percentile rankings: Morningstar
Ranking/Number of Funds in Category displays the Fund's actual rank
within its Morningstar Category based on average annual total
return and number of funds in that Category. The returns assume
reinvestment of dividends and do not reflect any applicable sales
charge. Absent expense limitation, total return would be less.
Morningstar Percentile Rankings are the Fund's total return rank
relative to all funds in the same Morningstar category, where 1 is
the highest percentile and 100 is the lowest percentile.
Morningstar Percentile Rankings are based on the average annual
total returns of the funds in the category for the periods stated.
They do not include sales charges or redemption fees but do include
operating expenses and the reinvestment of dividends and capital
gains distributions. Share class rankings vary due to different
expenses. If sales charges or redemption fees were included, total
returns would be lower.
Morningstar category percentile rankings: Morningstar
Ranking/Number of Funds in Category displays the Fund's actual rank
within its Morningstar Category based on average annual total
return and number of funds in that Category. The returns assume
reinvestment of dividends and do not reflect any applicable sales
charge. Absent expense limitation, total return would be less.
Morningstar Percentile Rankings are the Fund's total return rank
relative to all funds in the same Morningstar category, where 1 is
the highest percentile and 100 is the lowest percentile.
For each fund with at least a three-year history, Morningstar
calculates a Morningstar Rating™ used to rank the fund against
other funds in the same category. It is calculated based on a
Morningstar Risk-Adjusted Return measure that accounts for
variation in a fund’s monthly excess performance, without any
adjustments for loads (front-end, deferred, or redemption fees),
placing more emphasis on downward variations and rewarding
consistent performance. Exchange-traded funds and open-ended mutual
funds are considered a single population for comparative purposes.
The top 10% of funds in each category receive 5 stars, the next
22.5% receive 4 stars, the next 35% receive 3 stars, the next 22.5%
receive 2 stars and the bottom 10% receive 1 star. (Each share
class is counted as a fraction of one fund within this scale and
rated separately, which may cause slight variations in the
distribution percentages.) The Overall Morningstar Rating for a
fund is derived from a weighted average of the performance figures
associated with its three-, five- and ten-year (if applicable)
Morningstar Rating metrics.
The Morningstar Medalist Ratings are not statements of fact, nor
are they credit or risk ratings. The Morningstar Medalist Rating
(i) should not be used as the sole basis in evaluating an
investment product, (ii) involves unknown risks and uncertainties
which may cause expectations not to occur or to differ
significantly from what was expected, (iii) are not guaranteed to
be based on complete or accurate assumptions or models when
determined algorithmically, (iv) involve the risk that the return
target will not be met due to such things as unforeseen changes in
changes in management, technology, economic development, interest
rate development, operating and/or material costs, competitive
pressure, supervisory law, exchange rate, tax rates, exchange rate
changes, and/or changes in political and social conditions, and (v)
should not be considered an offer or solicitation to buy or sell
the investment product. A change in the fundamental factors
underlying the Morningstar Medalist Rating can mean that the rating
is subsequently no longer accurate.
©2024 Morningstar, Inc. All rights reserved. The Morningstar
information contained herein: (1) is proprietary to Morningstar
and/or its content providers; (2) may not be copied or distributed;
and (3) is not warranted to be accurate, complete or timely.
Neither Morningstar nor its content providers are responsible for
any damages or losses arising from any use of this information.
Columbia funds are distributed by Columbia Management Investment
Distributors, Inc., member FINRA, and managed by Columbia
Management Investment Advisers, LLC.
Columbia Management Investment Advisers, LLC serves as the
investment manager to the ETFs. The ETFs are distributed by ALPS
Distributors, Inc., which is not affiliated with Columbia
Management Investment Advisers, LLC or its parent company
Ameriprise Financial, Inc.
AdTrax: CTNA7197122.1 ALPS: CET002237
© 2024 Columbia Management Investment Advisers, LLC. All rights
reserved.
View source
version on businesswire.com: https://www.businesswire.com/news/home/20241021468893/en/
Meghan Shields Meghan.Shields@columbiathreadneedle.com
617.451.0739
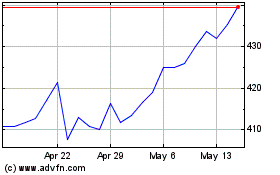
Ameriprise Financial (NYSE:AMP)
Historical Stock Chart
From Dec 2024 to Jan 2025

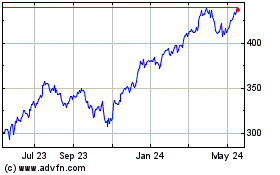
Ameriprise Financial (NYSE:AMP)
Historical Stock Chart
From Jan 2024 to Jan 2025
