
We could not find any results for:
Make sure your spelling is correct or try broadening your search.
BOSTON and ROCHESTER, N.Y., July 31, 2014 (GLOBE NEWSWIRE) -- Lucid, Inc. (OTCQB:LCDX), operating as Caliber Imaging & Diagnostics, today announced that members of its Board of Directors...
BOSTON and ROCHESTER, N.Y., June 11, 2014 (GLOBE NEWSWIRE) -- Caliber Imaging & Diagnostics (OTCQB:LCDX), formerly Lucid, Inc., was featured in two recent media reports. On May 18, Caliber...
BEVERLY HILLS, Calif., June 9, 2014 (GLOBE NEWSWIRE) -- Many people are worried about the appearance of a mole or other lesion on their skin. Those who live in California now have a new option at...
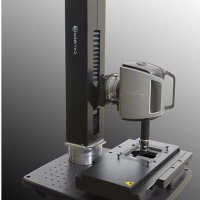
BOSTON and ROCHESTER, N.Y., June 9, 2014 (GLOBE NEWSWIRE) -- Caliber Imaging & Diagnostics (OTCQB:LCDX), formerly Lucid, Inc., has inaugurated its new VivaScan™ skin imaging procedure...
Healthcare Sales and Marketing Executive with More Than 30 Years of Experience Adds Strength to Board Increases Size of Board to Nine Members BOSTON and ROCHESTER, N.Y., May 14, 2014...
BOSTON and ROCHESTER, N.Y., April 9, 2014 (GLOBE NEWSWIRE) -- Caliber Imaging & Diagnostics (OTCQB:LCDX), formerly Lucid, Inc., has received the "Product of the Year 2013" Award from the...
BOSTON and ROCHESTER, N.Y., March 26, 2014 (GLOBE NEWSWIRE) -- Caliber Imaging & Diagnostics (OTCQB:LCDX), formerly Lucid, Inc., has appointed Joseph R. Williams as Vice President of Global...
BOSTON and ROCHESTER, N.Y., March 20, 2014 (GLOBE NEWSWIRE) -- Caliber Imaging & Diagnostics (OTCQB:LCDX), formerly Lucid, Inc., has named Richard C. Christopher as Chief Financial Officer...
BOSTON and ROCHESTER, N.Y., March 13, 2014 (GLOBE NEWSWIRE) -- Caliber Imaging & Diagnostics (OTCQB:LCDX), formerly Lucid, Inc., has named Daniel Koon to Director of Global Sales Support...
BOSTON and ROCHESTER, N.Y., March 10, 2014 (GLOBE NEWSWIRE) -- Caliber Imaging & Diagnostics (OTCQB:LCDX), formerly Lucid, Inc., has named Anthony J. Roberto as East Coast Sales Manager, a...
| Period | Change | Change % | Open | High | Low | Avg. Daily Vol | VWAP | |
|---|---|---|---|---|---|---|---|---|
| 1 | 0 | 0 | 0.02 | 0.02 | 0.02 | 30859 | 0.02 | CS |
| 4 | 0.0199 | 19900 | 0.0001 | 0.02 | 0.0001 | 8283 | 0.01069148 | CS |
| 12 | 0.0198 | 9900 | 0.0002 | 0.02 | 0.0001 | 7261 | 0.00480094 | CS |
| 26 | 0.0199 | 19900 | 0.0001 | 0.02 | 0.0001 | 4680 | 0.00408051 | CS |
| 52 | 0.0199 | 19900 | 0.0001 | 0.02 | 0.0001 | 3051 | 0.00297819 | CS |
| 156 | 0.0197 | 6566.66666667 | 0.0003 | 0.0501 | 0.0001 | 3054 | 0.0013789 | CS |
| 260 | -0.48 | -96 | 0.5 | 6.4 | 0.0001 | 69611 | 1.05811427 | CS |
 georgie18
4 years ago
georgie18
4 years ago
 tmp118
4 years ago
georgie18
4 years ago
Prudent Capitalist
4 years ago
georgie18
4 years ago
georgie18
4 years ago
tmp118
4 years ago
georgie18
4 years ago
Prudent Capitalist
4 years ago
georgie18
4 years ago
georgie18
4 years ago
 Longer Than Most
4 years ago
georgie18
4 years ago
georgie18
4 years ago
Longer Than Most
4 years ago
georgie18
4 years ago
Longer Than Most
4 years ago
georgie18
4 years ago
surfkast
4 years ago
georgie18
4 years ago
surfkast
4 years ago
georgie18
4 years ago
Prudent Capitalist
4 years ago
georgie18
4 years ago
georgie18
4 years ago
Longer Than Most
4 years ago
georgie18
4 years ago
georgie18
4 years ago
Longer Than Most
4 years ago
georgie18
4 years ago
Longer Than Most
4 years ago
georgie18
4 years ago
surfkast
4 years ago
georgie18
4 years ago
surfkast
4 years ago
georgie18
4 years ago
Prudent Capitalist
4 years ago
georgie18
4 years ago
georgie18
4 years ago
 Renee
4 years ago
kofikbaz
4 years ago
makinezmoney
4 years ago
Renee
4 years ago
kofikbaz
4 years ago
makinezmoney
4 years ago
 hyborianwar
4 years ago
dustyd41
4 years ago
Awl416
4 years ago
Prudent Capitalist
4 years ago
makinezmoney
4 years ago
makinezmoney
4 years ago
makinezmoney
4 years ago
Prudent Capitalist
4 years ago
makinezmoney
4 years ago
Prudent Capitalist
4 years ago
makinezmoney
4 years ago
Prudent Capitalist
4 years ago
hyborianwar
4 years ago
dustyd41
4 years ago
Awl416
4 years ago
Prudent Capitalist
4 years ago
makinezmoney
4 years ago
makinezmoney
4 years ago
makinezmoney
4 years ago
Prudent Capitalist
4 years ago
makinezmoney
4 years ago
Prudent Capitalist
4 years ago
makinezmoney
4 years ago
Prudent Capitalist
4 years ago
 davidsson10
4 years ago
hyborianwar
4 years ago
aidytrader
4 years ago
Sligara
4 years ago
Sligara
4 years ago
dustyd41
4 years ago
Prudent Capitalist
4 years ago
dustyd41
4 years ago
dustyd41
4 years ago
hyborianwar
4 years ago
makinezmoney
4 years ago
makinezmoney
4 years ago
haiflyhigh
4 years ago
davidsson10
4 years ago
davidsson10
4 years ago
hyborianwar
4 years ago
aidytrader
4 years ago
Sligara
4 years ago
Sligara
4 years ago
dustyd41
4 years ago
Prudent Capitalist
4 years ago
dustyd41
4 years ago
dustyd41
4 years ago
hyborianwar
4 years ago
makinezmoney
4 years ago
makinezmoney
4 years ago
haiflyhigh
4 years ago
davidsson10
4 years ago
 ALL-IN888
4 years ago
ALL-IN888
4 years ago

It looks like you are not logged in. Click the button below to log in and keep track of your recent history.
Support: +44 (0) 203 8794 460 | support@advfn.com
By accessing the services available at ADVFN you are agreeing to be bound by ADVFN's Terms & Conditions

 Hot Features
