Scottish American Investment Co PLC Net Asset Value(s)
17 December 2024 - 11:25PM
RNS Regulatory News

RNS Number : 4408Q
Scottish American Investment Co PLC
17 December 2024
|
The Scottish American
Investment Company P.L.C. (SAIN)
|
16 December 2024
|
|
Legal
Entity Identifier: 549300NF03XVC5IFB447
|
|
|
|
Cum Par NAV
|
551.99p
|
|
|
|
|
|
|
Cum Fair NAV
|
569.40p
|
|
|
|
|
|
|
Ex Par NAV
|
547.99p
|
|
|
|
|
|
|
Ex Fair NAV
|
565.41p
|
|
|
|
|
|
|
|
|
|
|
The fair value of long term
borrowings is calculated weekly, using methodologies consistent
with the International Private Equity and Venture Capital Valuation
(IPEV) Guidelines.
|
|
|
|
|
|
|
|
Net Asset Values are
unaudited, and calculated in accordance with published accounting
policies and AIC guidelines.
|
|
|
|
|
|
|
|
Cum Par
NAV: Net asset value per share in pence, including income, with
debt at par value.
|
|
|
|
Cum Fair
NAV: Net asset value per share in pence, including income, with
debt at fair value.
|
|
|
|
Ex Par NAV:
Net asset value per share in pence, excluding income, with debt at
par value.
|
|
|
|
Ex Fair
NAV: Net asset value per share in pence, excluding income, with
debt at fair value.
|
|
|
This information is provided by RNS, the news service of the
London Stock Exchange. RNS is approved by the Financial Conduct
Authority to act as a Primary Information Provider in the United
Kingdom. Terms and conditions relating to the use and distribution
of this information may apply. For further information, please
contact
rns@lseg.com or visit
www.rns.com.
RNS may use your IP address to confirm compliance with the terms
and conditions, to analyse how you engage with the information
contained in this communication, and to share such analysis on an
anonymised basis with others as part of our commercial services.
For further information about how RNS and the London Stock Exchange
use the personal data you provide us, please see our
Privacy
Policy.
END
NAVBDBDDDDBDGSR
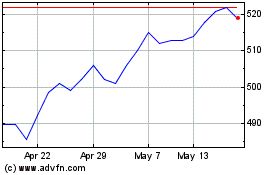
Scottish American Invest... (LSE:SAIN)
Historical Stock Chart
From Nov 2024 to Dec 2024

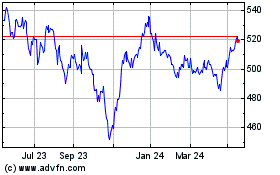
Scottish American Invest... (LSE:SAIN)
Historical Stock Chart
From Dec 2023 to Dec 2024
