Bearish chart pattern hints at $70 Solana (SOL) price before a possible oversold bounce
23 January 2022 - 10:30AM
Cointelegraph

A confirmed head and shoulders pattern on SOL’s daily chart
points toward a drop to $70.
...
Continue reading Bearish chart pattern hints at $70
Solana (SOL) price before a possible oversold bounce
The post
Bearish chart pattern hints at $70 Solana (SOL)
price before a possible oversold bounce appeared first on
CoinTelegraph.
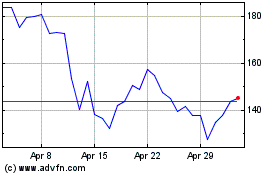
Solana (COIN:SOLUSD)
Historical Stock Chart
From Apr 2024 to May 2024

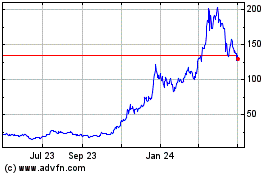
Solana (COIN:SOLUSD)
Historical Stock Chart
From May 2023 to May 2024
