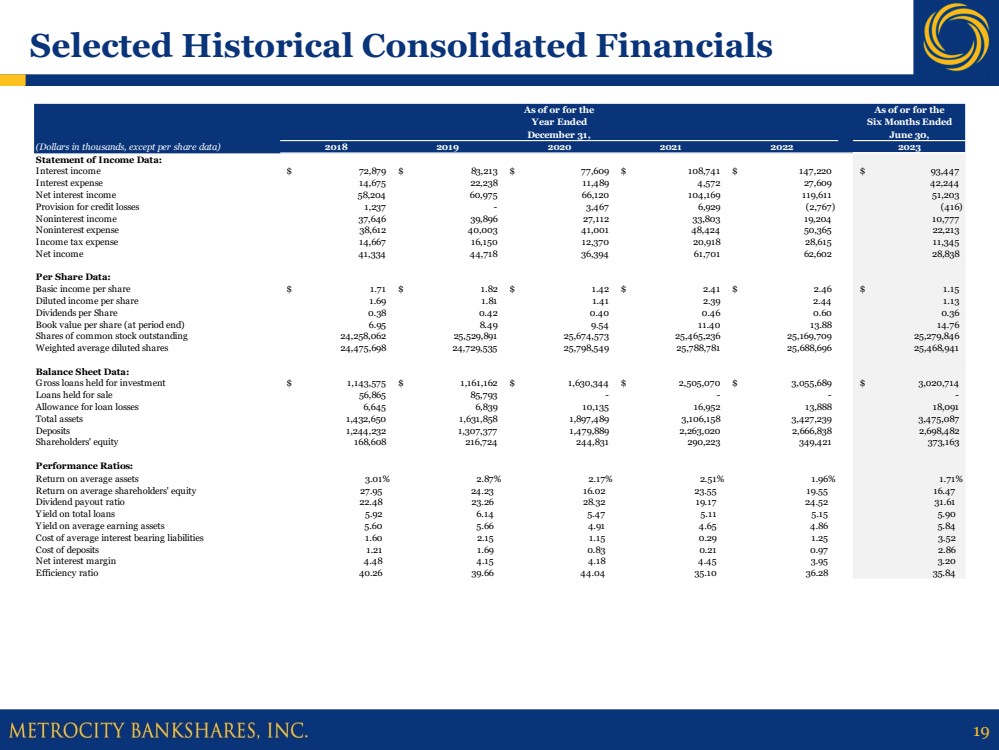
0001747068false00017470682021-08-022021-08-02

UNITED STATES

SECURITIES AND EXCHANGE COMMISSION

WASHINGTON, D.C. 20549

FORM 8-K

CURRENT REPORT

Pursuant to Section 13 or 15(d) of The Securities Exchange Act of 1934

Date of Report (Date of earliest event reported): August 4, 2023

METROCITY BANKSHARES, INC.

(Exact name of registrant as specified in its charter)

Georgia

No. 001-39068

47-2528408

(State or other jurisdiction of
incorporation)

(Commission File Number)

(I.R.S. Employer
Identification No.)

5114 Buford Highway
Doraville, Georgia

30340

(Address of principal executive offices)

(Zip Code)

(770) 455-4989

(Registrant’s telephone number, including area code)

Check the appropriate box below if the Form 8-K filing is intended to simultaneously satisfy the filing obligation of the registrant under any of the following provisions:

Written communications pursuant to Rule 425 under the Securities Act (17 CFR 230.425)

Soliciting material pursuant to Rule 14a-12 under the Exchange Act (17 CFR 240.14a-12)

Pre-commencement communications pursuant to Rule 14d-2(b) under the Exchange Act (17 CFR 240.14d-2(b))

Pre-commencement communications pursuant to Rule 13e-4(c) under the Exchange Act (17 CFR 240-13e-4(c))

Securities registered pursuant to Section 12(b) of the Act:

Title of each class

Trading Symbol(s)

Name of each Exchange on which registered

Common Stock, par value $0.01 per share

MCBS

The Nasdaq Stock Market LLC

Indicate by check mark whether the registrant is an emerging growth company as defined in Rule 405 of the Securities Act of 1933 (§230.405 of this chapter) or Rule 12b-2 of the Securities Exchange Act of 1934 (§240.12b-2 of this chapter).

Emerging growth company     

If an emerging growth company, indicate by check mark if the registrant has elected not to use the extended transition period for complying with any new or revised financial accounting standards provided pursuant to Section 13(a) of the Exchange Act. 

Item 7.01    Regulation FD Disclosure

MetroCity Bankshares, Inc., the holding company for Metro City Bank, is providing a copy of the investor presentation that will be used at the KBW Community Bank Investor Conference on August 8, 2023 and August 9, 2023. A copy of the investor presentation that will be used at the conference is attached to this Form 8-K as Exhibit 99.1 and incorporated herein by reference.

In accordance with General Instruction B.2 of Form 8-K, the information furnished in Item 7.01 and Exhibit 99.1 shall not be deemed “filed” for purposes of Section 18 of the Securities Exchange Act of 1934, as amended (the “Exchange Act”), or otherwise subject to the liability of that section, nor shall it be deemed incorporated by reference in any filing under the Securities Act of 1933, as amended,  or the Exchange Act, except as shall be expressly set forth by specific reference in such filing.

Item 9.01    Financial Statements and Exhibits

(d)         Exhibits

Exhibit No.

Description

99.1

Investor presentation – August 2023

104

Cover Page Interactive Data File (embedded within the Inline XBRL document)

SIGNATURES

Pursuant to the requirements of the Securities Exchange Act of 1934, as amended, the registrant has duly caused this report to be signed on its behalf by the undersigned hereunto duly authorized.

METROCITY BANKSHARES, INC.

Date: August 4, 2023

By:

/s/ Lucas Stewart

Lucas Stewart

Chief Financial Officer

Exhibit 99.1

GRAPHIC

KBW Community Bank Investor Conference NASDAQ: MCBS August 2023

GRAPHIC

2 Disclaimer This presentation contains “forward-looking statements” within the meaning of, and subject to the protections of, Section 27A of the Securities Act of 1933, as amended, and Section 21E of the Securities Exchange Act of 1934, as amended. These statements may be regarding future events and our expectations and beliefs about our future financial performance and financial condition, as well as trends in our business and markets. In addition, certain statements may be contained in the Company’s future filings with the SEC, in press releases, and in oral and written statements made by or with the approval of the Company that are not statements of historical fact and constitute “forward-looking statements” within the meaning of, and subject to the protections of, Section 27A of the Securities Act of 1933, as amended, and Section 21E of the Securities Exchange Act of 1934, as amended. Forward-looking statements are not historical in nature and may be identified by references to a future period or periods of by the use of the words “believe,” “expect,” “anticipate,” “intend,” “plan,” “estimate,” “project,” “outlook,” or words of similar meaning, or future or conditional verbs such as “will,” “would,” “should,” “could,” or “may.” The forward-looking statements in presentation should not be relied on because they are based on current information and on assumptions that we make about future events and circumstances that are subject to a number of known and unknown risks and uncertainties that are often difficult to predict and beyond our control. As a result of those risks and uncertainties, and other factors, our actual financial results in the future could differ, possibly materially, from those expressed in or implied by the forward-looking statements contained in this presentation and could cause us to make changes to our future plans. Factors that might cause such differences include, but are not limited to: the impact of current and future economic conditions, particularly those affecting the financial services industry, including the effects of declines in the real estate market, high unemployment rates, inflationary pressures, elevated interest rates and slowdowns in economic growth, as well as the financial stress on borrowers as a result of the foregoing; potential impacts of the recent adverse developments in the banking industry highlighted by high-profile bank failures, including impacts on customer confidence, deposit outflows, liquidity and the regulatory response thereto; risks arising from media coverage of the banking industry; risks arising from perceived instability in the banking sector; changes in the interest rate environment, including changes to the federal funds rate; changes in prices, values and sales volumes of residential and commercial real estate; developments in our mortgage banking business, including loan modifications, general demand, and the effects of judicial or regulatory requirements or guidance; competition in our markets that may result in increased funding costs or reduced earning assets yields, thus reducing margins and net interest income; interest rate fluctuations, which could have an adverse effect on the Company’s profitability; legislation or regulatory changes which could adversely affect the ability of the consolidated Company to conduct business combinations or new operations; changes in tax laws; significant turbulence or a disruption in the capital or financial markets and the effect of a fall in stock market prices on our investment securities; the effects of war or other conflicts including the impacts related to or resulting from Russia’s military action in Ukraine; and adverse results from current or future litigation, regulatory examinations or other legal and/or regulatory actions, including as a result of the Company’s participation in and execution of government programs. Therefore, the Company can give no assurance that the results contemplated in the forward-looking statements will be realized. Additional information regarding these and other risks and uncertainties to which our business and future financial performance are subject is contained in the sections titled “Cautionary Note Regarding Forward-Looking Statements” and “Risk Factors” in the Company’s most recent Annual Report on Form 10-K and Quarterly Reports on Form 10-Q on file with the U.S. Securities and Exchange Commission (the “SEC”), and in other documents that we file with the SEC from time to time, which are available on the SEC’s website, http://www.sec.gov. In addition, our actual financial results in the future may differ from those currently expected due to additional risks and uncertainties of which we are not currently aware or which we do not currently view as, but in the future may become, material to our business or operating results. Due to these and other possible uncertainties and risks, readers are cautioned not to place undue reliance on the forward-looking statements contained in this press release or to make predictions based solely on historical financial performance. Any forward-looking statement speaks only as of the date on which it is made, and we do not undertake any obligation to update or review any forward-looking statement, whether as a result of new information, future developments or otherwise, except as required by law. All forward-looking statements, express or implied, included in this press release are qualified in their entirety by this cautionary statement.

GRAPHIC

3 Company Overview Headquarters • Doraville, Georgia (Atlanta Metro Area) 2023 YTD Size and Scale • $3.5 billion in total assets • $3.0 billion in gross loans • $2.7 billion in total deposits Focus • Non-conforming mortgage lending, SBA lending and conservative CRE lending • Predominantly Asian-American communities in growing metropolitan markets in the Eastern U.S. and Texas Company • Metro City Bank was founded in 2006 • The holding company, MetroCity Bankshares, Inc., was founded in 2014 Note: Financial data is as of or for the six months ended June 30, 2023 2023 YTD Performance • 1.71% Return on Average Assets • 16.47% Return on Average Equity • 3.20% Net Interest Margin • 35.8% Efficiency Ratio 20 Full-Service Branch Locations Doraville, GA Headquarters and 8 Branches in the Atlanta Metro Area

GRAPHIC

4 History of Metro City Bank • Opened April 2006 • $14.9mm in equity 2006 • Opened a branch in Suwanee, GA 2008 • Achieved 2% ROAA • Acquired Global Commerce (FDIC-Assisted) • Acquired Opelika branch from Synovus to enter Alabama 2012 • Entered the Washington D.C. area by opening a branch in Centreville, VA • Formed the holding company 2014 • Surpassed $1B in assets • Entered the NYC area by opening branches in Fort Lee, NJ and Bayside, NY • Entered Texas by acquiring two branches in the Dallas-Fort Worth MSA • Net income exceeded $20mm 2016 • Surpassed $200mm in assets • Raised $15.9mm in additional equity • Opened branches in Duluth, GA and Johns Creek, GA 2007 • Surpassed $300mm in assets • Net income exceeded $2mm 2009 • Opened the Sugarloaf branch in Suwanee, GA 2011 • Surpassed $500mm in assets • Net income exceeded $10mm 2013 • Opened a branch in Montgomery, AL 2015 • 5 straight years with an ROAA above 2% • Peachtree Corners office was opened in Norcross, GA 2017 • Entered Cobb County with a branch in Marietta, GA • Three branches opened in Annandale, VA, Houston, TX, and Flushing, NY 2018 • Listed on the NASDAQ exchange through $26 million IPO • Opened a branch in Tampa, FL 2019 • Surpassed $3B in assets 2021 2006 2007 2008 2009 2010 2011 2012 2013 2014 2015 2016 2017 2018 2019 2020 2022 • Opened a branch in LaGrange, GA 2023 2021 2023

GRAPHIC

5 Senior Management Team Name Holding Company Title Years in Industry Year Joined MetroCity Prior Experience Nack Y. Paek Chairman and Chief Executive Officer 42 2006 • Founder of MetroCity Bankshares, Inc. and Metro City Bank • Served as President of Government Loan Service Corp. which specialized in originating and servicing SBA loans • Founding director for Summit Bank Corporation where he served in various capacities, including Chairman of the Audit committee and Chairman of the Board of Directors Farid Tan President and Director 42 2006 • Began community banking career in Georgia in 1999 as Senior Vice President and Chief Lending Officer of Global Commerce Bank; named President and CEO in 2002 • Started banking career in 1981 for Bank Bumiputra Malaysia where he became the Assistant General Manager of their New York office Howard H. Kim Executive VP, Chief Operating Officer, Chief Lending Officer and Director 43 2006 • Served as Vice President, Commercial and SBA Lender for two local community banks in Doraville, Georgia prior to joining Metro City Bank in 2006 • Worked for Korea Development Securities Co. Ltd as an assistant branch manager, a manager of their accounting division and representative of their Amsterdam office from 1991 to 1997 • Worked for Korea Development Bank as an officer for lending, deposit, foreign exchange dealing and accounting from 1980 to 1991 Lucas C. Stewart Executive VP, Chief Financial Officer 20 2019 • Most recently served as Vice President of Financial Reporting and SOX Compliance for Fidelity Bank in Atlanta, GA • Director of an Atlanta CPA firm and oversaw the audits of various financial institutions over the span of 9 years Our senior management team is supported by ten highly qualified and experienced individuals who oversee various aspects of our business

GRAPHIC

6 Key Investment Highlights • Double-digit percentage asset growth in each of the last three years, driven by investments in personnel and branch infrastructure • Since 2015, we have added twelve full-service branches in carefully selected locations and added 120 employees • Investments yielded growth in assets, loans, deposits and shareholders’ equity well in excess of our peer groups Balance Sheet Growth • Steady balance sheet expansion has driven consistent revenue and earnings growth • Peer-leading profitability has enabled us to support growth while maintaining healthy capital ratios and achieving a dividend payout ratio greater than 15% over the last five years • Greater than 2.00% return on average assets for every fiscal year since 2015 Earnings Growth and Profitability • Growth and profitability have come without compromising on asset quality • Only 5 foreclosures out of 17,400 residential mortgage loans originated between January 1, 2015 and June 30, 2023, none of which resulted in a loss Credit Quality • Successful growth of customer base since our founding primarily through de novo branch openings in vibrant, multi-ethnic markets • Suite of product offerings tailored to meet the needs of businesses and individuals already established in our communities Niche Focus

GRAPHIC

7 Beneficial Ownership of Executive Officers and Directors Name Age Year Joined Principal Occupation Nationality Title and Position with the Company Shares of Common Stock Beneficially Owned Nack Y. Paek 81 2006 Chairman and CEO of MetroCity Bankshares, Inc. Korean Chairman and Founder 5.54% Farid Tan 65 2006 CEO and Director of MetroCity Bankshares, Inc. Malaysian CEO and Director 3.64% Howard H. Kim 66 2006 President, COO and CLO of MetroCity Bankshares, Inc. Korean President, COO, CLO & Director 2.26% Beneficial Ownership of Executive Offices: 11.44% Don Leung 65 2006 Vice Chairman of the Board of MetroCity Bankshares, Inc. Chinese Director 4.27% Young Park 75 2006 Owner and President of Kani House Restaurants Korean Director 3.26% Ajit Patel 58 2006 Managing Member of Amrit & Sons I, LLC and Relax Hospitality, LLC Indian Director 2.76% Sam Sang-Koo Shim 80 2006 President of SKS Consulting, Inc. Korean Director 2.44% Francis Lai 69 2010 Managing Member of Goldfield Capital, LLC Malaysian Director 2.14% Frank Glover 44 2022 President of STG Investments American Director 0.80% Feiying Lu 59 2006 Internal Controller with Imaex Trading Company Chinese Director 0.66% William J. Hungeling 52 2020 Owner of Hungeling CPA American Director 0.62% Frank S. Rhee 58 2006 Co-Owner, EEE Holdings LLC Korean Director 0.07% Beneficial Ownership of Current Directors Excluding Management: 17.02% Total Beneficial Ownership: 28.46%

GRAPHIC

8 $1,244.2 $1,307.4 $1,479.9 $2,263.0 $2,666.8 $2,698.5 2018 2019 2020 2021 2022 2023YTD Financial Snapshot Total Deposits ($mm) Net Income ($mm) $41.3 $44.7 $36.4 $61.7 $62.6 $28.8 2018 2019 2020 2021 2022 2023 YTD Note: Dollars in millions unless otherwise noted. Financial data is as of or for the 12 months ended December 31 for each respective year; YTD is as of or for the 6 months ended June 30, 2023 Gross Loans ($mm) $804.3 $1,068.6 $1,630.3 $2,505.1 $3,055.7 $3,020.7 2018 2019 2020 2021 2022 2023YTD As of or for the Six Months Ended June 30, 2023 Total Assets $3,47 5.1 Gross Loans 3,020.7 Total Deposits 2,698.5 Total Shareholders' Equity 37 3.2 Net Income ($mm) $28.8 Return on Av erage Assets 1 .7 1 % Return on Av erage Shareholders' Equity 1 6.5% Net Interest Margin 3.20% Efficiency Ratio 35.8% Gross Loans to Deposits 1 1 2.3% Total Shareholders Equity to Total Assets 1 0.7 4% Tier 1 Lev erage Ratio 1 0.03% Tier 1 Risk-Based Capital Ratio 1 6.69% Total Risk-Based Capital Ratio 1 7 .59% Nonperforming Assets to Total Assets 0.68% Allowance for Loan Losses to Gross Loans 0.60% Net Charge-Offs to Gross Loans 0.03% Balance Sheet ($mm) Earnings and Profitability Balance Sheet and Capital Ratios (Consolidated) Asset Quality Track Record of Organic Growth

GRAPHIC

9 2.87% 2.17% 2.51% 1.96% 1.71% 2019 2020 2021 2022 2023YTD 24.23% 16.02% 23.55% 19.55% 16.47% 2019 2020 2021 2022 2023YTD 39.66% 44.04% 35.10% 36.28% 35.84% 2019 2020 2021 2022 2023YTD Net Interest Margin Efficiency Ratio Exceptional Profitability and Growth Return on Average Shareholders’ Equity Note: Financial data is as of or for the 12 months ended December 31 for each respective year; YTD is as of or for the 6 months ended June 30, 2023 Return on Average Assets 4.15% 4.18% 4.45% 3.95% 3.20% 2019 2020 2021 2022 2023YTD

GRAPHIC

10 Peer-Leading Performance Performance Metrics vs. Peers Growth Metrics vs. Peers(1) (2) Peer Median Note: Ethnic Peer Group includes eight banks traded on either the NYSE or the Nasdaq Global Select Market and headquartered in the United States with a primary focus on serving distinct ethnic communities (EWBC, CATY, HOPE, HAFC, PFBC, RBB, OPBK, and PCB). Nationwide Peer Group includes 60 banks traded on either the NYSE or the Nasdaq Global Select Market with total assets between $2.5 billion and $5 billion as of June 30, 2023 (1) Two year CAGR from June 30, 2021 to June 30, 2023 (2) Financial data as of June 30, 2023 Gross Loans ROAE 12.2% 10.7% 14.8% Ethnic Peer Group Nationwide Peer Group MetroCity Net Income Efficiency Ratio 53.6% 62.8% 38.8% Ethnic Peer Group Nationwide Peer Group MetroCity Total Assets ROAA 1.17% 0.97% 1.54% Ethnic Peer Group Nationwide Peer Group MetroCity 10.6% 13.0% 4.4% Ethnic Peer Group Nationwide Peer Group MetroCity 18.4% 6.2% 10.0% Ethnic Peer Group Nationwide Peer Group MetroCity 8.5% 9.9% 17.5% Ethnic Peer Group Nationwide Peer Group MetroCity

GRAPHIC

11 0.63% 0.93% 0.89% 0.50% 0.71% 0.68% 2018 2019 2020 2021 2022 2023 YTD Strong Focus on Credit Credit Quality Highlights NPAs / Total Assets • Adherence to disciplined and well-defined underwriting practices  No delegated individual lending authority  Lending authority governed by graduated size limits at each of our management loan committee, directors’ loan committee, or our full board of directors • Focus on low loan-to-value, strong cash flows and personal guarantees in most cases • High level of involvement of our executive senior management team and board of directors • Exceptional performance in our residential mortgage lending  Utilizes a pre-defined criteria approval system with no need for discretionary judgement or approval  Only 5 foreclosures out of 17,400 residential mortgage loans originated between January 1, 2015 and June 30, 2023 (with no losses to the bank) • Take advantage of the SBA and USDA programs to augment credit via guarantees Note: Financial data is as of or for the 12 months ended December 31 for each respective year; YTD is as of or for the 6 months ended June 30, 2023 NCOs to Average Gross Loans 0.14% (0.02%) 0.01% 0.01% 0.01% 0.03% 2018 2019 2020 2021 2022 2023 YTD

GRAPHIC

12 Construction and Development $51.8 1.7% Commercial Real Estate $625.1 20.6% Commercial and Industrial $63.5 2.1% Consumer and Other $0.1 0.0% Residential Real Estate $2,289.1 75.6% Diverse Loan Portfolio 6/30/2023 Note: Dollars in millions unless otherwise noted Loan Portfolio Highlights 12/31/2014 Construction and Development $37.8 7.7% Commercial Real Estate $317.9 65.1% Commercial and Industrial $32.0 6.5% Consumer and other $16.7 3.4% Residential Real Estate $83.9 17.2% • Primary focus on real estate lending with an expertise in non-conforming single family residential (“SFR”) and Small Business Administration (“SBA”) lending • We continue to diversify both geographically and by loan type  Since 2015, we have opened 12 new branches, including 3 in the Atlanta metropolitan area  We also opened three branches in Texas, two branches in New York, and one branch in each of Alabama, Florida, New Jersey and Virginia  We will continue to expand geographically to new gateway markets that are culturally diverse and experiencing demographic growth From 1/1/2017 to 6/30/2023 MetroCity has originated $4,572.7 million and sold $1,605.7 million of Residential Real Estate loans Loan Portfolio Composition $489.2 mm $3.0 bn

GRAPHIC

13 Residential Real Estate Lending Geographic Breakdown Residential Real Estate Loan Balances ($mm) Note: Dollars in millions unless otherwise noted. Financial data is as of or for the 12 months ended December 31 for each respective year; YTD is as of or for the 6 months ended June 30, 2023 Volume of Residential Loans Originated and Sold ($mm) Gain on Sale/Servicing Income ($mm) $670.3 $651.6 $974.4 $1,879.0 $2,306.9 $2,289.1 2018 2019 2020 2021 2022 2023YTD NY 54.4% GA 14.1% PA 7.5% NJ 5.2% FL 4.0% TX 6.6% MA 1.6% Other 6.6% $716.1 $644.5 $484.2 $1,200.0 $833.6 $116.2 $536.0 $520.1 $92.7 $0.0 $94.9 $0.0 2018 2019 2020 2021 2022 2023 YTD Origination Sale $5.7 $9.1 $2.5 $0.0 $2.1 $0.0 $12.0 $9.3 $1.3 ($0.6) ($0.6) ($0.1) 2018 2019 2020 2021 2022 2023 YTD Gain on Sale Servicing Income

GRAPHIC

14 Major Industry Exposure SBA Balances ($mm) Note: Dollars in millions unless otherwise noted. Financial data is as of or for the 12 months ended December 31 for each respective year; YTD is as of or for the 6 months ended June 30, 2023 SBA Lending Continues to Support Growth Volume of SBA Loans Originated and Sold ($mm) Gain on Sale/Servicing Income ($mm) $167.4 $173.6 $192.7 $238.8 $303.6 $264.1 $92.4 $31.0 $0.7 $0.4 $285.1 $269.8 $304.3 $264.5 2018 2019 2020 2021 2022 2023YTD Non-PPP SBA Loans PPP Loans Agriculture 6.1% Supermarkets & Other Grocery 5.2% Beer/Wine/Liquor Stores 25.2% C-Store 4.0% Hotels & Motels 4.9% Restaurants 11.0% Car Washes 19.9% Other 23.6% $4.6 $5.4 $6.5 $11.0 $2.1 $3.1 $3.0 $3.7 $6.1 $5.9 $1.8 $3.2 2018 2019 2020 2021 2022 2023YTD Gain on Sale Servicing Income $121.0 $155.0 $245.7 $285.8 $136.7 $42.3 $93.3 $118.4 $128.6 $124.7 $31.5 $66.8 2018 2019 2020 2021 2022 2023YTD Origination Sale

GRAPHIC

15 Net Interest Income $51.2 82.6% SBA servicing income, net $3.2 5.2% Service charges, commissions and fees $3.1 4.9% Gain on sale - SBA loans $3.0 4.9% Gain on sale - SFR loans $0.0 0.0% Mortgage servicing income, net and other $1.5 2.4% • For the year ended December 31, 2022 and six months ended June 30, 2023, 13.8% and 17.4%, respectively, of revenue came from noninterest income • Noninterest income for the six-month period ended June 30, 2023 was $10.8 million, a decrease of $1.5 million or 12.4%, compared to $12.3 million for the six-month period ended June 30, 2022 • This was primarily due to lower mortgage loan fees from lower volume and lower gains on sale of mortgage loans as no mortgage loans were sold during the first half of 2023, offset by increases in gains on sale of SBA loans, SBA servicing income and other income • A significant portion of noninterest income is associated with SBA and residential mortgage lending activity, consisting of gains on the sale of loans sold in the secondary market and servicing income from loans sold with servicing rights retained • In recent years, we have elected to sell less loans to help maximize our interest income due to lower sales premiums offered from secondary market Well Diversified Revenue Streams Highlights Revenue for Six Months Ended June 30, 2023 ($mm) $62.0 mm Note: Dollars in millions unless otherwise noted

GRAPHIC

16 1.21% 1.69% 0.83% 0.21% 0.97% 2.88% 2018 2019 2020 2021 2022 2023YTD Deposit Portfolio Deposit Portfolio Highlights Note: Dollars in millions unless otherwise noted. Financial data is as of or for the 12 months ended December 31 for each respective year; YTD is as of or for the 6 months ended June 30, 2023 (1) Core deposits exclude time deposits > 250,000 without other related deposit accounts • Focused on growing our low-cost deposits, which we gather primarily through our branch network • We also utilize brokered deposits as a source of funding to support our asset growth • Total deposits increased $301.5 million, or 12.6% to $2.70 billion at June 30, 2023 compared to $2.40 billion at June 30, 2022 • Since 2014 we have placed an increased emphasis on growing our relationship-based deposits with our commercial and business lending customers; developing SBA borrowers into full-scale customer relationships • Since 2017, we have been developing deposit relationships with our mortgage borrowers • Uninsured deposits were 30.7% of total deposits at June 30, 2023 compared to 32.5% at December 31, 2022. As of June 30, 2023, we had $1.19 billion of available borrowing capacity at the Federal Home Loan Bank ($702.5 million), Federal Reserve Discount Window ($444.6 million) and various other financial institutions (fed fund lines totaling $47.5 million). Cost of Deposits NOW and Savings Deposits $141.8 5.3% Money Market Deposits $1,036.5 38.4% Retail Time Deposits $499.7 18.5% Jumbo Time Deposits $445.2 16.5% Noninterest Bearing Deposits $575.3 21.3% $2.7bn 77% Core Deposits(1) Deposit Portfolio Composition as of June 30, 2023 ($mm)

GRAPHIC

17 22.01% 20.86% 17.77% 16.68% 17.59% 2019 2020 2021 2022 2023 YTD 12.70% 13.44% 9.44% 9.57% 10.03% 2019 2020 2021 2022 2023 YTD Strong Capital Position Total Shareholders Equity to Total Assets Tier 1 Leverage Ratio Note: Financial data is as of or for the 12 months ended December 31 for each respective year; YTD is as of or for the 6 months ended June 30, 2023 Tier 1 Risk Based Capital Total Risk-Based Capital 21.31% 20.00% 16.76% 15.99% 16.69% 2019 2020 2021 2022 2023 YTD 13.28% 12.90% 9.34% 10.20% 10.74% 2019 2020 2021 2022 2023 YTD

GRAPHIC

Appendix

GRAPHIC

19 Selected Historical Consolidated Financials As of or for the As of or for the Year Ended Six Months Ended December 31, June 30, (Dollars in thousands, except per share data) 2018 2019 2020 2021 2022 2023 Statement of Income Data: Interest income $ 72,879 $ 83,213 $ 77,609 $ 108,741 $ 147,220 $ 93,447 Interest expense 14,675 22,238 11,489 4,572 27,609 42,244 Net interest income 58,204 60,975 66,120 104,169 119,611 51,203 Provision for credit losses 1,237 - 3,467 6,929 (2,767) (416) Noninterest income 37,646 39,896 27,112 33,803 19,204 10,777 Noninterest expense 38,612 40,003 41,001 48,424 50,365 22,213 Income tax expense 14,667 16,150 12,370 20,918 28,615 11,345 Net income 41,334 44,718 36,394 61,701 62,602 28,838 Per Share Data: Basic income per share $ 1.71 $ 1.82 $ 1.42 $ 2.41 $ 2.46 $ 1.15 Diluted income per share 1.69 1.81 1.41 2.39 2.44 1.13 Dividends per Share 0.38 0.42 0.40 0.46 0.60 0.36 Book value per share (at period end) 6.95 8.49 9.54 11.40 13.88 14.76 Shares of common stock outstanding 24,258,062 25,529,891 25,674,573 25,465,236 25,169,709 25,279,846 Weighted average diluted shares 24,475,698 24,729,535 25,798,549 25,788,781 25,688,696 25,468,941 Balance Sheet Data: Gross loans held for investment $ 1,143,575 $ 1,161,162 $ 1,630,344 $ 2,505,070 $ 3,055,689 $ 3,020,714 Loans held for sale 56,865 85,793 - - - - Allowance for loan losses 6,645 6,839 10,135 16,952 13,888 18,091 Total assets 1,432,650 1,631,858 1,897,489 3,106,158 3,427,239 3,475,087 Deposits 1,244,232 1,307,377 1,479,889 2,263,020 2,666,838 2,698,482 Shareholders' equity 168,608 216,724 244,831 290,223 349,421 373,163 Performance Ratios: Return on average assets 3.01% 2.87% 2.17% 2.51% 1.96% 1.71% Return on average shareholders' equity 27.95 24.23 16.02 23.55 19.55 16.47 Dividend payout ratio 22.48 23.26 28.32 19.17 24.52 31.61 Yield on total loans 5.92 6.14 5.47 5.11 5.15 5.90 Yield on average earning assets 5.60 5.66 4.91 4.65 4.86 5.84 Cost of average interest bearing liabilities 1.60 2.15 1.15 0.29 1.25 3.52 Cost of deposits 1.21 1.69 0.83 0.21 0.97 2.86 Net interest margin 4.48 4.15 4.18 4.45 3.95 3.20 Efficiency ratio 40.26 39.66 44.04 35.10 36.28 35.84

GRAPHIC

20 Selected Historical Consolidated Financials As of or for the As of or for the Year Ended Six Months Ended December 31, June 30, (Dollars in thousands, except per share data) 2018 2019 2020 2021 2022 2023 Asset quaility data: Net charge-offs to average loans held for investment 0.14% (0.02%) 0.01% 0.01% 0.01% 0.03% Nonperforming assets to gross loans and OREO 0.78 1.30 1.03 0.61 0.80 0.78 ALL to nonperforming loans 74.12 46.54 77.40 147.97 69.50 79.88 ALL to loans held for investment 0.58 0.59 0.62 0.68 0.45 0.60 Balance sheet and capital ratios: Gross loans held for investment to deposits 92.08% 88.97% 110.48% 110.98% 114.94% 112.27% Noninterest bearing deposits to deposits 24.05 22.34 31.28 26.18 22.95 21.32 Tangible common equity to tangible assets 11.77 13.28 12.90 9.34 10.20 10.74 Leverage ratio 11.14 12.70 13.44 9.44 9.57 10.03 Common equity tier 1 ratio 17.44 21.31 20.00 16.76 15.99 16.69 Tier 1 risk-based capital ratio 17.44 21.31 20.00 16.76 15.99 16.69 Total risk-based capital ratio 18.16 22.01 20.86 17.77 16.68 17.59

v3.23.2
Document and Entity Information
Aug. 02, 2021
Document and Entity Information [Abstract]  
Document Type 8-K
Document Period End Date Aug. 04, 2023
Entity Registrant Name METROCITY BANKSHARES, INC.
Entity File Number 001-39068
Entity Incorporation, State or Country Code GA
Entity Tax Identification Number 47-2528408
Entity Address, Address Line One 5114 Buford Highway
Entity Address, City or Town Doraville
Entity Address, State or Province GA
Entity Address, Postal Zip Code 30340
City Area Code 770
Local Phone Number 455-4989
Written Communications false
Soliciting Material false
Pre-commencement Tender Offer false
Pre-commencement Issuer Tender Offer false
Title of 12(b) Security Common Stock, par value $0.01 per share
Trading Symbol MCBS
Security Exchange Name NASDAQ
Entity Emerging Growth Company true
Entity Ex Transition Period true
Entity Central Index Key 0001747068
Amendment Flag false

MetroCity Bankshares (NASDAQ:MCBS)
Historical Stock Chart
From Apr 2024 to May 2024 Click Here for more MetroCity Bankshares Charts.
MetroCity Bankshares (NASDAQ:MCBS)
Historical Stock Chart
From May 2023 to May 2024 Click Here for more MetroCity Bankshares Charts.