Form 424B3 - Prospectus [Rule 424(b)(3)]
10 May 2024 - 6:12AM
Edgar (US Regulatory)
John Hancock Financial Opportunities Fund (the fund)
Supplement dated May 9, 2024 to the current Prospectus, as may
be supplemented (the Prospectus)
The following replaces the
Financial Highlights contained in the Prospectus:
Selected data
for a Common Share outstanding during the periods stated.
| |
|
|
|
|
|
Per share operating performance |
Net asset value, beginning of period |
|
|
|
|
|
| |
|
|
|
|
|
Net realized and unrealized gain (loss) on investments |
|
|
|
|
|
Total from investment operations |
|
|
|
|
|
| |
From net investment income |
|
|
|
|
|
| |
|
|
|
|
|
| |
|
|
|
|
|
Premium from shares sold through shelf offering |
|
|
|
|
|
Net asset value, end of period |
|
|
|
|
|
Per share market value, end of period |
|
|
|
|
|
Total return at net asset value (%)3,4 |
|
|
|
|
|
Total return at market value (%)3 |
|
|
|
|
|
Ratios and supplemental data |
Net assets, end of period (in millions) |
|
|
|
|
|
Ratios (as a percentage of average net assets): |
Expenses before reductions |
|
|
|
|
|
Expenses including reductions5 |
|
|
|
|
|
| |
|
|
|
|
|
| |
|
|
|
|
|
| |
Total debt outstanding end of period (in millions) |
|
|
|
|
|
Asset coverage per $1,000 of debt6 |
|
|
|
|
|
1
Based on average daily shares outstanding.
2
The amount shown for a share outstanding does not correspond with the aggregate net gain (loss) on investments for the period due to the timing of the sales and repurchases of shares in relation to fluctuating market values of the investments of the fund.
3
Total return based on net asset value reflects changes in the fund’s net asset
value during each period. Total return based on market value reflects changes in market value. Each figure assumes that distributions from income, capital gains and tax
return of capital, if any, were reinvested.
4
Total returns would have been lower had certain expenses not been reduced during the
applicable periods.
5
Expenses including reductions excluding interest expense were 1.60%, 1.47%, 1.47%, 1.69% and 1.50% for the periods ended 12-31-23, 12-31-22, 12-31-21, 12-31-20 and 12-31-19, respectively.
6
Asset coverage equals the total net assets plus borrowings divided by the borrowings of the fund outstanding at period end (Note 8). As debt outstanding changes, the level of invested assets may change accordingly. Asset coverage ratio provides a measure of leverage.
Manulife, Manulife Investment Management, Stylized M Design, and Manulife Investment Management & Stylized M Design are trademarks of
The Manufacturers Life Insurance Company and are used by its affiliates under license.
| |
|
|
|
|
|
|
Per share operating performance |
Net asset value, beginning of period |
|
|
|
|
|
|
| |
|
|
|
|
|
|
Net realized and unrealized gain (loss) on investments |
|
|
|
|
|
|
Total from Investment operations |
|
|
|
|
|
|
| |
From net investment income |
|
|
|
|
|
|
| |
|
|
|
|
|
|
| |
|
|
|
|
|
|
Anti-dilutive impact of repurchase plan |
|
|
|
|
|
|
Net asset value, end of period |
|
|
|
|
|
|
Per share market value, end of period |
|
|
|
|
|
|
Total return at net asset value (%)6,7 |
|
|
|
|
|
|
Total return at market value (%)6 |
|
|
|
|
|
|
Ratios and supplemental data |
Net assets, end of period (in millions) |
|
|
|
|
|
|
Ratios (as a percentage of average net assets): |
Expenses before reductions |
|
|
|
|
|
|
Expenses including reductions10 |
|
|
|
|
|
|
| |
|
|
|
|
|
|
| |
|
|
|
|
|
|
| |
Total debt outstanding end of period (in millions) |
|
|
|
|
|
|
Asset coverage per $1,000 of debt11 |
|
|
|
|
|
|
1
For the two-month period ended 12-31-15. The fund changed its fiscal year end from
October 31 to December 31.
2
Based on average daily shares outstanding.
3
Net investment income (loss) per share and ratio of net investment income (loss) to average net assets reflect special dividends received by the fund, which amounted to $0.04 and 0.15%, respectively.
4
Less than $0.005 per share.
5
The repurchase plan was completed at an average repurchase price of $20.79 for 10,000 shares for the period ended 12-31-16.
6
Total return based on net asset value reflects changes in the fund’s net asset
value during each period. Total return based on market value reflects changes in market value. Each figure assumes that distributions from income, capital gains and tax
return of capital, if any, were reinvested.
7
Total returns would have been lower had certain expenses not been reduced during the
applicable periods.
10
Expenses including reductions excluding interest expense were 1.44%, 1.45%, 1.58%,
1.63% (annualized) and 1.60% for the periods ended 12-31-18, 12-31-17, 12-31-16, 12-31-15 and 10-31-14, respectively.
11
Asset coverage equals the total net assets plus borrowings divided by the borrowings of
the fund outstanding at period end (Note 8). As debt outstanding changes, the level of invested assets may change accordingly. Asset coverage ratio provides a measure of
leverage.
You should read this supplement in conjunction with the Prospectus and retain it for your future reference.
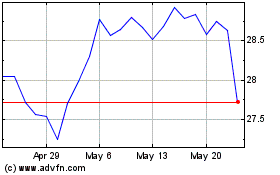
John Hancock Financial O... (NYSE:BTO)
Historical Stock Chart
From Apr 2024 to May 2024

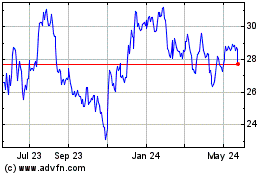
John Hancock Financial O... (NYSE:BTO)
Historical Stock Chart
From May 2023 to May 2024
