Eaton Vance Tax-Advantaged Dividend Income Fund Report of Earnings
21 April 2006 - 4:37AM
Business Wire
Eaton Vance Tax-Advantaged Dividend Income Fund (NYSE: EVT), a
diversified closed-end investment company, today announced the
earnings of the Fund for the three months ended February 28, 2006
and for the six months ended February 28, 2006. The Fund's fiscal
year ends on August 31, 2006. For the three months ended February
28, 2006, the Fund had net investment income of $38,647,560 ($0.531
per common share). From this amount, the Fund paid dividends on
preferred shares of $6,859,763 (equal to $0.094 for each common
share), resulting in net investment income after the preferred
dividends of $31,787,797 or $0.436 per common share. For the six
months ended February 28, 2006, the Fund had net investment income
of $65,564,886 ($0.900 per common share). From this amount, the
Fund paid dividends on preferred shares of $13,154,377 (equal to
$0.181 for each common share), resulting in net investment income
after the preferred dividends of $52,410,509 or $0.720 per common
share. In comparison, for the three months ended February 28, 2005,
the Fund had net investment income of $24,982,334 ($0.343 per
common share). From this amount, the Fund paid dividends on
preferred shares of $3,599,696 (equal to $0.049 for each common
share), resulting in net investment income after the preferred
dividends of $21,382,638 or $0.294 per common share. For the six
months ended February 28, 2005 the Fund had net investment income
of $51,161,476 ($0.702 per common share). From this amount, the
Fund paid dividends on preferred shares of $6,606,797 (equal to
$0.091 for each common share), resulting in net investment income
after the preferred dividends of $44,554,679 or $0.611 per common
share. Net realized and unrealized gains for the three months ended
February 28, 2006 were $103,965,051 ($1.427 per common share) and
net realized and unrealized gains for the six months ended February
28, 2006 were $78,197,584 ($1.074 per common share). In comparison,
net realized and unrealized gains for the three months ended
February 28, 2005 were $84,214,224 ($1.156 per common share) and
net realized and unrealized gains for six months ended February 28,
2005 were $215,551,164 ($2.957 per common share). On February 28,
2006, net assets applicable to common shares of the Fund were
$1,883,984,723. The net asset value per common share on February
28, 2006 was $25.87 based on 72,835,900 common shares outstanding.
In comparison, on February 28, 2005, net assets of the Fund were
$1,751,104,832. The net asset value per common share on February
28, 2005 was $24.04 based on 72,835,900 common shares outstanding.
The Fund is managed by Eaton Vance Management. Eaton Vance had over
$113.3 billion in assets under management on January 31, 2006.
Eaton Vance Management will make available periodic summary
information regarding portfolio investments. Those interested
should call Eaton Vance Marketing at (617) 482-8260. -0- *T EATON
VANCE TAX-ADVANTAGED DIVIDEND INCOME FUND SUMMARY OF RESULTS OF
OPERATIONS (in thousands, except per share amounts) Three Months
Ended Six Months Ended Feb. 28, Feb. 28, -------------------
----------------------- 2006 2005 2006 2005 --------- ---------
----------- ----------- Gross investment income $43,433 $29,495
$74,967 $60,089 Operating expenses 4,785 4,513 9,402 8,928
--------- --------- ----------- ----------- Net investment income
$38,648 $24,982 $65,565 $51,161 Net realized and unrealized gains
(losses) on investments $103,965 $84,214 $78,198 $215,551 Preferred
dividends paid(a) ($6,860) ($3,600) ($13,154) ($6,607) ---------
--------- ----------- ----------- Net increase (decrease) in net
assets from operations $135,753 $105,596 $130,609 $260,105
========= ========= =========== =========== Earnings per Common
Share Outstanding ------------------------------------- Gross
investment income $0.596 $0.405 $1.029 $0.825 Operating expenses
0.066 0.062 0.129 0.123 --------- --------- ----------- -----------
Net investment income $0.531 $0.343 $0.900 $0.702 Net realized and
unrealized gains (losses) on investments $1.427 $1.156 $1.074
$2.957 Preferred dividends paid(a) (0.094) (0.049) ($0.181) (0.091)
--------- --------- ----------- ----------- Net increase (decrease)
in net assets from operations $1.864 $1.450 $1.793 $3.568 =========
========= =========== =========== Net investment income $0.531
$0.343 $0.900 $0.702 Preferred dividends paid(a) (0.094) (0.049)
(0.181) (0.091) --------- --------- ----------- ----------- Net
investment income after preferred dividends $0.437 $0.294 $0.719
$0.611 ========= ========= =========== =========== (a) The Fund
issued auction preferred shares on December 10, 2003. Net Asset
Value at February 28 (Common Shares)
--------------------------------------------- Net assets (000)
$1,883,985 $1,751,105 Shares outstanding (000) 72,836 72,836 Net
asset value per share outstanding $25.87 $24.04 Market Value
Summary (Common Shares) ----------------------------------- Market
price on NYSE at February 28 $23.45 $21.72 High market price (six
months ended February 28)$23.45 $22.07 Low market price (six months
ended February 28) $20.56 $19.20 *T
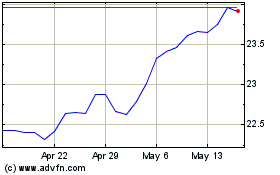
Eaton Vance Tax Advantag... (NYSE:EVT)
Historical Stock Chart
From Jun 2024 to Jul 2024

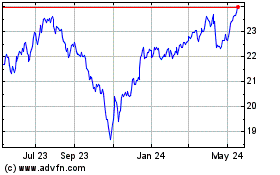
Eaton Vance Tax Advantag... (NYSE:EVT)
Historical Stock Chart
From Jul 2023 to Jul 2024
