MedMira Reports 2019 Fourth Quarter and Year End Financial Results
29 November 2019 - 12:00PM

MedMira Inc. (MedMira) (TSXV: MIR), reported today on its financial
results for the financial year ended July 31, 2019.
Profit and Loss Highlights
- Revenue: The Company recorded revenues in FY2019 of $527,445
compared to $574,860 in FY2018. The decrease in revenue was due to
the Company’s strategy to focus on high profit margin markets. As
outlined below, this strategy has resulted in the Company recording
a higher contribution margin and has also indirectly decreased
expenses.
- Gross Profit: The Company recorded a gross profit in FY2018 of
$423,351 compared to $461,111 for the same period last year. The
overall gross margin percentage on sales increased by 2% from 78%
in FY2018 to 80% in this financial year.
- Operating expenses: In this financial year, the Company
recorded operating expenses of $1,719,384 compared to $2,301,408 in
FY2018. The decrease of 25% in operating expenses was due to the
management’s efforts to decrease its operating fixed costs.
- Net loss: The Company recorded a net loss of $2,106,448
compared to $2,509,464 in FY2018.
Balance Sheet Highlights
- Assets: The Company had an expected decrease of its assets by
$48,394 or 16% compared to last financial year due to receipt of
trade receivables, lower inventory and tax receivables.
- Liabilities: The Company’s liabilities increased by $2,070,554
or 18% between FY2018 and FY2019. This was mainly due to additional
loans provide from the main shareholder and the management of the
Company.
- Loans in default increased by $1,040,627 or 14% compared to
financial year. This increase was due to a number of related
parties loans being due in FY2019. All long and short terms debts
are currently under negotiation to restructure terms and conditions
of repayment.
- Working Capital deficit: As a result of the increases noted
above, the Company recorded higher working capital deficit of
$2,096,748 or 18% compared to last financial year.
The Company’s financial statements and management’s discussion
and analysis are available on the Company’s profile on SEDAR at
www.sedar.com. For matters of going concern, reference is
made to the Auditor’s Emphasis of Matter statement in the fiscal
year ended 2017 Auditors Report and note 2b in the audited
financial statements which are also available on SEDAR.
About MedMira
MedMira is the developer and owner of Rapid
Vertical Flow (RVF) Technology™. The Company’s rapid test
applications built on RVF Technology provide hospitals, labs,
clinics and individuals with instant diagnosis for diseases such as
HIV and hepatitis C in just three easy steps. The Company’s tests
are sold under the Reveal, Multiplo and Miriad™ brands in global
markets. MedMira’s corporate offices and manufacturing facilities
are located in Halifax, Nova Scotia, Canada and the Company has a
sales and customer service office located in the United States. For
more information visit medmira.com. Follow us on Twitter and
LinkedIn.
This news release contains forward-looking
statements, which involve risk and uncertainties and reflect the
Company’s current expectation regarding future events including
statements regarding possible approval and launch of new products,
future growth, and new business opportunities. Actual events
could materially differ from those projected herein and depend on a
number of factors including, but not limited to, changing market
conditions, successful and timely completion of clinical studies,
uncertainties related to the regulatory approval process,
establishment of corporate alliances and other risks detailed from
time to time in the company quarterly filings.
Neither TSX Venture Exchange nor its Regulation
Services Provider (as that term is defined in the policies of the
TSX Venture Exchange) accepts responsibility for the adequacy or
accuracy of this release.
MedMira Contacts:
Markus Meile,
CFO
Tel:
902-450-1588
Email: m.meile@medmira.com
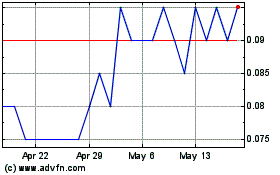
MedMira (TSXV:MIR)
Historical Stock Chart
From Nov 2024 to Dec 2024

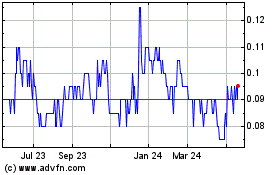
MedMira (TSXV:MIR)
Historical Stock Chart
From Dec 2023 to Dec 2024
