The Marketing Alliance, Inc. (Pink Sheets: MAAL) (�TMA�), a
provider of services and distributor of products to independent
insurance agencies throughout the United States, today announced
financial results for its fiscal second quarter and first half
ended September 30, 2008. Timothy M. Klusas, TMA�s President,
stated, �Our Company continued to produce strong operating results
in a difficult economic climate during this quarter. TMA achieved
over 39% growth in revenues, a 66% increase in operating profit,
and continued improvements in operating margins. We have continued
to realize the benefits of our operating initiatives designed to
streamline costs while delivering value-added insurance products
and services to our member base. Our ability to deliver these
services in a cost-effective manner generates substantial operating
leverage for TMA and provides our members with the tools they need
to help grow their businesses.� FISCAL 2009 SECOND QUARTER
FINANCIAL HIGHLIGHTS Total revenues for the three-month period
ended September 30, 2008 increased 39% to $5.4 million from $3.9
million for the three-month period ended September 30, 2007. The
increase was due in part to further sales penetration among a
larger number of carriers in the TMA�s network, including
well-recognized providers such as ING and Met Life. Distributor
bonus and commissions increased to $3.8 million from $2.4 million
in the same period last year, largely due to distributors taking
advantage of TMA�s new incentive programs. Benefits and processing
expenses decreased to $652,000 from $677,000 in the second quarter
of fiscal 2008, due in part to improvements in efficiencies at the
Company�s business processing center in Omaha, NE. Net operating
revenue (gross profit) increased to $932,000 from $808,000 in the
comparable fiscal 2008 period. The Company�s gross profit margins
declined to 17.3% from 20.9% in the prior year period, largely due
to higher bonus payments as distributors are benefiting from
changes in the new incentive structures. Operating expenses for the
three months ended September 30, 2008 were down, to $611,000, or
11.3% of revenues, from $614,000, or 15.9% of revenues, in the
prior three-month period. Operating income rose 66% to $322,000, or
6.0% of revenues, from operating income of $194,000, or 5.0% of
revenues, for the prior year period. Realized and unrealized losses
on investments during the period totaled $380,000, compared to a
realized and unrealized gain of $61,000 for the second quarter of
fiscal 2008. The Company continues to closely monitor its
investment holdings, and reiterates that while short-term
unrealized gains and losses affect current earnings, it has not
meaningfully affected TMA�s ability to execute its strategic
initiatives. The Company reported a net loss for the fiscal 2009
second quarter of $25,000, or $0.01 per share, as compared to net
income of $167,000, or $0.08 per share, for the fiscal 2008 second
quarter. The net loss for the fiscal 2009 period was to due to the
above-referenced realized and unrealized losses on investments.
FISCAL 2009 FIRST HALF HIGHLIGHTS Total revenues for the first half
of fiscal 2009 were $10.6 million, up 36% from $7.8 million for the
first half of fiscal 2008. Distributor bonus and commissions
increased to $7.2 million from $4.7 million in the first half of
fiscal 2008, while benefits and processing expenses remained flat
at $1.3 million for both half years. Net operating revenues for the
six months ended September 30, 2008 increased 12% to $2.1 million
from $1.9 million for the prior half year. Operating expenses for
the six months ended September 30, 2008 were down 3%, to $1.37
million, or 13.0% or revenues, from $1.42 million, or 18.1% of
revenues, in the prior six-month period. Operating income increased
to $706,000 from $440,000 in the first half of fiscal 2008.
Realized and unrealized loss on investments during the first half
totaled $411,000, compared to a realized and unrealized gain of
$123,000 for the first half of fiscal 2008. Net income was
$200,000, or $0.10 per share, as compared to $357,000, or $0.18 per
share, in the first half of fiscal 2008. BOARD OF DIRECTORS ELECTS
TIM KLUSAS TO FINISH TERM OF LATE DIRECTOR K.V. DEY TMA also
announced today the election of its President, Timothy M. Klusas,
as a member of the Company�s Board of Directors. Mr. Klusas
replaces K.V. Dey, who passed away earlier this year. Mr. Klusas
will serve the remainder of Mr. Dey�s term and the Company
continues to have a nine member Board of Directors. Mr. Klusas
stated, �We are saddened by K.V.�s passing and we have expressed
our sympathies to his family. Everyone at TMA is appreciative of
his leadership and efforts on behalf of TMA�s shareholders and we
will miss him personally and professionally.� Also subsequent to
the end of the quarter, three of TMA�s directors, Gary Glassford,
Jack Dewald and Art Jetter, were each re-elected by shareholders as
their terms expired to additional three-year terms. SELECTED OTHER
FINANCIAL INFORMATION TMA�s balance sheet at September 30, 2008
reflected cash of $1.7 million, working capital of $4.1 million and
no long-term debt. Shareholders� equity at September 30, 2008
totaled $4.3 million. TMA DECLARES 2008 CASH DIVIDEND The Company
recently announced that its Board of Directors authorized a $0.23
per share cash dividend for shareholders of record on December 1,
2008, to be paid on or about December 15, 2008. This is the latest
dividend payment to shareholders and an increase of 10% over last
year�s cash dividend of $0.21 per share. ABOUT THE MARKETING
ALLIANCE, INC. Headquartered in St. Louis, MO, TMA is one of the
largest organizations offering support to independent insurance
brokerage agencies, with a goal of providing members value-added
services on a more efficient basis than they can achieve
individually. The Company provides its members located across the
country access to a wide array of life insurance and annuity
products from an extensive network of carriers. Investor
information can be accessed through the shareholder section of
TMA�s website at http://www.themarketingalliance.com/si_who.cfm.
TMA stock is quoted in the �pink sheets� (www.pinksheets.com) under
the symbol �MAAL�. FORWARD LOOKING STATEMENT Investors are
cautioned that forward-looking statements involve risks and
uncertainties that may affect TMA's business and prospects. Any
forward-looking statements contained in this press release
represent our estimates only as of the date hereof, or as of such
earlier dates as are indicated, and should not be relied upon as
representing our estimates as of any subsequent date. These
statements involve a number of risks and uncertainties, including,
but not limited to, general changes in economic conditions. While
we may elect to update forward-looking statements at some point in
the future, we specifically disclaim any obligation to do so.
Consolidated Statement of Operations � Quarter Ended Year to Date �
6 Months Ended 9/30/08 9/30/07 9/30/08 � 9/30/07 � Revenues $
5,379,392 � $ 3,869,093 � $ 10,604,214 � $ 7,823,956 � �
Distributor Related Expenses Distributor bonus & commissions
paid 3,795,305 2,384,602 7,181,018 4,669,270 Distributor benefits
& processing � 652,008 � � 676,544 � � 1,343,056 � � 1,295,891
� Total � 4,447,313 � � 3,061,146 � � 8,524,074 � � 5,965,161 � �
Net Operating Revenue 932,079 807,947 2,080,140 1,858,795 17 % 21 %
20 % 24 % � Operating Expenses � 610,528 � � 614,137 � � 1,373,658
� � 1,418,654 � � Operating Income 321,551 193,810 706,482 440,141
6 % 5 % 7 % 6 % � Other Income (Expense) Interest & dividend
income [net] 23,878 32,239 44,513 46,942 Realized & unrealized
gains [losses] - on investments (net) (379,975 ) 60,833 (411,120 )
120,748 � Interest expense � (1,229 ) � (1,182 ) � (4,256 ) �
(2,023 ) � Income (Loss) Before Provision for Income Tax (35,775 )
285,700 335,619 605,808 � Benefit (Provision) for income taxes �
11,000 � � (119,000 ) � (136,000 ) � (249,000 ) � Net Income (Loss)
$ (24,775 ) $ 166,700 � $ 199,619 � $ 356,808 � � Average Shares
Outstanding 1,945,703 1,977,675 1,945,703 1,977,675 � Operating
Income per Share $ 0.17 $ 0.10 $ 0.36 $ 0.22 Net Income (Loss) per
Share $ (0.01 ) $ 0.08 $ 0.10 $ 0.18 Consolidated Balance Sheet
Items � � � � As of � Assets 9/30/2008 3/31/2008 Current Assets
Cash & Equivalents $ 1,692,365 $ 1,709,172 Receivables
4,468,009 4,497,987 Investments 2,510,005 2,715,997 Other � 440,545
� 32,105 Total Current Assets 9,110,924 8,916,109 � Other Non
Current Assets � 235,027 � 289,792 � Total Assets $ 9,345,951 $
9,205,901 � Liabilities & Stockholders' Equity � Total Current
Liabilities $ 5,024,978 $ 5,084,543 � Total Liabilities 5,024,978
5,084,543 � Stockholders' Equity � 4,320,973 � 4,121,358 �
Liabilities & Stockholders' Equity $ 9,345,951 $ 9,205,901
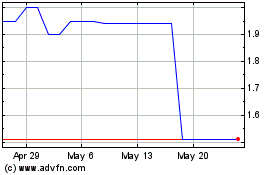
Marketing Alliance (PK) (USOTC:MAAL)
Historical Stock Chart
From Jun 2024 to Jul 2024

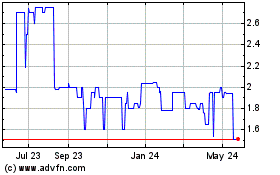
Marketing Alliance (PK) (USOTC:MAAL)
Historical Stock Chart
From Jul 2023 to Jul 2024
