Tullett Prebon PLC Half Yearly Report -7-
28 July 2015 - 4:02PM
UK Regulatory
 Deferred tax assets                                    2.2            2.8           2.3
--------------------------------------------  -------------  -------------  ------------
 Defined benefit pension scheme                        56.9           55.0          62.1
--------------------------------------------  -------------  -------------  ------------
                                                      455.8          390.1         460.7
 -------------------------------------------  -------------  -------------  ------------
 Current assets
---------------------------------------  ---  -------------  -------------  ------------
 Trade and other receivables                       10,161.3       18,605.0       3,261.9
--------------------------------------------  -------------  -------------  ------------
 Financial assets                                      16.6            9.4          10.7
--------------------------------------------  -------------  -------------  ------------
 Cash and cash equivalents                            348.0          250.4         287.1
--------------------------------------------  -------------  -------------  ------------
                                                   10,525.9       18,864.8       3,559.7
 -------------------------------------------  -------------  -------------  ------------
 Total assets                                      10,981.7       19,254.9       4,020.4
============================================  =============  =============  ============

 Current liabilities
---------------------------------------  ---  -------------  -------------  ------------
 Trade and other payables                        (10,161.9)     (18,599.2)     (3,269.2)
--------------------------------------------  -------------  -------------  ------------
 Interest bearing loans and borrowings                    -          (8.5)             -
---------------------------------------  ---  -------------  -------------  ------------
 Current tax liabilities                             (30.5)         (15.8)        (12.3)
--------------------------------------------  -------------  -------------  ------------
 Short term provisions                                (3.6)          (4.0)         (6.6)
--------------------------------------------  -------------  -------------  ------------
                                                 (10,196.0)     (18,627.5)     (3,288.1)
 -------------------------------------------  -------------  -------------  ------------
 Net current assets                                   329.9          237.3         271.6
============================================  =============  =============  ============

 Non-current liabilities
---------------------------------------  ---  -------------  -------------  ------------
 Interest bearing loans and borrowings              (220.0)        (219.4)       (219.7)
--------------------------------------------  -------------  -------------  ------------
 Deferred tax liabilities                            (22.0)         (19.5)        (24.1)
--------------------------------------------  -------------  -------------  ------------
 Long term provisions                                 (8.5)          (5.5)         (9.7)
--------------------------------------------  -------------  -------------  ------------
 Other long term payables                            (14.6)          (9.4)        (15.3)
--------------------------------------------  -------------  -------------  ------------
                                                    (265.1)        (253.8)       (268.8)
 -------------------------------------------  -------------  -------------  ------------
 Total liabilities                               (10,461.1)     (18,881.3)     (3,556.9)
============================================  =============  =============  ============
 Net assets                                           520.6          373.6         463.5
============================================  =============  =============  ============

 Equity
--------------------------------------------  -------------  -------------  ------------
 Share capital                                         60.9           54.4          60.9
--------------------------------------------  -------------  -------------  ------------
 Share premium account                                 17.1           17.1          17.1
--------------------------------------------  -------------  -------------  ------------
 Merger reserve                                       178.5          121.5         178.5
--------------------------------------------  -------------  -------------  ------------
 Other reserves                                   (1,178.6)      (1,184.8)     (1,173.4)
--------------------------------------------  -------------  -------------  ------------
 Retained earnings                                  1,441.0        1,364.1       1,378.8
--------------------------------------------  -------------  -------------  ------------
 Equity attributable to equity holders
  of the parent                                       518.9          372.3         461.9
--------------------------------------------  -------------  -------------  ------------
 Minority interests                                     1.7            1.3           1.6
--------------------------------------------  -------------  -------------  ------------
 Total equity                                         520.6          373.6         463.5
============================================  =============  =============  ============
Condensed Consolidated Statement of Changes in Equity
for the six months ended 30 June 2015
Equity attributable to equity holders of the parent
                              Share                 Reverse        Re-      Hedging
                    Share   premium    Merger   acquisition  valuation          and     Own    Retained              Minority    Total
                  capital   account   reserve       reserve    reserve  translation  shares    earnings    Total    interests   equity
                     GBPm      GBPm      GBPm          GBPm       GBPm         GBPm    GBPm        GBPm     GBPm         GBPm     GBPm
---------------  --------  --------  --------  ------------  ---------  -----------  ------  ----------  -------  -----------  -------


   30 June 2015
   (unaudited)
---------------  --------  --------  --------  ------------  ---------  -----------  ------  ----------  -------  -----------  -------
 Balance at
  1 January
  2015               60.9      17.1     178.5     (1,182.3)        1.4          7.6   (0.1)     1,378.8    461.9          1.6    463.5
---------------  --------  --------  --------  ------------  ---------  -----------  ------  ----------  -------  -----------  -------
 Profit for the
  period                -         -         -             -          -            -       -        88.3     88.3          0.3     88.6
---------------  --------  --------  --------  ------------  ---------  -----------  ------  ----------  -------  -----------  -------
 Other
  comprehensive
  income for
  the
  period                -         -         -             -        0.4        (5.6)       -       (3.9)    (9.1)        (0.1)    (9.2)
---------------  --------  --------  --------  ------------  ---------  -----------  ------  ----------  -------  -----------  -------
 Total
  comprehensive
  income for
  the
  period                -         -         -             -        0.4        (5.6)       -        84.4     79.2          0.2     79.4
---------------  --------  --------  --------  ------------  ---------  -----------  ------  ----------  -------  -----------  -------
 Dividends paid         -         -         -             -          -            -       -      (27.4)   (27.4)        (0.1)   (27.5)
---------------  --------  --------  --------  ------------  ---------  -----------  ------  ----------  -------  -----------  -------
 Acquisition
  related
  share-based
  payments              -         -         -             -          -            -       -         5.2      5.2            -      5.2
---------------  --------  --------  --------  ------------  ---------  -----------  ------  ----------  -------  -----------  -------
 Balance at
  30 June 2015       60.9      17.1     178.5     (1,182.3)        1.8          2.0   (0.1)     1,441.0    518.9          1.7    520.6
===============  ========  ========  ========  ============  =========  ===========  ======  ==========  =======  ===========  =======


   30 June 2014
   (unaudited)
---------------  --------  --------  --------  ------------  ---------  -----------  ------  ----------  -------  -----------  -------
 Balance at
  1 January
  2014               54.4      17.1     121.5     (1,182.3)        1.9          0.4   (0.1)     1,383.4    396.3          2.1    398.4
---------------  --------  --------  --------  ------------  ---------  -----------  ------  ----------  -------  -----------  -------
 Profit for the
  period                -         -         -             -          -            -       -         2.8      2.8          0.2      3.0
---------------  --------  --------  --------  ------------  ---------  -----------  ------  ----------  -------  -----------  -------
 Other
  comprehensive
  income for
  the
  period                -         -         -             -        0.2        (4.9)       -         2.4    (2.3)          0.1    (2.2)
---------------  --------  --------  --------  ------------  ---------  -----------  ------  ----------  -------  -----------  -------
 Total
  comprehensive
  income for
  the
  period                -         -         -             -        0.2        (4.9)       -         5.2      0.5          0.3      0.8
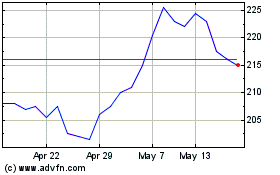
Tp Icap (LSE:TCAP)
Historical Stock Chart
From Apr 2024 to May 2024

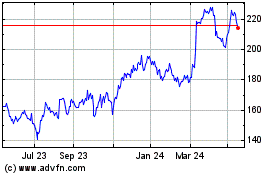
Tp Icap (LSE:TCAP)
Historical Stock Chart
From May 2023 to May 2024
