UNITED STATES
SECURITIES AND EXCHANGE COMMISSION
Washington, D.C. 20549
FORM 6-K
REPORT OF
FOREIGN PRIVATE ISSUER
PURSUANT TO RULE 13a-16 OR
15d-16
UNDER THE SECURITIES EXCHANGE ACT OF 1934
For February 17,
2021
Commission File Number: 001-35455
SSR MINING INC.
(Translation of registrant’s name into English)
#800 – 1055 Dunsmuir Street
PO Box 49088, Bentall Postal Station
Vancouver, British Columbia
Canada V7X 1G4
(Address
of principal executive offices)
Indicate by check mark whether the registrant files or will file annual reports under cover Form 20-F
or Form 40-F.
☐ Form
20-F ☒ Form 40-F
Indicate by check mark if the registrant is submitting the Form 6-K in paper as permitted by
Regulation S-T Rule 101(b)(1): ☐
Indicate by check mark if the registrant is
submitting the Form 6-K in paper as permitted by Regulation S-T Rule 101(b)(7): ☐
DOCUMENTS FILED AS PART OF THIS FORM 6-K
See the Exhibit Index hereto.
SIGNATURES
Pursuant to the requirements of the Securities Exchange Act of 1934, the registrant has duly caused this report to be signed on its behalf by
the undersigned, thereunto duly authorized.
|
|
|
|
|
|
|
|
|
|
|
SSR Mining Inc. |
|
|
|
|
(Registrant) |
|
|
|
|
| Date: February 17, 2021 |
|
|
|
By: |
|
Signed: “Gregory Martin” |
|
|
|
|
|
|
Gregory Martin |
|
|
|
|
Title: |
|
Executive Vice President and Chief Financial Officer |

SUBMITTED HEREWITH
Exhibit 99.1

CONSOLIDATED FINANCIAL
STATEMENTS FOR THE YEARS ENDED
DECEMBER 31, 2020 AND 2019
Contents
| SSR Mining Inc. | Financial Statements Year-End 2020 | | 2 |
SSR Mining Inc.
Management's Report
Management’s
Responsibility for the Consolidated Financial Statements
The preparation and presentation of
the accompanying consolidated financial statements and Management’s Discussion and Analysis (“MD&A”) are
the responsibility of management and have been approved by the Board of Directors of SSR Mining Inc. (the "Company" or
"SSR Mining").
The consolidated financial statements
have been prepared in accordance with International Financial Reporting Standards as issued by the International Accounting Standards
Board. Consolidated financial statements, by nature, are not precise since they include certain amounts based upon estimates and
judgments. When alternative methods exist, management has chosen those it deems to be the most appropriate in the circumstances.
Management, under the supervision of
and the participation of the Chief Executive Officer and the Chief Financial Officer, has a process in place to evaluate disclosure
controls and procedures and internal control over financial reporting as required by Canadian and U.S. securities regulations.
We, as Chief Executive Officer and as Chief Financial Officer, will certify our annual filings with the Canadian Securities Administrators
and the U.S. Securities and Exchange Commission as required in Canada by National Instrument 52-109 and in the United States as
required by the Sarbanes-Oxley Act of 2002.
The Board of Directors is responsible
for ensuring that management fulfills its responsibilities for financial reporting and is ultimately responsible for reviewing
and approving the consolidated financial statements. The Board carries out this responsibility principally through its Audit Committee
which is independent from management.
The Audit Committee is appointed by
the Board of Directors and reviews the consolidated financial statements and MD&A; considers the report of the external auditors;
assesses the adequacy of the Company's internal controls, including management’s assessment described below; examines the
fees and expenses for audit services; and recommends to the Board the independent auditors for appointment by the shareholders.
The independent auditors have full and free access to the Audit Committee and meet with it to discuss their audit work, our internal
control over financial reporting and financial reporting matters. The Audit Committee reports its findings to the Board for consideration
when approving the consolidated financial statements for issuance to the shareholders and management’s assessment of the
internal control over financial reporting.
Management’s
Report on Internal Control over Financial Reporting
Management has assessed the effectiveness
of SSR Mining's internal control over financial reporting as of December 31, 2020. In making this assessment, management used
the criteria established in Internal Control - Integrated Framework (2013) issued by the Committee of Sponsoring Organizations
of the Treadway Commission. Based on this evaluation, management concluded that the Company's internal control over financial reporting
was effective as of December 31, 2020.
PricewaterhouseCoopers LLP, an independent
registered public accounting firm appointed by the shareholders, has audited the effectiveness of the Company's internal control
over financial reporting as of December 31, 2020, as stated in their report which appears herein.
| "Rodney P. Antal" |
"Gregory J. Martin" |
| Rodney P. Antal |
Gregory J. Martin |
| President and Chief Executive Officer |
Executive Vice President and Chief Financial Officer |
| |
|
| February 17, 2021 |
|
| SSR Mining Inc. | Financial Statements Year-End 2020 | | 3 |
SSR Mining Inc.
Report of Independent Registered Public Accounting
Firm
To the Shareholders
and Board of Directors of SSR Mining Inc.
Opinions on the Financial Statements and
Internal Control over Financial Reporting
We have audited the accompanying consolidated
statements of financial position of SSR Mining Inc. and its subsidiaries (together, the Company) as of December 31, 2020 and 2019,
and the related consolidated statements of income, comprehensive income, cash flows and changes in shareholders’ equity for
the years then ended, including the related notes (collectively referred to as the consolidated financial statements). We also
have audited the Company's internal control over financial reporting as of December 31, 2020, based on criteria established in
Internal Control - Integrated Framework (2013) issued by the Committee of Sponsoring Organizations of the Treadway Commission (COSO).
In our opinion, the consolidated financial
statements referred to above present fairly, in all material respects, the financial position of the Company as of December 31,
2020 and 2019, and its financial performance and its cash flows for the years then ended in conformity with International Financial
Reporting Standards as issued by the International Accounting Standards Board. Also in our opinion, the Company maintained, in
all material respects, effective internal control over financial reporting as of December 31, 2020, based on criteria established
in Internal Control - Integrated Framework (2013) issued by the COSO.
Basis for Opinions
The Company's management is responsible
for these consolidated financial statements, for maintaining effective internal control over financial reporting, and for its assessment
of the effectiveness of internal control over financial reporting, included in the accompanying Management's Report on Internal
Control over Financial Reporting. Our responsibility is to express opinions on the Company’s consolidated financial statements
and on the Company's internal control over financial reporting based on our audits. We are a public accounting firm registered
with the Public Company Accounting Oversight Board (United States) (PCAOB) and are required to be independent with respect to the
Company in accordance with the U.S. federal securities laws and the applicable rules and regulations of the Securities and Exchange
Commission and the PCAOB.
We conducted our audits in accordance with
the standards of the PCAOB. Those standards require that we plan and perform the audits to obtain reasonable assurance about whether
the consolidated financial statements are free of material misstatement, whether due to error or fraud, and whether effective internal
control over financial reporting was maintained in all material respects.
Our audits of the consolidated financial
statements included performing procedures to assess the risks of material misstatement of the consolidated financial statements,
whether due to error or fraud, and performing procedures that respond to those risks. Such procedures included examining, on a
test basis, evidence regarding the amounts and disclosures in the consolidated financial statements. Our audits also included evaluating
the accounting principles used and significant estimates made by management, as well as evaluating the overall presentation of
the consolidated financial statements. Our audit of internal control over financial reporting included obtaining an understanding
of internal control over financial reporting, assessing the risk that a material weakness exists, and testing and evaluating the
design and operating effectiveness of internal control based on the assessed risk. Our audits also included performing such other
procedures as we considered necessary in the circumstances. We believe that our audits provide a reasonable basis for our opinions.
As described in Management's Report on
Internal Control over Financial Reporting, management has excluded Alacer Gold Corp. from its assessment of internal control over
financial reporting as of December 31, 2020 because it was acquired by the Company in a purchase business combination during the
year ended December 31, 2020. We have also excluded Alacer Gold Corp. from our audit of internal control over financial reporting.
Alacer Gold Corp. is a wholly owned subsidiary whose total assets and total revenues excluded from management’s assessment
and our audit of internal control over financial reporting represent 67% and 24%, respectively, of the related consolidated financial
statement amounts as of and for the year ended December 31, 2020.
| SSR Mining Inc. | Financial Statements Year-End 2020 | | 4 |
SSR Mining Inc.
Report of Independent Registered Public Accounting
Firm
Definition and Limitations
of Internal Control over Financial Reporting
A company’s internal control over
financial reporting is a process designed to provide reasonable assurance regarding the reliability of financial reporting and
the preparation of financial statements for external purposes in accordance with generally accepted accounting principles. A company’s
internal control over financial reporting includes those policies and procedures that (i) pertain to the maintenance of records
that, in reasonable detail, accurately and fairly reflect the transactions and dispositions of the assets of the company; (ii)
provide reasonable assurance that transactions are recorded as necessary to permit preparation of financial statements in accordance
with generally accepted accounting principles, and that receipts and expenditures of the company are being made only in accordance
with authorizations of management and directors of the company; and (iii) provide reasonable assurance regarding prevention or
timely detection of unauthorized acquisition, use, or disposition of the company’s assets that could have a material effect
on the financial statements.
Because of its inherent limitations, internal
control over financial reporting may not prevent or detect misstatements. Also, projections of any evaluation of effectiveness
to future periods are subject to the risk that controls may become inadequate because of changes in conditions, or that the degree
of compliance with the policies or procedures may deteriorate.
Critical Audit Matters
The critical audit matters communicated
below are matters arising from the current period audit of the consolidated financial statements that were communicated or required
to be communicated to the audit committee and that (i) relate to accounts or disclosures that are material to the consolidated
financial statements and (ii) involved our especially challenging, subjective, or complex judgments. The communication of critical
audit matters does not alter in any way our opinion on the consolidated financial statements, taken as a whole, and we are not,
by communicating the critical audit matters below, providing separate opinions on the critical audit matters or on the accounts
or disclosures to which they relate.
Fair value of a significant
portion of mineral properties acquired as part of the acquisition of Alacer Gold Corp.
As described in Notes 2, 3, 4, and 9 to
the consolidated financial statements, the Company acquired all of the issued and outstanding common shares of Alacer Gold Corp.
(Alacer) on September 16, 2020. Total consideration paid by the Company for Alacer shares was $2.2 billion, of which $1.8 billion
was determined to be related to the fair value of mineral properties acquired. To determine the fair value of a significant portion
of mineral properties management used discounted cash flow models. Management applied significant judgment in determining the fair
value, including the use of significant assumptions such as future metal prices, production based on current estimates of Mineral
Reserves and recoverable Mineral Resources, future operating costs and capital expenditures, and discount rates. The Company’s
estimates of Mineral Reserves and Mineral Resources are based on information prepared by qualified persons (management’s
specialists).
The principal considerations for our determination
that performing procedures relating to the fair value of a significant portion of mineral properties acquired as part of the acquisition
of Alacer is a critical audit matter are (i) there was significant judgment required by management, including the use of management’s
specialists, in determining the fair value of a significant portion of mineral properties, which were based on discounted cash
flow models, including the use of significant assumptions such as future metal prices, production based on current estimates of
Mineral Reserves and recoverable Mineral Resources, future operating costs and capital expenditures, and discount rates; (ii) the
degree of auditor judgment, subjectivity and effort in performing procedures and evaluating audit evidence relating to the fair
value measurement of a significant portion of mineral properties, acquired; and (iii) the audit effort included the involvement
of professionals with specialized skill and knowledge.
| SSR Mining Inc. | Financial Statements Year-End 2020 | | 5 |
SSR Mining Inc.
Report of Independent Registered Public Accounting
Firm
Addressing the matter involved performing
procedures and evaluating audit evidence in connection with forming our overall opinion on the consolidated financial statements.
These procedures included testing the effectiveness of controls relating to the fair value of a significant portion of mineral
properties, including controls relating to the significant assumptions used in those management estimates. These procedures also
included, among others (i) testing management’s process for determining the fair value of a significant portion of mineral
properties; (ii) evaluating the appropriateness of the discounted cash flow models; (iii) testing the completeness and accuracy
of the underlying data used in the models; and (iv) evaluating the reasonableness of the significant assumptions used by management,
including the future metal prices, production based on current estimates of Mineral Reserves and recoverable Mineral Resources,
future operating costs and capital expenditures, and discount rates. Evaluating the reasonableness of the future metal prices assumptions
involved comparing those prices to external market and industry data. Evaluating the reasonableness of future operating costs and
capital expenditures involved comparing these costs and expenditures to historical results. The work of management’s specialists
was used in performing the procedures to evaluate the reasonableness of the production based on current estimates of Mineral Reserve
and recoverable Mineral Resources. As a basis for using this work, management’s specialists’ qualifications were understood
and the Company’s relationship with management’s specialists was assessed. The procedures performed also included evaluation
of the methods and assumptions used by management’s specialists, tests of the data used by management’s specialists
and an evaluation of management’s specialists’ findings. Professionals with specialized skill and knowledge assisted
us in evaluating the reasonableness of the discount rates.
Recoverable amount of
goodwill
As described in Notes 2, 3 and 11 to the
consolidated financial statements, the Company’s goodwill balance was $49.8 million as at December 31, 2020, and arose from
the acquisition of Seabee Gold Operation (Seabee). The goodwill is required to be tested annually for impairment and when events
or changes in circumstances indicate that the related carrying amount may not be recoverable. For the purpose of the goodwill impairment
test, the recoverable amount of the Seabee cash-generating unit (the Seabee CGU), was determined to be the fair value less costs
of disposal and was based on a discounted cash flow model. The recoverable amount of the Seabee CGU determined by management exceeded
its carrying value, and as a result no impairment loss was recorded. Management applied significant judgment in determining the
recoverable amount, including the use of significant assumptions such as future metal prices, production based on current estimates
of Mineral Reserves and recoverable Mineral Resources, future operating costs and capital expenditures, the discount rate and future
Canadian dollar to U.S. dollar foreign exchange rates. The Company’s estimates of Mineral Reserves and Mineral Resources
are based on information prepared by qualified persons (management’s specialists).
The principal considerations for our determination
that performing procedures relating to the recoverable amount of goodwill is a critical audit matter are: (i) there was significant
judgment exercised by management, including the use of management’s specialists, in determining the recoverable amount of
goodwill which was based on a discounted cash flow model, including the use of significant assumptions such as future metal prices,
production based on current estimates of Mineral Reserves and recoverable Mineral Resources, future operating costs and capital
expenditures, the discount rate and future Canadian dollar to U.S. dollar foreign exchange rates; (ii) the degree of auditor judgment,
subjectivity and effort in performing procedures and in evaluating audit evidence relating to the determination of the recoverable
amount of goodwill; and (iii) the audit effort included the use of professionals with specialized skill and knowledge.
| SSR Mining Inc. | Financial Statements Year-End 2020 | | 6 |
SSR Mining Inc.
Report of Independent Registered Public Accounting
Firm
Addressing the matter involved performing
procedures and evaluating audit evidence in connection with forming our overall opinion on the consolidated financial statements.
These procedures involved testing the effectiveness of internal controls relating to management’s goodwill impairment assessment,
including controls over the recoverable amount of the Seabee CGU. These procedures also included, among others, (i) testing management’s
process for determining the recoverable amount of the Seabee CGU; (ii) evaluating the appropriateness of the discounted cash flow
model; (iii) testing the completeness and accuracy of underlying data used in the model; and (iv) evaluating the reasonableness
of the significant assumptions used by management, including future metal prices, production based on current estimates of Mineral
Reserves and recoverable Mineral Resources, future operating costs and capital expenditures, the discount rate and future Canadian
dollar to U.S. dollar foreign exchange rates. Evaluating the reasonableness of the future metal prices and future Canadian dollar
to U.S. dollar foreign exchange rates assumptions involved comparing them to external market and industry data. Evaluating the
reasonableness of future operating costs and capital expenditures involved comparing these costs and expenditures to historical
results. The work of management’s specialists was used in performing the procedures to evaluate the reasonableness of the
production based on current estimates of Mineral Reserve and recoverable Mineral Resources. As a basis for using this work, management’s
specialists’ qualifications were understood and the Company’s relationship with management’s specialists was
assessed. The procedures performed also included evaluation of the methods and assumptions used by management’s specialists,
tests of the data used by management’s specialists and an evaluation of management’s specialists’ findings. Professionals
with specialized skill and knowledge assisted us in evaluating the reasonableness of the discount rate.
/s/ PricewaterhouseCoopers LLP
Chartered Professional Accountants
Vancouver, Canada
February 17, 2021
We have served as the Company's auditor
since 1989.
| SSR Mining Inc. | Financial Statements Year-End 2020 | | 7 |
SSR Mining Inc.
Consolidated Statements of Financial Position
(expressed in thousands of United States dollars)
| |
|
December 31 |
December 31 |
| |
Note |
2020 |
2019 |
| Current assets |
|
|
|
| Cash and cash equivalents |
5 |
$ |
860,637 |
|
$ |
503,647 |
|
| Marketable securities |
6 |
26,748 |
|
66,453 |
|
| Trade and other receivables |
7 |
83,491 |
|
71,828 |
|
| Inventories |
8 |
437,379 |
|
237,570 |
|
| Prepaids and other current assets |
|
16,267 |
|
20,164 |
|
| |
|
1,424,522 |
|
899,662 |
|
| Non-current assets |
|
|
|
| Mineral properties, plant and equipment |
9 |
3,565,905 |
|
769,462 |
|
| Inventories - non-current |
8 |
134,612 |
|
1,848 |
|
| Restricted cash |
10 |
35,288 |
|
2,339 |
|
| Investments in joint ventures |
|
7,782 |
|
- |
|
| Goodwill |
11 |
49,786 |
|
49,786 |
|
| Deferred income tax assets |
12 |
4,612 |
|
63 |
|
| Other |
|
22,479 |
|
26,947 |
|
| Total assets |
|
$ |
5,244,986 |
|
$ |
1,750,107 |
|
| |
|
|
|
| Current liabilities |
|
|
|
| Accounts payable and accrued liabilities |
13 |
$ |
175,984 |
|
$ |
111,125 |
|
| Debt |
14 |
71,025 |
|
114,280 |
|
| Reclamation and closure cost provision |
15 |
1,924 |
|
8,766 |
|
| |
|
248,933 |
|
234,171 |
|
| Non-current liabilities |
|
|
|
| Debt |
14 |
319,645 |
|
169,769 |
|
| Lease liabilities |
16 |
117,029 |
|
3,346 |
|
| Reclamation and closure cost provision |
15 |
117,650 |
|
75,469 |
|
| Deferred income tax liabilities |
12 |
483,449 |
|
127,815 |
|
| Other |
|
18,377 |
|
5,583 |
|
| Total liabilities |
|
1,305,083 |
|
616,153 |
|
| |
|
|
|
| Shareholders' equity |
|
|
|
| Common shares |
17 |
3,220,795 |
|
1,083,766 |
|
| Other reserves |
18 |
40,570 |
|
19,762 |
|
| Equity component of convertible notes |
14(a) |
106,425 |
|
106,425 |
|
| Retained earnings (deficit) |
|
58,487 |
|
(75,999) |
|
| Total equity attributable to equity holders of SSR Mining |
|
3,426,277 |
|
1,133,954 |
|
| Non-controlling interest |
19 |
513,626 |
|
- |
|
| Total equity |
|
3,939,903 |
|
1,133,954 |
|
| Total liabilities and equity |
|
$ |
5,244,986 |
|
$ |
1,750,107 |
|
| |
|
|
|
| Commitments (note 27(c)) |
|
|
|
The accompanying notes are an integral part of the consolidated
financial statements
Approved by the Board of Directors
and authorized for issue on February 17, 2021.
| "Beverlee F. Park" |
|
"Rodney P. Antal" |
| Beverlee F. Park, Director |
|
Rodney P. Antal, Director |
| SSR Mining Inc. | Financial Statements Year-End 2020 | | 8 |
SSR Mining Inc.
Consolidated Statements of Income
(expressed in thousands of United States dollars,
except for per share amounts)
| |
Note |
2020 |
2019 |
| Revenue |
20 |
$ |
853,089 |
|
$ |
606,850 |
|
| Cost of sales |
|
|
|
| Production costs |
21 |
(418,652) |
|
(329,810) |
|
| Depletion and depreciation |
25 |
(125,795) |
|
(106,157) |
|
| |
|
(544,447) |
|
(435,967) |
|
| Income from mine operations |
|
308,642 |
|
170,883 |
|
| General and administrative expense |
22 |
(24,626) |
|
(18,115) |
|
| Share-based compensation expense |
17 |
(8,500) |
|
(12,814) |
|
| Exploration, evaluation and reclamation expense |
25 |
(22,397) |
|
(17,616) |
|
| Care and maintenance expense |
25 |
(29,593) |
|
- |
|
| Transaction and integration expense |
4(a) |
(20,813) |
|
- |
|
| Operating income |
|
202,713 |
|
122,338 |
|
| Interest and other finance income |
23(a) |
6,545 |
|
11,910 |
|
| Interest expense and other finance costs |
23(b) |
(26,787) |
|
(31,598) |
|
| Loss on redemption of convertible debt |
14(a) |
- |
|
(5,423) |
|
| Other income (expense) |
|
2,605 |
|
(5,739) |
|
| Foreign exchange loss |
|
(3,755) |
|
(5,359) |
|
| Income before income taxes |
|
181,321 |
|
86,129 |
|
| Income tax expense |
12 |
(40,853) |
|
(30,372) |
|
| Net income |
|
$ |
140,468 |
|
$ |
55,757 |
|
| Attributable to: |
|
|
|
| Equity holders of SSR Mining |
|
$ |
133,494 |
|
$ |
57,315 |
|
| Non-controlling interest |
19 |
6,974 |
|
(1,558) |
|
| |
|
$ |
140,468 |
|
$ |
55,757 |
|
| Net income per share attributable to equity holders of SSR Mining |
|
|
|
| Basic |
24 |
$0.88 |
|
$0.47 |
|
| Diluted |
24 |
$0.87 |
|
$0.47 |
|
The accompanying notes are an integral part of the consolidated
financial statements
| SSR Mining Inc. | Financial Statements Year-End 2020 | | 9 |
SSR Mining Inc.
Consolidated Statements of Comprehensive
Income
(expressed in thousands of United States dollars)
| |
Note |
2020 |
2019 |
| Net income |
|
$ |
140,468 |
|
$ |
55,757 |
|
| Other comprehensive income |
|
|
|
| Items that will not be reclassified to net income: |
|
|
|
| Gain on marketable securities at FVTOCI, net of tax expense of $2,964 and $4,811 |
6 |
19,297 |
|
29,819 |
|
| Items that may be subsequently reclassified to net income: |
|
|
|
| Unrealized (loss) gain on effective portion of derivative, net of tax recovery (expense) of $87 and $(702) |
27(a) |
(5,215) |
|
2,226 |
|
| Realized loss on derivatives reclassified to net income |
27(a) |
4,513 |
|
- |
|
| Total other comprehensive income |
|
18,595 |
|
32,045 |
|
| Total comprehensive income |
|
$ |
159,063 |
|
$ |
87,802 |
|
| Attributable to: |
|
|
|
| Equity holders of SSR Mining |
|
$ |
152,089 |
|
$ |
89,360 |
|
| Non-controlling interest |
|
6,974 |
|
(1,558) |
|
| Total comprehensive income |
|
$ |
159,063 |
|
$ |
87,802 |
|
The accompanying notes are an integral part of the consolidated
financial statements
| SSR Mining Inc. | Financial Statements Year-End 2020 | | 10 |
SSR Mining Inc.
Consolidated Statements of Cash Flows
(expressed in thousands of United States dollars)
| |
Note |
2020 |
2019 |
| |
|
|
Restated (1) |
| Cash flows from operating activities |
|
|
|
| Net income for the year |
|
$ |
140,468 |
|
$ |
55,757 |
|
| Adjustments for: |
|
|
|
| Depletion and depreciation |
|
126,429 |
|
108,247 |
|
| Interest and other finance income |
23(a) |
(6,545) |
|
(11,910) |
|
| Interest expense |
|
25,420 |
|
30,010 |
|
| Income tax expense |
12 |
40,853 |
|
30,372 |
|
| Non-cash foreign exchange (gain) loss |
|
(159) |
|
2,162 |
|
| Loss on redemption of convertible debt |
14(a) |
- |
|
5,423 |
|
| Other |
29 |
2,834 |
|
11,541 |
|
| Net change in operating assets and liabilities |
29 |
63,059 |
|
(64,908) |
|
| Cash generated from operating activities before taxes |
|
392,359 |
|
166,694 |
|
| Income taxes paid |
|
(43,744) |
|
(20,850) |
|
| Cash generated by operating activities |
|
348,615 |
|
145,844 |
|
| Cash flows from investing activities |
|
|
|
| Expenditures on mineral properties, plant and equipment |
|
(169,340) |
|
(135,768) |
|
| Purchases of marketable securities |
6 |
(29,550) |
|
(3,435) |
|
| Net proceeds from sales of marketable securities |
6 |
97,098 |
|
3,308 |
|
| Interest received |
|
3,665 |
|
9,697 |
|
| Acquisition of non-controlling interest |
4(b) |
- |
|
(2,415) |
|
| Cash and cash equivalents acquired in Alacer acquisition |
4(a) |
270,445 |
|
- |
|
| Other |
|
8,472 |
|
(1,715) |
|
| Cash generated by (used in) investing activities |
|
180,790 |
|
(130,328) |
|
| Cash flows from financing activities |
|
|
|
| Repayment of debt, principal |
14 |
(35,000) |
|
- |
|
| Interest paid |
|
(13,679) |
|
(11,646) |
|
| Redemption of convertible notes |
14(a) |
(114,994) |
|
(152,250) |
|
| Proceeds from Issuance of convertible notes, net of transaction costs |
14(a) |
- |
|
222,932 |
|
| Proceeds from issuance of debt |
14 |
3,088 |
|
- |
|
| Proceeds from exercise of stock options |
|
6,728 |
|
7,237 |
|
| Settlement of restricted share units ("RSUs") and performance share units ("PSUs") |
17 |
(14,464) |
|
- |
|
| Funding from non-controlling interest |
|
- |
|
3,710 |
|
| Lease payments |
16 |
(4,883) |
|
(1,076) |
|
| Cash (used in) generated by financing activities |
|
(173,204) |
|
68,907 |
|
| Effect of foreign exchange rate changes on cash and cash equivalents |
|
789 |
|
12 |
|
| Increase in cash and cash equivalents |
|
356,990 |
|
84,435 |
|
| Cash and cash equivalents, beginning of year |
|
503,647 |
|
419,212 |
|
| Cash and cash equivalents, end of year |
|
$ |
860,637 |
|
$ |
503,647 |
|
Supplemental cash flow information (note 29)
The accompanying notes are an integral part of the consolidated
financial statements
| SSR Mining Inc. | Financial Statements Year-End 2020 | | 11 |
SSR Mining Inc.
Consolidated Statements of Changes in Shareholders'
Equity
(expressed in thousands of United States dollars)
| |
|
Common shares |
Other reserves
(note 18) |
Equity
component of convertible notes |
|
Total equity
attributable to equity holders of SSR Mining |
|
|
| |
Note |
Number of shares
(000's) |
Amount |
Retained earnings (deficit) |
Non-controlling
interest |
Total
equity |
| Balance, January 1, 2019 |
|
120,740 |
|
$ |
1,055,417 |
|
$ |
(16,303) |
|
$ |
68,347 |
|
$ |
(133,314) |
|
$ |
974,147 |
|
$ |
31,829 |
|
$ |
1,005,976 |
|
| Exercise of stock options and settlement of RSUs |
17 |
1,098 |
|
10,131 |
|
(2,804) |
|
- |
|
- |
|
7,327 |
|
- |
|
7,327 |
|
| Acquisition of non-controlling interest |
4(b) |
1,246 |
|
18,218 |
|
1,463 |
|
- |
|
- |
|
19,681 |
|
(33,981) |
|
(14,300) |
|
| Equity-settled share-based compensation |
17 |
- |
|
- |
|
4,005 |
|
- |
|
- |
|
4,005 |
|
- |
|
4,005 |
|
| Transfer of equity-settled PSUs |
17(e) |
- |
|
- |
|
1,356 |
|
- |
|
- |
|
1,356 |
|
- |
|
1,356 |
|
| Equity value of convertible debt issued |
14(a) |
- |
|
- |
|
- |
|
42,903 |
|
- |
|
42,903 |
|
- |
|
42,903 |
|
| Equity value of convertible debt redeemed |
14(a) |
- |
|
- |
|
- |
|
(4,825) |
|
- |
|
(4,825) |
|
- |
|
(4,825) |
|
| Funding from non-controlling interest |
|
- |
|
- |
|
- |
|
- |
|
- |
|
- |
|
3,710 |
|
3,710 |
|
| Total comprehensive income (loss) for the year |
|
|
|
|
|
|
|
|
|
| Net income (loss) |
|
- |
|
- |
|
- |
|
- |
|
57,315 |
|
57,315 |
|
(1,558) |
|
55,757 |
|
| Other comprehensive income |
|
- |
|
- |
|
32,045 |
|
- |
|
- |
|
32,045 |
|
- |
|
32,045 |
|
| |
|
- |
|
- |
|
32,045 |
|
- |
|
57,315 |
|
89,360 |
|
(1,558) |
|
87,802 |
|
| Balance, December 31, 2019 |
|
123,084 |
|
1,083,766 |
|
19,762 |
|
106,425 |
|
(75,999) |
|
1,133,954 |
|
- |
|
1,133,954 |
|
| Acquisition of Alacer |
4(a) |
95,700 |
|
2,127,284 |
|
15,419 |
|
- |
|
- |
|
2,142,703 |
|
506,652 |
|
2,649,355 |
|
| Exercise of stock options |
17 |
825 |
|
9,704 |
|
(2,976) |
|
- |
|
- |
|
6,728 |
|
- |
|
6,728 |
|
| Settlement of RSUs and PSUs |
17 |
- |
|
75 |
|
(15,632) |
|
- |
|
1,168 |
|
(14,389) |
|
- |
|
(14,389) |
|
| Transfer of cash-settled RSUs and PSUs |
17 |
- |
|
- |
|
(4,138) |
|
- |
|
900 |
|
(3,238) |
|
- |
|
(3,238) |
|
| Equity-settled share-based compensation |
17 |
- |
|
- |
|
8,494 |
|
- |
|
- |
|
8,494 |
|
- |
|
8,494 |
|
| Issued on redemption of convertible debt |
14(a) |
- |
|
6 |
|
- |
|
- |
|
- |
|
6 |
|
- |
|
6 |
|
| Other |
|
(2) |
|
(40) |
|
1,046 |
|
- |
|
(1,076) |
|
(70) |
|
- |
|
(70) |
|
| Total comprehensive income for the year |
|
|
|
|
|
|
|
|
|
| Net income |
|
- |
|
- |
|
- |
|
- |
|
133,494 |
|
133,494 |
|
6,974 |
|
140,468 |
|
| Other comprehensive income |
|
- |
|
- |
|
18,595 |
|
- |
|
- |
|
18,595 |
|
- |
|
18,595 |
|
| |
|
- |
|
- |
|
18,595 |
|
- |
|
133,494 |
|
152,089 |
|
6,974 |
|
159,063 |
|
| Balance, December 31, 2020 |
|
219,607 |
|
$ |
3,220,795 |
|
$ |
40,570 |
|
$ |
106,425 |
|
$ |
58,487 |
|
$ |
3,426,277 |
|
$ |
513,626 |
|
$ |
3,939,903 |
|
The accompanying notes are an integral part of the consolidated
financial statements
| SSR Mining Inc. | Financial Statements Year-End 2020 | | 12 |
SSR Mining Inc. Notes to the Consolidated Financial Statements (tabular amounts expressed in thousands of United States dollars unless otherwise stated) |
SSR
Mining Inc. (the "Company" or "SSR Mining") is a company incorporated under the laws of the Province of British
Columbia, Canada. The Company's common shares are listed on the Toronto Stock Exchange (TSX) in Canada and the Nasdaq Global Select
Market (NASDAQ) in the United States under the symbol "SSRM" and the Australian Securities Exchange (ASX) in Australia
under the symbol "SSR".
The
Company and its subsidiaries (collectively, the "Group") are principally engaged in the operation, acquisition, exploration
and development of precious metal resource properties located in Turkey and the Americas. The Company has four producing mines
and a portfolio of precious metal dominant projects located in Turkey and throughout the Americas. SSR Mining Inc. is the ultimate
parent of the Group.
The
Company's corporate office is at Suite 800, 1055 Dunsmuir Street, PO Box 49088, Vancouver, British Columbia, Canada, V7X 1G4. Its
executive office is at Suite 800, 7001 E. Belleview Avenue, Denver, Colorado, USA., 80237.
The
Company's focus is on safe, profitable gold and silver production from its Çöpler Gold Mine ("Çöpler")
in Erzincan, Turkey, Marigold mine ("Marigold") in Nevada, USA, Seabee Gold Operation ("Seabee") in Saskatchewan,
Canada and Puna Operations ("Puna") in Jujuy, Argentina, and to advance, as market and project conditions permit, its
principal development projects towards development and commercial production.
Significant
developments during the year ended December 31, 2020
(a) Acquisition
of Alacer
On
September 16, 2020, the Company completed the acquisition of Alacer Gold Corp. ("Alacer"). The results of operations
of Alacer are included in these consolidated financial statements from September 16, 2020 (note 4(a)).
The
Company acquired all of the issued and outstanding common shares of Alacer, with Alacer shareholders receiving 0.3246 of an SSR
Mining common share for every one Alacer share (the "Exchange Ratio"). The transaction resulted in the issuance of 95,699,911
SSR Mining common shares to the former shareholders of Alacer. Furthermore, all outstanding restricted share units, performance
share units and deferred share units of Alacer that were not exercised prior to the acquisition date were replaced with SSR Mining
units (the "RSU Replacement Units", the "PSU Replacement Units", and the "DSU Replacement Units",
respectively), with the number of such securities issued adjusted by the Exchange Ratio.
Upon
closing of the transaction, SSR Mining and former Alacer shareholders owned 57% and 43%, respectively, of the shares of the combined
entity. With the completion of the transaction, Alacer has become a wholly-owned subsidiary of SSR Mining. Alacer holds an 80%
interest in Anagold Madencilik Sanayi ve Ticaret Anonim Şirketi ("Anagold"), the owner and operator of Çöpler,
a large-scale open pit gold mine in east-central Turkey. The 20% non-controlling interest in Anagold is held by Lidya Madencilik
Sanayi ve Ticaret Anonim Şirketi ("Lidya Mining").
(b) COVID-19
Response and Impact on Operations
During the year ended December
31, 2020, the coronavirus disease 2019 ("COVID-19") pandemic has negatively impacted global economic and certain financial
markets. Many industries have been impacted by the COVID-19 pandemic and are facing operating challenges associated with the regulations
and guidelines resulting from efforts to contain it.
The Company continues to restrict
all non-essential travel and manage the contact of its employees and contractors in order to reduce the risk of COVID-19 impacting
its operations. The Company is operating its corporate offices at minimal capacity, with most employees working remotely.
| SSR Mining Inc. | Financial Statements Year-End 2020 | | 13 |
SSR Mining Inc. Notes to the Consolidated Financial Statements (tabular amounts expressed in thousands of United States dollars unless otherwise stated) |
| 1. | NATURE OF OPERATIONS (continued) |
(b) COVID-19
Response and Impact on Operations (continued)
Seabee and Puna were placed
into care and maintenance near the end of the first quarter of 2020 and subsequently restarted through the second and third quarters
of 2020. While there have been some impacts caused by the COVID-19 pandemic, Çöpler's and Marigold's operations have
continued uninterrupted.
At Seabee, phased re-start plans
were successfully implemented during the third quarter. In July, ore extraction and development rates ramped up and, in early August,
milling operations re-commenced. Prior to restarting the mill, the Company built up an ore stockpile, which provided the mill with
operating flexibility relative to mine extraction. Operations have returned to or exceeded pre-COVID-19 rates since August. Maintaining
flight and camp operations within determined health and safety protocols continue to be an ongoing focus.
At Puna, operations returned
to production late in the second quarter, with the recommencement of mining, hauling and milling operations. During the third quarter,
COVID-19 infection rates in the Province of Jujuy escalated, resulting in further interruptions to operations. Puna suspended operations
in September in order to manage camp occupancy, conduct testing for employees and contractors and reduce the risk of transmission.
Mining and milling activities returned to pre-COVID-19 operating levels at the beginning of October. Strict protocols remain in
place to manage the COVID-19 risk within the camp and operations.
During the temporary suspensions
at Seabee and Puna, the sites continued to perform care and maintenance activities. Costs incurred during the suspensions associated
with these activities have been separately identified and accounted for as care and maintenance expense within operating income
in the consolidated statements of income.
At Çöpler and Marigold,
the sites continue to operate with limited impact from COVID-19 and have implemented numerous measures intended to protect employees,
including quarantining, testing, ensuring physical distancing and providing additional protective equipment. COVID-19 is slowing
government processes including permitting. In Turkey, considerable effort is being expended to attain permits and land access for
continued growth and operations.
Currently, Çöpler,
Marigold, Seabee and Puna are all operating with some impacts caused by the COVID-19 pandemic. Each of the sites continue to work
with national and local authorities in accordance with applicable regulations and remain vigilant with respect to on-site specific
protocols to protect the health and safety of their employees and stakeholders; however, all sites remain exposed to potential
COVID-19 impacts.
| 2. | SUMMARY OF SIGNIFICANT ACCOUNTING POLICIES |
The
significant accounting policies used in the preparation of these consolidated financial statements are as follows:
These
consolidated financial statements have been prepared in accordance with International Financial Reporting Standards ("IFRS")
as issued by the International Accounting Standards Board (the "IASB"). These statements were authorized for issue by
the Board of Directors on February 17, 2021.
These
consolidated financial statements have been prepared on the historical cost basis, except for certain financial assets and liabilities
that are measured at fair values at the end of each reporting period.
| SSR Mining Inc. | Financial Statements Year-End 2020 | | 14 |
SSR Mining Inc. Notes to the Consolidated Financial Statements (tabular amounts expressed in thousands of United States dollars unless otherwise stated) |
| 2. | SUMMARY OF SIGNIFICANT ACCOUNTING POLICIES (continued) |
(c) Basis
of consolidation
Subsidiaries
These
consolidated financial statements incorporate the financial statements of SSR Mining and all its subsidiaries. Intercompany assets,
liabilities, equity, income, expenses and cash flows between SSR Mining and its subsidiaries have been eliminated on consolidation.
Subsidiaries are entities over which the Company has control. The Company controls an entity when it is exposed to, or has rights
to, variable returns from its involvement with the entity and has the ability to affect those returns through its power over the
entity. The existence and effect of potential voting rights that are currently exercisable or convertible are considered when assessing
whether the Company controls an entity. Subsidiaries are included in the Company's consolidated financial results from the effective
date of acquisition of control up to the effective date of loss of control.
For
non-wholly owned subsidiaries, the net assets attributable to external equity shareholders are presented as non-controlling interests
within equity in the condensed consolidated statement of financial position.
Non-controlling
interests
Subsequent
to initial recognition (note 2(d)), the carrying amount of non-controlling interests is increased or decreased to recognize the
non-controlling interests' share of profit or loss and other comprehensive income (loss) ("OCI") for the period which
are calculated based on the ownership interests of the minority shareholders in the subsidiary. Changes in the Company's ownership
interest in subsidiaries that do not result in a loss of control are accounted for as equity transactions.
Joint
arrangements
A
joint arrangement is defined as one over which two or more parties have joint control. Joint control is the contractually agreed
sharing of control of an arrangement which exists only when the decisions about the relevant activities (being those that significantly
affect the returns of the arrangement) require the unanimous consent of the parties sharing control. The Company has interests
in joint arrangements classified as joint ventures, whereby the parties that have joint control of the arrangement have rights
to the net assets of the joint venture. Investments in joint ventures are accounted for using the equity method.
The
Company's equity method investments were acquired in connection with the acquisition of Alacer (notes 1(a) and 4(a)). On acquisition,
the investments were recognized at fair value. Subsequent to initial recognition, the carrying amount of the investments are adjusted
by the Company's share of: post-acquisition net income or loss and OCI; depreciation, amortization or impairment of the fair value
adjustments made at the date of acquisition; dividends received; and cash contributions. If the carrying amount of an equity method
investment is reduced to zero, additional losses are not provided for, and a liability is not recognized, unless the Company has
incurred legal or constructive obligations, or made payments on behalf of the equity method investment.
(d) Business
combinations
Transactions
whereby assets acquired and liabilities assumed constitute a business are business combinations. A business is defined as an integrated
set of activities and assets that is capable of being conducted and managed for the purpose of providing goods or services to customers,
generating investment income or generating other income from ordinary activities.
Business
combinations in which the Company is identified as the acquirer are accounted for using the acquisition method of accounting, whereby
identifiable assets acquired and liabilities assumed, including contingent liabilities, are recognized at their fair values at
the acquisition date. The acquisition date is the date at which the Company obtains control over the acquiree, which is generally
the date that consideration is transferred and the Company acquires the assets and assumes the liabilities of the acquiree.
| SSR Mining Inc. | Financial Statements Year-End 2020 | | 15 |
SSR Mining Inc. Notes to the Consolidated Financial Statements (tabular amounts expressed in thousands of United States dollars unless otherwise stated) |
| 2. | SUMMARY OF SIGNIFICANT ACCOUNTING POLICIES (continued) |
(d) Business
combinations (continued)
It
generally requires time to obtain the information necessary to identify and measure the assets acquired and liabilities assumed
as of the acquisition date. If the initial accounting for a business combination is incomplete by the end of the reporting period
in which the business combination occurs, the Company reports in its consolidated financial statements provisional amounts for
the items for which the fair value measurement is incomplete. During the period after the acquisition date and the time the Company
receives the relevant information it was seeking about facts and circumstances that existed as of the acquisition date or learns
that more information is not obtainable (the "measurement period"), the Company will retrospectively adjust the provisional
amounts recognized at the acquisition date to reflect new relevant information obtained about facts and circumstances that existed
as of the acquisition date and, if known, would have affected the measurement of the amounts recognized as of that date, including
recognizing additional assets or liabilities. The measurement period does not exceed one year from the acquisition date.
The
consideration transferred in a business combination is measured at fair value, which is calculated as the sum of the acquisition-date
fair values of the assets transferred by the Company, the liabilities, including contingent consideration, incurred and payable
by the Company to former owners of the acquiree and the equity interests issued by the Company. Acquisition-related costs, other
than costs to issue debt or equity securities of the Company, are expensed as incurred.
At
the acquisition date, non-controlling interests are recorded at their proportionate share of the fair value of identifiable net
assets acquired. When the cost of the acquisition exceeds the fair value of the identifiable net assets acquired, the difference
is recognized as goodwill.
The
results of businesses acquired during the period are included in the consolidated financial statements from the date of acquisition.
(e) Foreign
currency translation
The
functional and presentation currency of SSR Mining and each of its subsidiaries is the U.S. dollar. Accordingly, foreign currency
transactions and balances of the Company’s subsidiaries are translated as follows: (i) monetary assets and liabilities denominated
in currencies other than the U.S. dollar (“foreign currencies”) are translated into U.S. dollars at the exchange rates
prevailing at the balance sheet date; (ii) non-monetary assets denominated in foreign currencies and measured at other than fair
value are translated using the rates of exchange at the transaction dates; (iii) non-monetary assets denominated in foreign currencies
that are measured at fair value are translated using the rates of exchange at the dates those fair values are determined; and (iv)
income statement items denominated in foreign currencies are principally translated using daily exchange rates, except for depletion
and depreciation, which is translated at historical exchange rates. Foreign exchange gains and losses are recognized in net income
(loss) and presented in the consolidated statements of income (loss) in accordance with the nature of the transactions to which
the foreign currency gains and losses relate. Unrealized foreign exchange gains and losses on cash and cash equivalent balances
denominated in foreign currencies are disclosed separately in the consolidated statements of cash flows.
(f) Cash
and cash equivalents
Cash
and cash equivalents include cash on hand and held at banks and short-term investments with an original maturity of three months
or less, which are readily convertible into a known amount of cash. Restricted cash balances are excluded from cash and cash equivalents
and are classified as either current or non-current assets, based upon the expiration date of the restriction.
| SSR Mining Inc. | Financial Statements Year-End 2020 | | 16 |
SSR Mining Inc. Notes to the Consolidated Financial Statements (tabular amounts expressed in thousands of United States dollars unless otherwise stated) |
| 2. | SUMMARY OF SIGNIFICANT ACCOUNTING POLICIES (continued) |
(g) Inventories
Stockpiled
ore, work-in-process inventory, leach pad inventory and finished goods are valued at the lower of average cost and estimated net
realizable value (“NRV”). Cost includes all direct costs incurred in production, including direct labour and materials,
freight, depletion and depreciation, and directly attributable overhead costs. NRV is calculated using the estimated price at the
time of sale based on prevailing and forecast metal prices less estimated future production costs to convert the inventory into
saleable form and all associated selling costs, discounted where applicable. Any write-downs of inventory to NRV are recognized
within cost of sales in the consolidated statements of income (loss). If there is a subsequent increase in the value of inventory,
the previous write-downs to NRV are reversed to the extent that the related inventory has not been sold so that the new carrying
amount is the lower of cost and the revised NRV.
Stockpiled
ore inventory represents ore that has been extracted from the mine and is available for further processing. The cost of stockpiled
ore inventory is derived from the current mining costs incurred up to the point of stockpiling the ore and is removed at the weighted
average cost as ore is processed. Quantities of stockpiled ore are verified by periodic surveys. Stockpiled ore that is not expected
to be processed within the next twelve months is classified as non-current.
Work-in-process
inventory represents the weighted average mining costs of ore being processed, other than by heap leaching, and the costs incurred
in the process of converting ores into partially refined precious metals, or doré.
At
Çöpler and Marigold, the recovery of gold and by-products from oxide ore is achieved through a heap leaching process,
although at Çöpler, the oxide ore can also be processed through the sulfide plant. In the heap leaching process, ore
is stacked on leach pads and treated with a chemical solution that dissolves the gold contained within the ore. The resulting pregnant
solution is further processed in a plant where the gold is recovered. The cost of leach pad inventory is derived from current mining
and leaching costs and is removed as ounces of gold are recovered at the weighted average cost per recoverable ounce of gold on
the leach pads. Estimates of recoverable gold in the leach pads are calculated based on the quantities of ore placed on the leach
pads (measured tonnes added to the leach pads), the grade of ore placed on the leach pads (based on assay data), and an estimated
recovery percentage (based on estimated recovery assumptions from the block model). The nature of the leaching process inherently
limits the ability to precisely monitor inventory levels. As a result, estimates are refined based on actual results and engineering
studies over time. The final recovery of gold from leach pads will not be known until the leaching process is concluded at the
end of the mine life.
Finished
goods inventory includes metal concentrates at site and in transit, doré at a site or refinery, or gold bullion. Doré
represents a bar containing predominantly gold by value, which is refined off-site to produce gold bullion. Costs are transferred
from finished goods inventory and recorded as cost of sales in the consolidated statements of income (loss) upon sale.
Materials
and supplies inventories are measured at the lower of average cost and NRV. Costs include acquisition, freight and other directly
attributable costs. A regular review is undertaken to determine the extent of any provision for obsolescence. Inventory that is
not planned to be processed or used within one year is classified as non-current.
(h) Mineral
properties, plant and equipment
Mineral
properties contain mineral reserves or mineral resources and exploration potential. The value associated with mineral resources
and exploration potential is the value beyond proven and probable mineral reserves.
| SSR Mining Inc. | Financial Statements Year-End 2020 | | 17 |
SSR Mining Inc. Notes to the Consolidated Financial Statements (tabular amounts expressed in thousands of United States dollars unless otherwise stated) |
| 2. | SUMMARY OF SIGNIFICANT ACCOUNTING POLICIES (continued) |
(h) Mineral
properties, plant and equipment (continued)
| (i) | Mineral properties (continued) |
Mineral
reserves represent the estimate of ore that can be economically and legally extracted from the Company's mining properties ("Mineral
Reserves"). Mineral resources represent property interests that contain potentially economic mineralized material such as:
inferred mineral resources within pits; measured, indicated and inferred mineral resources with insufficient drill spacing to qualify
as proven and probable Mineral Reserves; and inferred mineral resources in close proximity to proven and probable Mineral Reserves
("Mineral Resources"). Exploration potential represents the estimated potential mineralized material contained within:
| (i) | areas adjacent to existing Mineral Reserves and mineralization
located within the immediate mine area; |
| (ii) | areas outside of immediate mine areas that are not part of
measured, indicated, or inferred Mineral Resources; and |
| (iii) | greenfield exploration potential that is not associated with
any other production, development, or exploration stage property ("Exploration Potential"). |
Capitalized
costs of mineral properties include the following:
| (i) | Costs of acquiring exploration and development stage properties
in asset acquisitions, or the value attributed to properties acquired in a business combination; |
| (ii) | Economically recoverable exploration and evaluation expenses; |
| (iii) | Expenditures incurred to develop mining properties, net of
proceeds from pre-production sales, prior to reaching operating levels intended by management; |
| (iv) | Certain costs incurred during production; |
| (v) | Estimates of reclamation and closure costs; and |
| (vi) | Borrowing costs incurred that are attributable to qualifying
mineral properties. |
Acquisition
of mineral properties
The
costs of acquiring exploration and development stage properties, including transaction costs, in an asset acquisition are capitalized
as an exploration and evaluation asset or a mineral property at cost. The value attributed to acquiring mineral properties at an
operating mine in a business combination is recognized as a mineral property. The value attributed to Exploration Potential acquired
in a business combination is recognized as an exploration and evaluation asset.
Exploration
and evaluation expenditures
Exploration
expenditures are the costs incurred in the initial search for mineral deposits with economic potential or in the process of obtaining
more information about existing mineral deposits. Exploration expenditures typically include costs associated with acquiring the
rights to explore, prospecting, sampling, mapping, diamond drilling and other work involved in searching for Mineral Resources,
as defined by National Instrument 43-101 - Standards of Disclosure for Mineral Projects ("NI 43-101").
Evaluation
expenditures are costs incurred to establish the technical and commercial viability of developing mineral deposits identified through
exploration activities or by acquisition. Evaluation expenditures include the cost of:
| (i) | further defining the volume and grade of deposits through
drilling of core samples, trenching and sampling activities in an ore body; |
| (ii) | determining the optimal methods of extraction and metallurgical
and treatment processes; |
| (iii) | studies related to surveying, transportation and infrastructure
requirements; |
| (iv) | permitting activities; and |
| SSR Mining Inc. | Financial Statements Year-End 2020 | | 18 |
SSR Mining Inc. Notes to the Consolidated Financial Statements (tabular amounts expressed in thousands of United States dollars unless otherwise stated) |
| 2. | SUMMARY OF SIGNIFICANT ACCOUNTING POLICIES (continued) |
(h) Mineral
properties, plant and equipment (continued)
| (i) | Mineral properties (continued) |
Exploration
and evaluation expenditures (continued)
| (v) | economic evaluations to determine whether development of
mineralized material is commercially justified, including preliminary economic assessments, pre-feasibility and final feasibility
studies. |
Exploration
and evaluation expenditures are expensed until it has been determined that a property is technically feasible and commercially
viable, in which case subsequent evaluation costs incurred to develop a mineral property are capitalized.
Development
expenditures
When
the criteria for capitalization of exploration and evaluation expenditures has been met, the carrying value of the exploration
and evaluation asset is reclassified as a mineral property. All costs, including pre-operating costs are capitalized until the
point that the mineral property is capable of operating as intended by management. This is determined by:
| (i) | completion of operational commissioning of major mine and
plant components; |
| (ii) | operating results being achieved consistently for a period
of time; |
| (iii) | indicators that these operating results will be continued;
and |
| (iv) | other factors being present, including one or more of the
following: a significant portion of the plant/mill capacity being achieved; a significant portion of available funding being directed
towards operating activities; a predetermined, reasonable period of time being passed; or significant milestones for the development
of the mineral property being achieved. |
In
open pit mining operations, it is necessary to incur costs to remove waste material in order to access the ore body, which is known
as stripping, with the stripping ratio being the ratio of waste material to ore. Stripping costs incurred prior to the production
stage of a mineral property (pre-stripping costs) are capitalized as part of the carrying amount of the related mineral property.
Once
the mineral property is capable of operating as intended, further operating costs, including depletion and depreciation, are included
within inventories as incurred.
Costs
incurred during production
During
the production phase of an open pit mine, stripping costs incurred that provide improved access to ore that will be produced in
future periods and that would not have otherwise been accessible are capitalized ("deferred stripping asset"). The costs
qualifying for capitalization are those costs directly incurred to perform the stripping activity that improves access to the identified
component of ore, plus an allocation of directly attributable overhead costs, which are determined using a strip ratio methodology.
The strip ratio represents the ratio of the estimated total volume of waste material to the estimated total quantity of economically
recoverable ore of the Mineral Reserves for which access has been improved. The deferred stripping asset is included as part of
the carrying amount of the mineral property. Capitalized stripping costs are amortized based on the estimated recoverable ounces
contained in Mineral Reserves that directly benefit from the stripping activities. Costs
for waste removal that do not give rise to future economic benefits are included in production costs in the period in which they
are incurred.
During
the production phase of an underground mine, mine development costs incurred to maintain current production are included in mine
operating costs. These costs include the development and access (tunneling) costs of production drifts to develop the ore body
in the current production cycle. Development costs incurred to build new shafts, declines and ramps that enable permanent access
to ore underground are capitalized as incurred. Capitalized underground development costs are depleted using the units-of-production
method.
| SSR Mining Inc. | Financial Statements Year-End 2020 | | 19 |
SSR Mining Inc. Notes to the Consolidated Financial Statements (tabular amounts expressed in thousands of United States dollars unless otherwise stated) |
| 2. | SUMMARY OF SIGNIFICANT ACCOUNTING POLICIES (continued) |
(h) Mineral
properties, plant and equipment (continued)
| (i) | Mineral properties (continued) |
Measurement
Mineral
properties are recorded at cost less accumulated depletion and impairment losses.
Depletion
of mineral properties
The
Company's mineral properties are classified as either those subject to depletion or not yet subject to depletion. On acquisition
of a mineral property, the Company prepares an estimate of the fair value attributable to Mineral Reserves, Mineral Resources and
Exploration Potential attributable to the property. The fair value attributable to Mineral Resources is classified as mineral properties
not yet subject to depletion. As Mineral Resources are converted into Mineral Reserves at operating properties, a portion of the
asset balance is reclassified as subject to depletion using an average cost per ounce.
Mineral
properties subject to depletion are depleted using the units-of-production method. In applying the units-of-production method over
the recoverable ounces to which the asset specifically relates, depletion is calculated using the recoverable ounces extracted
from the mine in the period as a percentage of the total recoverable ounces expected to be extracted in current and future
periods based on the Mineral Reserves.
The
Company reviews the estimated total recoverable ounces contained in depletable Mineral Reserves annually and when events and circumstances
indicate that such a review should be made. Changes to estimated total recoverable ounces contained in depletable Mineral Reserves
are accounted for prospectively. No amortization is charged during the evaluation and development phases as the asset is not available
for use.
| (ii) | Plant and equipment and construction in process |
Plant
and equipment is stated at cost less accumulated depreciation and accumulated impairment losses.
The
cost of an item of plant and equipment includes the purchase price or construction cost, any costs directly attributable to bringing
the asset to the location and condition necessary for its intended use, an initial estimate of the costs of dismantling and removing
the item and restoring the site on which it is located, and, for qualifying assets, the associated borrowing costs.
Where
an item of plant and equipment is comprised of major components with different useful lives, the components are accounted for as
separate items of plant and equipment.
Costs
incurred for major overhaul of existing equipment and sustaining capital are capitalized as plant and equipment and are subject
to depreciation once they are available for use. Major overhauls include improvement programs that increase the productivity or
extend the useful life of an asset beyond that initially envisaged. The costs of routine maintenance and repairs that do not constitute
improvement programs are accounted for as a cost of inventory.
| SSR Mining Inc. | Financial Statements Year-End 2020 | | 20 |
SSR Mining Inc. Notes to the Consolidated Financial Statements (tabular amounts expressed in thousands of United States dollars unless otherwise stated) |
| 2. | SUMMARY OF SIGNIFICANT ACCOUNTING POLICIES (continued) |
(h) Mineral
properties, plant and equipment (continued)
| (ii) | Plant and equipment and Construction in Process (continued) |
Depreciation
of plant and equipment
The
carrying amounts of plant and equipment are depreciated to their estimated residual value over the estimated useful lives of the
specific assets, or the estimated life-of-mine ("LOM"), if shorter. Depreciation starts on the date when the asset is
available for its intended use. The major categories of plant and equipment are depreciated on a straight-line basis using the
estimated lives indicated below:
| Vehicles |
5 - 7 years |
| Mining equipment |
3 years - LOM |
| Mobile equipment components |
2 - 7 years |
| Buildings |
LOM |
| Mine plant equipment |
LOM |
| Underground infrastructure |
LOM |
| Right-of-use assets - plant and equipment |
10 years - LOM |
For
right-of-use assets, the depreciation period indicated above represents the period from lease commencement date to the earlier
of the end of the useful life of the underlying asset or the end of the lease term.
Construction
in process assets are not depreciated until available for their intended use.
The
Company conducts a review of residual values, useful lives and depreciation methods employed for plant and equipment annually,
and when events and circumstances indicate that such a review should be made. Any changes in estimates that arise from this review
are accounted for prospectively.
At
the end of each reporting period, the Company reviews its mineral properties, plant and equipment to determine whether there is
any indication that these assets are impaired. If any such indication exists, an estimate of the recoverable amount is undertaken.
If the asset’s carrying amount exceeds its recoverable amount, then an impairment loss is recognized in the consolidated
statements of income (loss).
Impairment
is normally assessed at the cash-generating unit ("CGU") level, which is the smallest identifiable group of assets that
generates cash inflows that are largely independent of the cash inflows from other assets. Each individual mining interest that
is an operating mine is typically a CGU.
The
recoverable amount of a mine site is the greater of an asset’s fair value less costs to dispose (“FVLCTD”) and
value in use (“VIU”). FVLCTD is defined as the amount that would be obtained from the sale of the asset in an orderly
transaction between market participants at the measurement date. VIU is determined as the present value of the estimated future
cash flows expected to arise from the continued use of the asset in its present form and from its ultimate disposal. The fair value
of mine sites is generally determined as the present value of the estimated future cash flows expected to arise from the continued
use of the asset, including any expansion prospects.
Mineral
properties, plant and equipment that have been impaired are tested for possible reversal of the impairment whenever events or changes
in circumstances indicate that the impairment may have reversed. When an impairment loss reverses in a subsequent period, the revised
carrying amount shall not exceed the carrying amount that would have been determined had no impairment loss been recognized for
the asset previously, less subsequent depletion and depreciation. Reversals of impairment losses are recognized in the consolidated
statements of income (loss) in the period in which the reversals occur.
| SSR Mining Inc. | Financial Statements Year-End 2020 | | 21 |
SSR Mining Inc. Notes to the Consolidated Financial Statements (tabular amounts expressed in thousands of United States dollars unless otherwise stated) |
| 2. | SUMMARY OF SIGNIFICANT ACCOUNTING POLICIES (continued) |
(i) Goodwill
Under
the acquisition method of accounting for business combinations, the identifiable assets acquired and liabilities assumed are recognized
at their estimated fair value as of the date of acquisition. The excess of the fair value of consideration paid over the fair value
of the identifiable net assets acquired is recognized as goodwill and allocated to CGUs.
Goodwill
arises principally because of the: (i) ability to capture buyer-specific synergies arising upon a transaction; (ii) ability to
increase Mineral Reserves and Mineral Resources through exploration activities; and (iii) requirement to record a deferred tax
liability for the difference between the assigned values and the tax bases of the identifiable assets acquired and liabilities
assumed.
Goodwill
is not amortized. The Company performs an annual impairment test for goodwill and when events or changes in circumstances indicate
that the related carrying amount may not be recoverable. If the carrying amount of a CGU to which goodwill has been allocated exceeds
the recoverable amount, an impairment loss is recognized for the amount in excess. The impairment loss is allocated first to reduce
the carrying amount of goodwill allocated to the CGU to nil and then to the other assets of the CGU based on the relative carrying
amounts of those assets. Impairment losses recognized for goodwill are not reversed in subsequent periods should the value of goodwill
recover.
(j) Share-based
payments
The
fair value of the estimated number of stock options and other equity-settled share-based payments that are expected to vest, determined
at the date of grant, is recognized as a share-based compensation expense in the consolidated statements of income (loss) over
the vesting period, with a corresponding increase to equity. The Company estimates the fair value of stock options granted using
the Black-Scholes option pricing model and estimates the expected forfeiture rate at the date of grant. The Company estimates the
fair value of equity-settled PSUs using a Monte Carlo valuation model at the date of grant.
For cash-settled share-based
payment arrangements, the fair values of the payments are recognized as share-based compensation
expense in the consolidated statements of income (loss) over the vesting period, with a corresponding increase to accrued liabilities.
The liabilities for cash-settled share-based payments are remeasured at the end of each reporting period and at the date of settlement,
with any changes in fair value recognized in profit or loss for the period. When share-based payment transactions provide the Company
with the choice of settling in cash or by issuing equity instruments, the share-based payments are accounted for as cash-settled
when the Company determines that it has a present obligation to settle in cash. The Company has a present obligation to settle
in cash when it has a past practice or stated policy of settling in cash.
The Company's cash-settled
share-based payments consist of deferred share units ("DSUs") issued and issuable under the Company's Non-Employee Directors'
Deferred Share Unit Plan, RSUs and PSUs issued and issuable under the Company's 2017 and 2020 Share Compensation Plans and the
previously replaced plans, and the DSU Replacement Units, RSU Replacement Units and PSU Replacement Units issued in connection
with the Alacer acquisition (notes 1(a) and 4(a)). Certain of the Company's PSUs and RSU Replacement Units were reclassified from
equity-settled to cash-settled during the year (note 17). The fair values of the DSUs, DSU
Replacement Units, RSUs, RSU Replacement Units, PSUs and PSU Replacement Units that are cash-settled are estimated based on the
quoted market price of the Company's common shares, and for the PSUs and PSU Replacement Units, are also based on projected performance,
The fair values are remeasured at the end of each reporting period.
When
awards are forfeited because non-market based vesting conditions are not satisfied, the expense previously recognized is proportionately
reversed.
| SSR Mining Inc. | Financial Statements Year-End 2020 | | 22 |
SSR Mining Inc. Notes to the Consolidated Financial Statements (tabular amounts expressed in thousands of United States dollars unless otherwise stated) |
| 2. | SUMMARY OF SIGNIFICANT ACCOUNTING POLICIES (continued) |
(k) Taxation
The
income tax expense for the period is comprised of current and deferred tax, and is recognized in the consolidated statements of
income (loss) except to the extent that it relates to items recognized in OCI or directly in equity, in which case the tax is recognized
in OCI or directly in equity.
Current
income tax
Current
tax for each of the Company's taxable entities is based on the local taxable profit for the period at the local statutory tax rates
enacted or substantively enacted at the date of the consolidated statements of financial position as well as the available double
tax treaty rates as ratified. Management periodically evaluates positions taken in tax returns in situations in which applicable
tax regulation is subject to interpretation. The Company establishes provisions where appropriate on the basis of amounts expected
to be paid to tax authorities.
Deferred
tax
Deferred
income tax assets and liabilities are recognized, using the liability method, for the future tax consequences attributable to differences
between the financial statement carrying amounts of existing assets and liabilities and their respective tax bases, unused tax
losses and other income tax deductions. Deferred income tax assets are recognized for all deductible temporary differences to the
extent that it is probable that taxable profits will be available to be utilized against those deductible temporary differences.
The extent to which deductible temporary differences, unused tax losses and other income tax deductions are expected to be realized
are reassessed at the end of each reporting period. Deferred tax assets are recognized for investment incentive tax credits in
Turkey in the period earned as expenditures that are probable to be accepted as eligible spend occur and it is probable that taxable
profits will be available to be utilized against those credits, which can be applied to current and future year income tax payments.
Deferred
income tax assets and liabilities are measured using enacted or substantively enacted tax rates expected to apply when the related
deferred income tax assets are realized or the deferred income tax liabilities are settled. The measurement of deferred income
tax assets and liabilities reflects the tax consequences that would follow from the manner in which the Company expects, at the
reporting date, to recover and settle the carrying amounts of its assets and liabilities, respectively. The effect on deferred
income tax assets and liabilities of a change in tax rates is recognized in the period in which the change is substantively enacted.
Deferred
income tax assets and liabilities are not recognized if the temporary difference arises on the initial recognition of assets and
liabilities in a transaction other than a business combination, that at the time of the transaction, affects neither the taxable
nor the accounting profit or loss.
Deferred
income tax assets and liabilities are recognized for future withholding taxes payable where it has been determined that the amount
would reasonably be payable in the foreseeable future.
Deferred
income tax liabilities are recognized for taxable temporary differences associated with investments in subsidiaries and associates,
and interests in joint ventures, except where the timing of the reversal of the temporary difference is controlled by the Company
and it is probable that the temporary difference will not reverse in the foreseeable future.
The
Company recognizes deferred income taxes relating to the impact of changes in foreign exchange rates on the tax bases of non-monetary
assets and liabilities which are denominated in foreign currencies. The resultant changes in deferred taxes are recognized in deferred
income tax expense/recovery in the consolidated statements of income (loss). The Company recognizes foreign exchange gains and
losses on current income tax receivable and payable balances denominated in foreign currencies in the consolidated statements of
income (loss).
| SSR Mining Inc. | Financial Statements Year-End 2020 | | 23 |
SSR Mining Inc. Notes to the Consolidated Financial Statements (tabular amounts expressed in thousands of United States dollars unless otherwise stated) |
| 2. | SUMMARY OF SIGNIFICANT ACCOUNTING POLICIES (continued) |
(k) Taxation
(continued)
Deferred
tax (continued)
Deferred
tax assets and liabilities are offset when there is a legally enforceable right to offset the current tax assets against the current
tax liabilities, when they relate to income taxes levied by the same taxation authority, and the Company intends to settle its
current tax assets and liabilities on a net basis.
Royalties
and other tax arrangements
Royalties
and other arrangements are treated as taxation arrangements when they have the characteristics of income tax. This is the case
when they are imposed under government authority and the amount payable is calculated by reference to an income measure. Obligations
arising from royalty arrangements that do not satisfy these criteria are recognized as current liabilities and included within
production costs.
(l) Financial
instruments
Measurement
- initial recognition
Financial
assets and financial liabilities are recognized in the consolidated statements of financial position when the Company becomes a
party to the contractual provisions of the instrument. On initial recognition, all financial assets and financial liabilities are
recorded at fair value, net of attributable transaction costs, except for financial assets and liabilities classified as at fair
value through profit or loss (“FVTPL”). The directly attributable transaction costs of financial assets and liabilities
classified as at FVTPL are expensed in the period in which they are incurred.
Subsequent
measurement of financial assets and liabilities depends on the classifications of such assets and liabilities.
Classification
and subsequent measurement of financial assets
Amortized
cost:
Financial
assets that meet the following conditions are measured subsequently at amortized cost:
| (i) | The financial asset is held within a business model whose
objective is to hold financial assets in order to collect contractual cash flows; and |
| (ii) | The contractual terms of the financial asset give rise on
specified dates to cash flows that are solely payments of principal and interest on the principal amount outstanding. |
The
amortized cost of a financial asset is the amount at which the financial asset is measured at initial recognition minus the principal
repayments, plus the cumulative amortization using effective interest method of any difference between that initial amount and
the maturity amount, adjusted for any loss allowance. Interest income is recognized using the effective interest method.
Fair
value through OCI ("FVTOCI"):
Financial
assets that meet the following conditions are measured at FVTOCI:
| (i) | The financial asset is held within a business model whose
objective is achieved by both collecting contractual cash flows and selling financial assets; and |
| (ii) | The contractual terms of the financial asset give rise on
specified dates to cash flows that are solely payments of principal and interest on the principal amount outstanding. |
| SSR Mining Inc. | Financial Statements Year-End 2020 | | 24 |
SSR Mining Inc. Notes to the Consolidated Financial Statements (tabular amounts expressed in thousands of United States dollars unless otherwise stated) |
| 2. | SUMMARY OF SIGNIFICANT ACCOUNTING POLICIES (continued) |
(l) Financial
instruments (continued)
Classification
and subsequent measurement of financial assets (continued)
Equity
instruments designated as FVTOCI:
On
initial recognition, the Company may make an irrevocable election (on an instrument-by-instrument basis) to designate investments
in equity instruments that would otherwise be measured at FVTPL to present subsequent changes in fair value in OCI. Designation
at FVTOCI is not permitted if the equity investment is held for trading or if it is contingent consideration recognized by the
Company as the acquirer in a business combination. Investments in equity instruments at FVTOCI are initially measured at fair value
plus transaction costs. Subsequently, they are measured at fair value with gains and losses arising from changes in fair value
recognized in OCI. The cumulative gain or loss is not reclassified to profit or loss on disposal of the equity instrument. The
Company has designated all investments in equity instruments that are not held for trading as FVTOCI.
Financial
assets measured subsequently at FVTPL:
By
default, all other financial assets are measured subsequently at FVTPL.
The
Company, at initial recognition, may also irrevocably designate a financial asset as measured at FVTPL if doing so eliminates or
significantly reduces a measurement or recognition inconsistency that would otherwise arise from measuring assets or liabilities
or recognizing the gains and losses on them on different bases.
Financial
assets measured at FVTPL are measured at fair value at the end of each reporting period, with any fair value gains or losses recognized
in profit or loss to the extent they are not part of a designated hedging relationship. Fair value is determined in the manner
described in note 26(b).
Classification
and subsequent measurement of financial liabilities and equity
Debt
and equity instruments are classified as either financial liabilities or as equity instruments in accordance with the substance
of the contractual arrangements and the definitions of a financial liability and an equity instrument.
An
equity instrument is any contract that evidences a residual interest in the assets of SSR Mining after deducting all its liabilities.
Equity
instruments issued by the Company are recognized at the proceeds received, net of direct issue costs. Repurchase of the Company's
own equity instruments is recognized and deducted directly in equity. No gain or loss is recognized in profit or loss on the issuance,
purchase, sale, or cancellation of the Company's own equity instruments.
Financial
liabilities
Financial
liabilities that are not contingent consideration in a business combination, held for trading or designated as at FVTPL, are measured
at amortized cost using the effective interest method.
Non-hedge
derivatives
Derivative
instruments that are not designated as hedging instruments or do not qualify as cash flow hedges are recorded at fair value with
changes in fair value recognized in the consolidated statements of income (loss).
| SSR Mining Inc. | Financial Statements Year-End 2020 | | 25 |
SSR Mining Inc. Notes to the Consolidated Financial Statements (tabular amounts expressed in thousands of United States dollars unless otherwise stated) |
| 2. | SUMMARY OF SIGNIFICANT ACCOUNTING POLICIES (continued) |
(l) Financial
instruments (continued)
Derivative
instruments designated as cash flow hedges
The
Company designates certain derivatives as hedging instruments in cash flow hedges in respect of foreign currency risk and commodity
price risk. On initial designation of the derivative as a cash flow hedge, the Company documents the relationship between the hedging
instrument and hedged item, along with its risk management objectives and strategy for undertaking various hedge transactions.
Furthermore, at the inception of the hedge and on an ongoing basis, the Company documents whether the hedging instrument is effective
in offsetting changes in cash flows of the hedged item attributable to the hedged risk
The
changes in the fair value of derivatives that are designated as hedging instruments and determined to be effective in offsetting
forecasted cash flows of hedged items is recognized in OCI. The gain or loss relating to the ineffective portion is recognized
immediately as gain (loss) on derivatives in other (expense) income, net, in the consolidated statements of income (loss). When
the forecasted transaction impacts profit or loss, the cumulative gains or losses that were recorded in accumulated OCI ("AOCI")
are reclassified to profit or loss in the same line item as the recognized hedged item. When the forecasted transaction that is
hedged results in the recognition of a non-financial asset, the cumulative gains or losses that were recorded in AOCI are removed
from equity and included in the carrying amount of the asset. This transfer does not affect OCI.
The
Company discontinues hedge accounting only when the hedging relationship (or part thereof) ceases to meet the qualifying criteria.
This includes instances when the hedging instrument expires or is sold, terminated or exercised. The discontinuation is accounted
for prospectively. When a derivative designated as a hedging instrument in a cash flow hedge expires or is sold and the forecasted
transaction is still expected to occur, any cumulative gain or loss relating to the derivative that is recorded in AOCI at that
time remains in AOCI and is reclassified to profit or loss when the forecasted transaction occurs, in the same line item as the
recognized hedged item. When a forecast transaction is no longer expected to occur, the gain or loss is reclassified immediately
to the consolidated statements of income (loss).
Impairment
The
Company recognizes a loss allowance for expected credit losses on its financial assets. At each reporting date, the Company measures
the loss allowance for the financial asset at an amount equal to the lifetime expected credit losses if the credit risk on the
financial asset has increased significantly since initial recognition. If, at the reporting date, the credit risk on the financial
asset has not increased significantly since initial recognition, the Company measures the loss allowance for the financial asset
at an amount equal to twelve month expected credit losses.
(m) Provisions
Provisions
are liabilities that are uncertain in timing or amount. The Company records a provision when and only when:
| (i) | The Company has a present obligation (legal or constructive)
as a result of a past event; |
| (ii) | It is probable that an outflow of resources embodying economic
benefits will be required to settle the obligation; and |
| (iii) | A reliable estimate can be made of the amount of the obligation.
|
Constructive
obligations are obligations that derive from the Company's actions where:
| (i) | By an established pattern of past practice, published policies
or a sufficiently specific current statement, the Company has indicated to other parties that it will accept certain responsibilities;
and |
| (ii) | As a result, the Company has created a valid expectation
on the part of those other parties that it will discharge those responsibilities. |
| SSR Mining Inc. | Financial Statements Year-End 2020 | | 26 |
SSR Mining Inc. Notes to the Consolidated Financial Statements (tabular amounts expressed in thousands of United States dollars unless otherwise stated) |
| 2. | SUMMARY OF SIGNIFICANT ACCOUNTING POLICIES (continued) |
(m) Provisions
(continued)
Provisions
are reviewed at the end of each reporting period and adjusted or reversed to reflect management’s current best estimate of
the expenditure required to settle the present obligation at the end of the reporting period. If it is no longer probable that
an outflow of resources embodying economic benefits will be required to settle the obligation, the provision is reversed. Provisions
are reduced by actual expenditures for which the provision was originally recognized. Where discounting has been used, the carrying
amount of a provision is accreted during the period to reflect the passage of time. This accretion expense is included in finance
costs in the consolidated statements of income (loss).
Reclamation
and closure cost provision
The
Company records a provision for the estimated future costs of reclamation and closure of operating, closed and inactive mines and
development projects when environmental disturbance occurs or a constructive obligation arises. The provision for reclamation and
closure costs is accreted over time to reflect the unwinding of the discount with the accretion expense included in finance costs
in the consolidated statements of income (loss). The provision for reclamation and closure costs is remeasured at the end of each
reporting period for changes in estimates or circumstances. Changes in estimates or circumstances include changes in legal or regulatory
requirements, increased obligations arising from additional mining and exploration activities, changes to cost estimates and changes
to risk-free interest rates.
Reclamation
and closure cost obligations relating to operating mines and development projects are initially recorded with a corresponding increase
to the carrying amounts of related mining properties. Changes to the obligations which may arise as a result of changes in estimates
and assumptions are also accounted for as changes in the carrying amounts of related mining properties, except where a reduction
in the obligation is greater than the capitalized reclamation and closure costs, in which case, the capitalized reclamation and
closure costs are reduced to nil and the remaining adjustment is included in production costs in the consolidated statements of
income (loss). The provisions for reclamation and closure costs related to inactive and closed mines are included in exploration,
evaluation and reclamation costs in the consolidated statements of income (loss) on initial recognition and subsequently when remeasured.
(n) Leases
The
Company has entered into lease contracts under which the Company is the lessee.
At
inception of a contract, the Company assesses whether a contract is, or contains, a lease. A contract is, or contains, a lease
if the contract conveys the right to control the use of an identified asset over a period of time in exchange for consideration.
At
the lease commencement date, a lease liability is initially measured at the present value of the lease payments during the lease
term that are not paid at the commencement date, discounted by the interest rate implicit in the lease or, if that rate cannot
be readily determined, the Company's incremental borrowing rate. The Company's incremental borrowing rate is the rate that the
Company would have to pay to borrow the funds necessary to obtain an asset of similar value in a similar economic environment with
similar terms and conditions. The lease term includes the non-cancellable period for which the Company has the right to use the
underlying asset, periods covered extension options that the Company is reasonably certain to exercise and periods covered by termination
options that the Company is reasonably certain not to exercise. The lease liability is subsequently measured at amortized cost
using the effective interest method.
| SSR Mining Inc. | Financial Statements Year-End 2020 | | 27 |
SSR Mining Inc. Notes to the Consolidated Financial Statements (tabular amounts expressed in thousands of United States dollars unless otherwise stated) |
| 2. | SUMMARY OF SIGNIFICANT ACCOUNTING POLICIES (continued) |
(n) Leases
(continued)
Lease
payments during the lease term included in the measurement of the lease liability comprise the following:
| • | fixed payments
(including in-substance fixed payments), less any lease incentives receivable; |
| • | variable lease
payments that depend on an index or a rate; |
| • | amounts expected
to be payable under any residual value guarantee; |
| • | the exercise price
under purchase options that the Company is reasonably certain to exercise; and |
| • | penalties under
termination options, unless the Company is reasonably certain the options will not be exercised. |
The
Company recognizes a right-of-use asset, which is included in mineral properties, plant and equipment, at cost, which is comprised
of the initial amount of the lease liability adjusted for any lease payments made at or before the commencement date, plus any
initial direct costs and decommissioning and restoration costs, less any lease incentives received.
Payments
associated with short-term leases that have a lease term of twelve months or less and leases of low-value assets are recognized
on a straight-line basis as an expense in the consolidated statements of income (loss).
The
finance cost associated with the lease liability is recognized as an expense over the lease period so as to produce a constant
periodic rate of interest on the remaining balance of the liability for each period. Right-of-use assets are generally depreciated
over the shorter of the asset's useful life and the lease term on a straight-line basis. If the Company is reasonably certain to
exercise a purchase option, the right-of-use asset is depreciated over the underlying asset's useful life.
(o) Revenue
recognition
The
Company's primary source of revenue is the sale of gold bullion or doré and metal-bearing concentrate.
Revenue
relating to the sale of metals is recognized when control of the metal or related services are transferred to the customer in an
amount that reflects the consideration the Company expects to receive in exchange for those products or services. In determining
whether the Company has satisfied a performance obligation, it considers the indicators of the transfer of control, which include,
but are not limited to, whether: it has a present right to payment; it has transferred physical possession of the asset to the
customer; the customer has the significant risks and rewards of ownership of the asset; and the customer has legal title to the
asset.
Gold
bullion and doré sales
Gold
bullion and doré produced at Marigold and Seabee is sold primarily to bullion banks in the London spot market. Gold bullion
produced at Çöpler is sold primarily on the Istanbul Gold Exchange. Under legislation commenced in Turkey in 2018,
the Central Bank of the Republic of Turkey has the first right of refusal for all gold produced by mining operations in Turkey.
The sales price is fixed
on the date of sale based on the London Bullion Market Association's gold fix price or spot price. The
Company records revenue from sales of gold at the time of physical delivery, which is also the date that title to the gold passes.
Concentrate
sales
Metals
produced at Puna are sold in concentrate form to smelters and traders. The initial sales price of concentrate metal sales is determined
on a provisional basis at the date of sale as the final selling price is subject to movements in the monthly average London Metal
Exchange or London Bullion Market Association prices up to the date of final pricing. The period between provisional invoicing
and final pricing, or settlement period, is typically between 30 and 120 days.
| SSR Mining Inc. | Financial Statements Year-End 2020 | | 28 |
SSR Mining Inc. Notes to the Consolidated Financial Statements (tabular amounts expressed in thousands of United States dollars unless otherwise stated) |
| 2. | SUMMARY OF SIGNIFICANT ACCOUNTING POLICIES (continued) |
(o) Revenue
recognition (continued)
Concentrate
sales (continued)
The
Company recognizes revenues under these contracts at the point that control passes to the customer, which is when the risk and
rewards of ownership passes to the customer, typically at port of loading or unloading. Upon transfer of control of the concentrate,
the Company recognizes revenue based on the estimated prices for the estimated month of settlement and initial assay results. The
associated receivable is subsequently remeasured to fair value by reference to forward market prices at each period end until final
settlement, with the impact of changes in the forward market prices recognized in other revenue in the consolidated statements
of income (loss) as they occur. Refining and treatment charges are netted against revenues from metal concentrate sales.
Basic
income per share is calculated by dividing the net income or loss attributable to common shareholders of the Company by the weighted
average number of common shares outstanding during the period. Diluted income per share is determined by adjusting the net income
or loss attributable to common shareholders, and the weighted average number of common shares outstanding, for the effects of all
potentially dilutive share equivalents, such as stock options, PSUs, RSUs and convertible notes, whereby proceeds from the potential
exercise of dilutive stock options with exercise prices that are below the average market price of the underlying shares are assumed
to be used in purchasing the Company's common shares at their average market price for the period.
(q) New
and revised accounting standards not yet effective
The
following standards and amendments to existing standards have been issued but not yet adopted by the Company:
Property,
plant and equipment - proceeds before intended use
On
May 14, 2020, the IASB issued a narrow scope amendment to IAS 16, Property, Plant and Equipment: Proceeds before Intended Use.
The amendment prohibits deducting from the cost of property, plant and equipment amounts received from selling items produced while
preparing the asset for its intended use. Instead, amounts received will be recognized as sales proceeds and the related cost in
profit or loss. The effective date of the amendment is for annual periods beginning on or after January 1, 2022. The amendment
must be applied retrospectively, but only to items of property, plant and equipment that are brought to the location and condition
necessary for them to be capable of operating in the manner intended by management on or after the beginning of the earliest period
presented in the consolidated financial statements in which the amendment is first applied. The Company will adopt this narrow
scope amendment on the date it becomes effective. The amendment is not currently applicable to the Company; however, it may be
applicable in the future should the Company receive proceeds from selling items produced prior to an asset being ready for its
intended use.
Interest
rate benchmark reform
On
August 27, 2020, the IASB issued 'Interest Rate Benchmark Reform - Phase 2 (Amendments to IFRS 9, IAS 39, IFRS 7, IFRS 4 and IFRS
16) with amendments that address issues that might affect financial reporting related to financial instruments and hedge accounting
resulting from the reform of an interest rate benchmark, including its replacement with alternative benchmark rates. The amendments
are effective for annual periods beginning on or after January 1, 2021 and are to be applied retrospectively. The Company is currently
assessing the impact of the amendments on the Company's consolidated financial statements.
| SSR Mining Inc. | Financial Statements Year-End 2020 | | 29 |
SSR Mining Inc. Notes to the Consolidated Financial Statements (tabular amounts expressed in thousands of United States dollars unless otherwise stated) |
| 2. | SUMMARY OF SIGNIFICANT ACCOUNTING POLICIES (continued) |
(r) Changes
in accounting policies
Presentation
of cash flows associated with interest payments
During
the current reporting period, the Company changed its presentation of interest payments in the consolidated statements of cash
flows. Previously, interest payments were classified as an operating activity in the consolidated statements of cash flows. In
connection with the debt assumed on the acquisition of Alacer in the current period, the Company has determined that classifying
interest payments as a financing activity better represents the underlying nature of the cash flows. As a result, interest payments
have been classified as a financing activity in the consolidated statements of cash flows for the year ended December 31, 2020.
The comparative figures for the year ended December 31, 2019 have been restated to conform with the presentation in the current
period.
The
following table outlines the impact of the change in the presentation of interest paid in the consolidated statements of cash flows
for the year ended December 31, 2019:
| |
Year ended December 31, 2019 |
| |
As previously reported |
Adjustment |
Restated |
| Interest paid |
$ |
(11,646) |
|
$ |
11,646 |
|
$ |
- |
|
| Cash generated by operating activities |
134,198 |
|
11,646 |
|
145,844 |
|
| |
|
|
|
| Interest paid |
- |
|
(11,646) |
|
(11,646) |
|
| Cash generated by financing activities |
80,553 |
|
(11,646) |
|
68,907 |
|
Definition
of a business
In
October 2018, the IASB amended IFRS 3, Business Combinations ("IFRS 3") to clarify and narrow the definition of
a business. The amendments are effective for acquisition transactions on or after January 1, 2020. Under the amended standard,
a business must include inputs and a substantive process, and the inputs and process must together significantly contribute to
creating outputs. The Company applied the amended standard effective January 1, 2020 which did not have an impact on the Company's
consolidated financial statements for the year ended December 31, 2020.
| 3. | AREAS OF JUDGMENT AND ESTIMATION UNCERTAINTY |
In
preparing its consolidated financial statements, the Company makes judgments in applying its accounting policies. The judgments
that have the most significant effect on the amounts recognized in the consolidated financial statements are outlined below. In
addition, the preparation of consolidated financial statements in conformity with IFRS requires the use of estimates that affect
the amounts reported and disclosed in the consolidated financial statements and related notes. These estimates are based on management’s
best knowledge of the relevant facts and circumstances, having regard to previous experience, but actual results may differ materially
from the amounts included in the consolidated financial statements. Information about assumptions and other sources of estimation
uncertainty as at December 31, 2020 that have a significant risk of resulting in a material adjustment to the carrying amounts
of assets and liabilities within the next year are outlined below.
| SSR Mining Inc. | Financial Statements Year-End 2020 | | 30 |
SSR Mining Inc. Notes to the Consolidated Financial Statements (tabular amounts expressed in thousands of United States dollars unless otherwise stated) |
| 3. | AREAS OF JUDGMENT AND ESTIMATION UNCERTAINTY (continued) |
Assessment
of impairment indicators
Judgment
is required in assessing whether certain factors would be considered an indicator of impairment. The Company considers both internal
and external information to determine whether there is an indicator of impairment present and, accordingly, whether impairment
testing is required. The information the Company considers in assessing whether there is an indicator of impairment includes, but
is not limited to, market and economic conditions, commodity prices, reserves and resources, mine plans and operating results,
market transactions for similar assets and its market capitalization.
At
December 31, 2020 and 2019, the Company assessed whether there were indicators of impairment present for its mineral properties,
plant and equipment. At December 31, 2020, as part of its assessment, the Company noted no indicators of impairment.
As
part of its assessment at December 31, 2019, the Company noted that total sustaining capital expenditures estimated in Puna's 2019
LOM plan, which was completed in the fourth quarter of 2019, were significantly higher than the sustaining capital expenditures
estimated in Puna's 2016 technical report. The increase in the estimate of total sustaining capital expenditures over the LOM was
considered to be an indicator of impairment. As a result, the Company performed an impairment assessment of Puna as at December
31, 2019 (note 25).
Functional
currency
The
Company has determined the functional currency of SSR Mining and each of its subsidiaries is the U.S. dollar. The determination
of a subsidiary’s functional currency requires significant judgment to determine the primary economic environment. The Company
reconsiders the functional currency of its subsidiaries when there is a change in events and conditions which determined the primary
economic environment.
Deferred
tax assets and liabilities
Judgment is required in assessing
whether deferred tax assets and certain deferred tax liabilities are recognized in the consolidated statements of financial position
and what tax rate is expected to be applied in the year when the related temporary differences reverse. In assessing the recoverability
of deferred tax assets, judgment is applied to determine the Company's ability to use the underlying future tax deductions. Judgment
is applied when determining that deferred tax liabilities arising from temporary differences on investments in subsidiaries should
not be recognized as the reversal of the temporary differences is not expected to occur in the foreseeable future and can be controlled
by the Company. Judgment is also required on the application of income tax legislation. These judgments are subject to risk and
uncertainty and could result in an adjustment to the deferred tax provision and a corresponding credit or charge to profit.
Acquisitions
IFRS
3 requires that, for each business combination, one of the combining entities should be identified as the acquirer. This assessment
focuses on which entity obtains control of another entity. When the acquirer is not clearly indicated, supplementary factors such
as: which entity transfers cash or other assets or incurs liabilities; which entity issues its equity interests; and the relative
size of the entities are considered. By virtue of the Company issuing equity instruments and the relative voting rights of SSR
Mining shareholders, including significant minority shareholders post-merger, SSR Mining has been identified as the acquirer of
Alacer (notes 1(a) and 4(a)) and, as such, the transaction has been accounted for using the acquisition method of accounting in
accordance with IFRS 3.
| SSR Mining Inc. | Financial Statements Year-End 2020 | | 31 |
SSR Mining Inc. Notes to the Consolidated Financial Statements (tabular amounts expressed in thousands of United States dollars unless otherwise stated) |
| 3. | AREAS OF JUDGMENT AND ESTIMATION UNCERTAINTY (continued) |
| (b) | Sources of Estimation Uncertainty |
Mineral Reserves
and Mineral Resources
The
Company estimates Mineral Reserves and Mineral Resources based on information prepared by qualified persons as defined by NI 43-101.
Mineral Reserves are used in the calculation of depletion and depreciation, and in performing impairment testing and for forecasting
the timing of the payment of reclamation and closure costs, and future taxes. In assessing the LOM for accounting purposes, Mineral
Resources are only taken into account where there is a high degree of confidence of economic extraction. There are numerous uncertainties
inherent in estimating Mineral Reserves, and assumptions that are valid at the time of estimation may change significantly when
new information becomes available. Changes in the forecast prices of commodities, exchange rates, production costs or recovery
rates may, ultimately, result in Mineral Reserves estimates being revised. Such changes in Mineral Reserves could impact depletion
and depreciation rates, carrying amounts of mineral properties, plant and equipment and the provision for reclamation and closure
costs.
Recoverable
amount of goodwill
A
discounted cash flow model is used to determine the recoverable amount of the Seabee CGU when performing the annual impairment
test for goodwill. The projected cash flows are significantly affected by assumptions related to future metal prices, production
based on current estimates of Mineral Reserves and recoverable Mineral Resources, future operating costs and capital expenditures,
the discount rate and future Canadian dollar ("CAD") to U.S. dollar ("USD") foreign exchange rates. Note 11
outlines the significant inputs used when performing the Company's goodwill impairment testing. These inputs are based on management's
best estimates of what an independent market participant would consider appropriate. There is a risk that changes in these inputs
may result in a material adjustment to the carrying value of goodwill within the next year.
Valuation
of inventory
The
measurement of inventory, including the determination of its NRV, especially as it relates to ore in stockpiles, leach pad inventory,
and work-in-process involves the use of estimates.
The
NRV of inventory is calculated as the estimated price at the time of sale based on prevailing and forecast metal prices less estimated
future production costs to convert the inventory into saleable form and associated selling costs. In addition, in determining the
value of leach pad inventory, the Company makes estimates of quantities and grades of ore stacked on leach pads, and the recoverable
gold in this material to determine the total inventory. Changes in these estimates can result in a change in carrying amounts of
inventory, as well as cost of sales. The determination of forecast sales prices, recovery rates, grade, assumed contained metal
in stockpiles, work-in-process and leach pad inventory and production and selling costs requires significant assumptions that may
impact the carrying amount of inventories.
Depletion
and depreciation
The
Company uses the units-of-production method to deplete mineral properties, whereby depletion is calculated using the quantity of
ounces extracted from the mine in the period as a percentage of the total quantity of ounces expected to be extracted in current
and future periods. Other assets are depreciated, net of residual value, using the straight-line method over the useful life of
the asset.
The
calculation of the units-of-production rate and the useful life and residual values of mineral properties, plant and equipment,
and therefore the annual depletion and depreciation expense, could be materially affected by changes in the underlying estimates.
Changes in estimates can be the result of changes in the Company's mine plans, differences between estimated and actual costs of
mining and differences in the metal price used in the estimation of Mineral Reserves.
| SSR Mining Inc. | Financial Statements Year-End 2020 | | 32 |
SSR Mining Inc. Notes to the Consolidated Financial Statements (tabular amounts expressed in thousands of United States dollars unless otherwise stated) |
| 3. | AREAS OF JUDGMENT AND ESTIMATION UNCERTAINTY (continued) |
| (b) | Sources of Estimation Uncertainty (continued) |
Estimate
of reclamation and closure costs
The
Company's provision for reclamation and closure cost obligations represents management's best estimate of the present value of
the future cash outflows required to settle the liability, which reflects estimates of future costs, the timing of the cash flows
associated with the future costs, inflation and movements in foreign exchange rates when liabilities are anticipated to be settled
in a foreign currency. Cost estimates can vary in response to many factors including changes to the relevant legal requirements,
whether closure plans achieve intended reclamation goals, the emergence of new restoration techniques or experience at other mine
sites, local inflation rates and foreign exchange rates. The expected timing of expenditures can also change, for example, in response
to changes in Mineral Reserves, production rates or economic conditions. The Company's assumptions are reviewed at the end of each
reporting period and adjusted to reflect management's current best estimate, and changes in any of the above factors can result
in a material change to the provision recognized.
Income taxes
The
Company is subject to income taxes in numerous jurisdictions and significant judgment is required in determining the worldwide
provision for income taxes. There are transactions undertaken during the ordinary course of business for which the ultimate tax
determination is uncertain, including, but not limited to, the eligibility of qualified expenditures at Çöpler for
investment incentive tax credits. The Company recognizes current and deferred tax assets and liabilities based on its current understanding
of applicable tax laws as well as assumptions on future taxable income which demonstrate that taxable profit will be available
against which deferred tax assets and other deductible temporary differences can be utilized.
The
Company is subject to assessments by various taxation authorities, which may interpret legislation differently. Tax regulations
and legislation and related interpretations may also change in the future. Where the final tax outcome is different from that which
has been reflected in the consolidated financial statements, such differences will impact the current and/or deferred tax provisions
in the period in which such determination is made.
| SSR Mining Inc. | Financial Statements Year-End 2020 | | 33 |
SSR Mining Inc. Notes to the Consolidated Financial Statements (tabular amounts expressed in thousands of United States dollars unless otherwise stated) |
(a) Acquisition
of Alacer
On
September 16, 2020, the Company acquired all of the issued and outstanding common shares of Alacer (note 1(a)). The Company determined
that the transaction represented a business combination under IFRS 3, with SSR Mining identified as the acquiror. Based upon the
September 15, 2020 closing share price of the Company's common shares, the total purchase price consideration of the acquisition
was $2.2 billion. Transaction and integration costs incurred by the Company of $20.8 million, which included $11.0 million
for severance and termination payments to executives, were recognized in the consolidated
statements of income for the year ended December 31, 2020.
The
acquisition date fair value of the consideration transferred consists of the following:
| Purchase Price |
|
| Share consideration (1) |
$ |
2,127,284 |
|
| RSU, PSU and DSU consideration (2) |
52,363 |
|
| Total consideration |
$ |
2,179,647 |
|
| (1) | The fair value of 95,699,911 common shares issued to Alacer
shareholders was determined using SSR Mining's common share price of C$29.31 ($22.22) per share on September 15, 2020. |
| (2) | The fair value of 3,570,261 RSU, 3,463,023 PSU and 1,158,071
DSU consideration units issued was determined using the Alacer share price of C$9.51 ($7.21) on September 15, 2020, adjusted for
the Exchange Ratio. Of the amount relating to the RSU, PSU and DSU consideration, $15.4 million was recognized in equity and
$23.8 million and $13.2 million were recognized in accrued liabilities and other non-current liabilities, respectively. |
The
table below presents the fair values of the assets acquired and liabilities assumed at the date of acquisition.
| Cash and cash equivalents |
$ |
270,445 |
|
| Trade and other receivables |
17,218 |
|
| Inventories - current |
224,992 |
|
| Other assets - current |
6,039 |
|
| Mineral properties, plant and equipment |
2,789,832 |
|
| Inventories - non-current |
124,775 |
|
| Restricted cash |
32,943 |
|
| Investments in joint ventures |
9,148 |
|
| Other assets - non-current |
9,575 |
|
| Total identifiable assets acquired |
3,484,967 |
|
| |
|
| Accounts payable and accrued liabilities |
(71,861) |
|
| Current portion of debt |
(70,000) |
|
| Debt |
(175,000) |
|
| Reclamation and closure cost provision - non-current |
(26,154) |
|
| Lease liabilities - non-current |
(114,820) |
|
| Deferred income tax liabilities (1) |
(337,752) |
|
| Other non-current liabilities |
(3,081) |
|
| Non-controlling interest (2) |
(506,652) |
|
| Total identifiable liabilities assumed |
(1,305,320) |
|
| Total identifiable net assets |
$ |
2,179,647 |
|
| (1) | Deferred income tax liabilities is net of a deferred income
tax asset of $182.9 million relating to investment incentive tax credits at Çöpler and includes a deferred
income tax liability of $29.2 million for withholding tax on distributable earnings of the Turkish entities. |
| (2) | Non-controlling interest is measured based on the relative ownership percentage
multiplied by the fair value of Anagold's net assets included above. |
| SSR Mining Inc. | Financial Statements Year-End 2020 | | 34 |
SSR Mining Inc. Notes to the Consolidated Financial Statements (tabular amounts expressed in thousands of United States dollars unless otherwise stated) |
| 4. | ACQUISITIONS (continued) |
In
accordance with the acquisition method of accounting, the consideration transferred has been allocated to the underlying assets
acquired and liabilities assumed, based upon their estimated fair values as at the date of acquisition. The fair values of inventories
were determined based on an NRV approach, whereby the future estimated cash flows from sales of payable metal produced are adjusted
for costs to complete. The fair values of mineral properties have been estimated using discounted cash flow models and the fair
values of plant and equipment have been estimated using a depreciated replacement cost approach. An in-situ approach was used to
estimate the fair values of certain exploration assets with reference to a public company comparables analysis. Expected future
cash flows are based on estimates of future metal prices, production based on current estimates of Mineral Reserves and recoverable
Mineral Resources, future operating costs and capital expenditures, and discount rates. The valuation of net deferred tax liabilities
includes an amount recognized for deferred tax assets relating to investment incentive tax credits for which the Company has determined
it is probable that the qualifying expenditures will be accepted as eligible expenditures and that taxable profits will be available
to be utilized.
Consolidated
revenue for the year ended December 31, 2020 includes revenue from the assets acquired in the acquisition of Alacer of $205.5 million.
Consolidated net income for the year ended December 31, 2020 includes net income before tax from Alacer of $43.4 million.
Had the transaction occurred
on January 1, 2020, pro-forma unaudited consolidated revenue for the year ended December 31, 2020 would have been approximately
$1.2 billion and net income before tax would have been $208.9 million.
(b) Acquisition
of non-controlling interest in Puna
On
September 18, 2019, the Company acquired the remaining 25% interest in Puna from Golden Arrow Resources Corporation ("Golden
Arrow") for aggregate consideration of $32.4 million, consisting of $2.3 million of cash, the extinguishment of the loan to
Golden Arrow and related interest of $11.4 million, the issuance of $18.2 million of the Company's common shares, and the transfer
of shares in Golden Arrow held by the Company, with a fair value of $0.5 million, for cancellation.
As
the acquisition did not result in a change of control, the acquisition was accounted for as an equity transaction whereby the carrying
amount of the non-controlling interest of $33.9 million in Puna prior to the acquisition was adjusted to nil in the consolidated
statements of financial position. Further, the difference of $1.6 million between the carrying amount of the non-controlling interest
in Puna at the time of acquisition and the fair value of the consideration paid to Golden Arrow of $32.4 million was recognized
in equity. In addition, transaction costs incurred in connection with the transaction of $0.2 million were recognized as a reduction
of equity.
| 5. | CASH AND CASH EQUIVALENTS |
| |
December 31, 2020 |
December 31, 2019 |
| Cash |
$ |
427,530 |
|
$ |
164,470 |
|
| Short-term investments |
433,107 |
|
339,177 |
|
| |
$ |
860,637 |
|
$ |
503,647 |
|
| SSR Mining Inc. | Financial Statements Year-End 2020 | | 35 |
SSR Mining Inc. Notes to the Consolidated Financial Statements (tabular amounts expressed in thousands of United States dollars unless otherwise stated) |
| |
December 31, 2020 |
December 31, 2019 |
| Balance, beginning of year |
$ |
66,453 |
|
$ |
29,542 |
|
| Additions |
35,132 |
|
6,112 |
|
| Disposals |
(97,098) |
|
(3,534) |
|
| Fair value adjustments |
22,261 |
|
34,333 |
|
| Balance, end of year |
$ |
26,748 |
|
$ |
66,453 |
|
Purchases
and sales of marketable securities are accounted for as of the trade date.
During
the year ended December 31 2020, the Company sold 100% of its equity position in SilverCrest Metals Inc. and other securities for
gross proceeds of $97.1 million, being the fair value of the investments at the dates of disposals. On disposal, the cumulative
gain recognized in AOCI was $38.0 million (pre-tax).
| 7. | TRADE AND OTHER RECEIVABLES |
| |
December 31, 2020 |
December 31, 2019 |
| Trade receivables |
$ |
38,456 |
|
$ |
54,164 |
|
| Value added tax receivables |
24,569 |
|
10,944 |
|
| Income tax receivable |
14,129 |
|
3,489 |
|
| Other taxes receivable |
4,144 |
|
2,368 |
|
| Other |
2,193 |
|
863 |
|
| |
$ |
83,491 |
|
$ |
71,828 |
|
No
provision for credit loss was recognized at December 31, 2020 or 2019. All trade receivables are expected to be settled within
twelve months. Credit risk is further discussed in note 27(b).
| |
December 31, 2020 |
December 31, 2019 |
| Stockpiled ore (1) |
$ |
157,141 |
|
$ |
16,559 |
|
| Leach pad inventory |
284,355 |
|
171,768 |
|
| Work-in-process |
4,368 |
|
1,596 |
|
| Finished goods |
38,661 |
|
14,141 |
|
| Materials and supplies |
87,466 |
|
35,354 |
|
| |
571,991 |
|
239,418 |
|
| Stockpiled ore - non-current |
(132,912) |
|
- |
|
| Materials and supplies - non-current |
(1,700) |
|
(1,848) |
|
| |
$ |
437,379 |
|
$ |
237,570 |
|
(1)
At December 31, 2020, stockpiled ore includes $12.5 million and $132.9 million of current and non-current stockpiled sulfide ore,
respectively, related to Çöpler (December 31, 2019 - Nil current and non-current stockpiled sulfide ore related to
Çöpler).
As
at December 31, 2020, the Company has recognized a provision of $7.2 million (2019 - $3.3 million) for obsolete materials
and supplies inventory.
During
the year ended December 31, 2020, the Company recognized $8.6 million (2019 - $3.6 million) in write-downs of stockpiled ore inventories
to NRV as an expense, included in cost of sales, in the consolidated statements of income.
| SSR Mining Inc. | Financial Statements Year-End 2020 | | 36 |
SSR Mining Inc. Notes to the Consolidated Financial Statements (tabular amounts expressed in thousands of United States dollars unless otherwise stated) |
| 9. | MINERAL PROPERTIES, PLANT AND EQUIPMENT |
| |
December 31, 2020 |
| |
Plant and equipment (1) |
Construction in process |
Mineral properties subject to depletion |
Mineral properties not yet subject to depletion |
Exploration and evaluation assets |
Total |
| Cost |
|
|
|
|
|
|
| Balance, beginning of year |
$ |
663,368 |
|
$ |
28,208 |
|
$ |
539,378 |
|
$ |
80,296 |
|
$ |
127,141 |
|
$ |
1,438,391 |
|
| Alacer acquisition (note 4(a)) |
926,228 |
|
26,874 |
|
882,742 |
|
146,086 |
|
807,902 |
|
2,789,832 |
|
| Additions |
2,927 |
|
104,475 |
|
55,477 |
|
2,714 |
|
7,980 |
|
173,573 |
|
| Disposals/removal of fully depreciated assets |
(22,466) |
|
(297) |
|
(24,373) |
|
- |
|
- |
|
(47,136) |
|
| Change in reclamation and closure cost provision |
- |
|
- |
|
8,799 |
|
- |
|
1,388 |
|
10,187 |
|
| Transfers |
105,226 |
|
(116,253) |
|
14,593 |
|
(3,568) |
|
2 |
|
- |
|
| Balance, end of year |
1,675,283 |
|
43,007 |
|
1,476,616 |
|
225,528 |
|
944,413 |
|
4,364,847 |
|
| |
|
|
|
|
|
|
| Accumulated depletion and depreciation |
|
|
|
|
|
|
| Balance, beginning of year |
(375,398) |
|
- |
|
(293,531) |
|
- |
|
- |
|
(668,929) |
|
| Depletion and depreciation |
(73,041) |
|
- |
|
(97,757) |
|
- |
|
- |
|
(170,798) |
|
| Disposals/removal of fully depreciated assets |
16,412 |
|
- |
|
24,373 |
|
- |
|
- |
|
40,785 |
|
| Balance, end of year |
(432,027) |
|
- |
|
(366,915) |
|
- |
|
- |
|
(798,942) |
|
| Carrying amount at December 31, 2020 |
$ |
1,243,256 |
|
$ |
43,007 |
|
$ |
1,109,701 |
|
$ |
225,528 |
|
$ |
944,413 |
|
$ |
3,565,905 |
|
| SSR Mining Inc. | Financial Statements Year-End 2020 | | 37 |
SSR Mining Inc. Notes to the Consolidated Financial Statements (tabular amounts expressed in thousands of United States dollars unless otherwise stated) |
| 9. | MINERAL PROPERTIES, PLANT AND EQUIPMENT (continued) |
| |
December 31, 2019 |
| |
Plant and equipment (1) |
Construction in process |
Mineral properties subject to depletion |
Mineral properties not yet subject to depletion |
Exploration and evaluation assets |
Total |
| Cost |
|
|
|
|
|
|
| Balance, beginning of year |
$ |
577,023 |
|
$ |
44,859 |
|
$ |
463,548 |
|
$ |
101,990 |
|
$ |
91,228 |
|
$ |
1,278,648 |
|
| Additions |
6,515 |
|
75,636 |
|
42,373 |
|
7,145 |
|
35,275 |
|
166,944 |
|
| Disposals |
(12,457) |
|
- |
|
(2,962) |
|
- |
|
(434) |
|
(15,853) |
|
| Change in reclamation and closure cost provision |
- |
|
- |
|
7,580 |
|
- |
|
1,072 |
|
8,652 |
|
| Transfers |
92,287 |
|
(92,287) |
|
28,839 |
|
(28,839) |
|
- |
|
- |
|
| Balance, end of year |
663,368 |
|
28,208 |
|
539,378 |
|
80,296 |
|
127,141 |
|
1,438,391 |
|
| |
|
|
|
|
|
|
| Accumulated depreciation and depletion |
|
|
|
|
|
|
| Balance, beginning of year |
(338,153) |
|
- |
|
(239,320) |
|
- |
|
- |
|
(577,473) |
|
| Depreciation and depletion |
(48,226) |
|
- |
|
(55,783) |
|
- |
|
- |
|
(104,009) |
|
| Disposals |
10,981 |
|
- |
|
1,572 |
|
- |
|
- |
|
12,553 |
|
| Balance, end of year |
(375,398) |
|
- |
|
(293,531) |
|
- |
|
- |
|
(668,929) |
|
| Carrying amount at December 31, 2019 |
$ |
287,970 |
|
$ |
28,208 |
|
$ |
245,847 |
|
$ |
80,296 |
|
$ |
127,141 |
|
$ |
769,462 |
|
| (1) | At December 31, 2020, plant and equipment includes right-of-use
assets with a carrying amount of $121.6 million (2019 - $3.5 million) (note 16).
|
| |
December 31, 2020 |
December 31, 2019 |
| Restricted cash |
$ |
35,288 |
|
$ |
2,339 |
|
| |
|
|
|
|
|
|
Restricted
cash is deposited at banks and financial institutions and represents both a debt service reserve account and reclamation reserve
account. As at December 31, 2020, $32.9 million of restricted cash relates to the Term Loan (note 14(b)). Restricted cash
is not available for use within one year and is classified as a non-current asset in the consolidated statements of financial position.
| SSR Mining Inc. | Financial Statements Year-End 2020 | | 38 |
SSR Mining Inc. Notes to the Consolidated Financial Statements (tabular amounts expressed in thousands of United States dollars unless otherwise stated) |
In
connection with the acquisition of Seabee in 2016, the Company recognized goodwill of $49.8 million. In accordance with IAS 36,
Impairment of Assets, the Company performed the annual goodwill impairment test at December 31, 2020. For the purposes
of the goodwill impairment test, the recoverable amount of Seabee, which is considered to be the CGU, has been determined to be
the FVLCTD.
A
discounted cash flow model is used to determine the FVLCTD of Seabee. The projected cash flows are significantly affected by assumptions
related to future metal prices, production based on current estimates of Mineral Reserves and recoverable Mineral Resources, future
operating costs and capital expenditures, the discount rate and future CAD to USD foreign exchange rates. These inputs are based
on management's best estimates of what an independent market participant would consider appropriate. Projected cash flows under
the discounted cash flow model are after-tax and discounted using the Company's estimated weighted average cost of capital adjusted
for asset specific risks. Commodity prices and the foreign exchange rate used to project cash flows are based on observable market
or publicly available data, including forward prices and analyst forecasts.
The
discounted cash flow model for Seabee as at December 31, 2020 reflects the CGU's projected future cash flows for the period from
2021 to 2026 using a long-term gold price of $1,561 per ounce and a long-term foreign exchange rate of $1.31 CAD to USD $1.00.
The projected future cash flows were discounted using a post-tax real discount rate adjusted for asset specific risks of 4.5%.
At December 31, 2020, the calculated recoverable amount of the Seabee CGU exceeded the carrying amount, and therefore no impairment
charge has been recognized.
The
fair value measurement for the Seabee CGU as at December 31, 2020 is categorized as a Level 3 fair value (note 26(b)) based on
the inputs used in the discounted cash flow model.
| 12. | CURRENT AND DEFERRED INCOME TAX |
The
following table represents the major components of income tax expense recognized in the consolidated statements of income for the
years ended December 31, 2020 and 2019:
| Years ended December 31 |
2020 |
2019 |
| Current tax expense |
$ |
22,544 |
|
$ |
24,796 |
|
| Deferred tax expense |
18,309 |
|
5,576 |
|
| Total income tax expense |
$ |
40,853 |
|
$ |
30,372 |
|
| SSR Mining Inc. | Financial Statements Year-End 2020 | | 39 |
SSR Mining Inc. Notes to the Consolidated Financial Statements (tabular amounts expressed in thousands of United States dollars unless otherwise stated) |
| 12. | CURRENT AND DEFERRED INCOME TAX (continued) |
Income
tax expense differs from the amount that would be computed by applying the Canadian statutory rate of 27% (2019- 27%) to income
before income taxes. The reasons for the differences are as follows:
| Years ended December 31 |
2020 |
2019 |
| Income before income taxes |
$ |
181,321 |
|
$ |
86,129 |
|
| Statutory tax rate |
27.00 |
% |
27.00 |
% |
| Expected income tax expense |
48,957 |
|
23,254 |
|
| |
|
|
| Increase (decrease) attributable to: |
|
|
| Non-taxable items |
(30,371) |
|
(17,654) |
|
| Foreign exchange |
7,858 |
|
15,058 |
|
| Differences in foreign and future tax rates |
(7,272) |
|
(3,309) |
|
| Investment incentive tax credits |
1,983 |
|
- |
|
| Mineral and overseas withholding tax |
17,027 |
|
10,249 |
|
| Expired losses |
1,129 |
|
738 |
|
| Change in estimates in respect of prior years |
(1,616) |
|
(2,316) |
|
| Changes in recognition of deferred tax assets |
3,003 |
|
3,952 |
|
| Other |
155 |
|
400 |
|
| Total income tax expense |
$ |
40,853 |
|
$ |
30,372 |
|
| SSR Mining Inc. | Financial Statements Year-End 2020 | | 40 |
SSR Mining Inc. Notes to the Consolidated Financial Statements (tabular amounts expressed in thousands of United States dollars unless otherwise stated) |
| 12. | CURRENT AND DEFERRED INCOME TAX (continued) |
The
significant components of deferred income tax assets and deferred income tax liabilities as at December 31, 2020 and 2019
are presented below:
| |
December 31, 2020 |
December 31, 2019 |
| Deferred income tax assets |
|
|
| Deductible temporary differences relating to: |
|
|
| Inventories |
$ |
2,691 |
|
$ |
2,241 |
|
| Reclamation and closure cost provision |
6,140 |
|
4,760 |
|
| Lease liabilities |
24,247 |
|
917 |
|
| Deductibility of other taxes |
9,658 |
|
9,242 |
|
| Share-based compensation |
8,820 |
|
4,554 |
|
| Other items |
8,306 |
|
4,446 |
|
| |
59,862 |
|
26,160 |
|
| Investment incentive tax credits (1) |
168,447 |
|
- |
|
| Tax loss carryforwards |
12,556 |
|
9,919 |
|
| Total deferred income tax assets |
$ |
240,865 |
|
$ |
36,079 |
|
| |
|
|
| Deferred income tax liabilities |
|
|
| Taxable temporary differences relating to: |
|
|
| Marketable securities |
$ |
(2,041) |
|
$ |
(4,118) |
|
| Inventories |
(46,431) |
|
(4,138) |
|
| Mineral properties, plant and equipment |
(582,364) |
|
(98,438) |
|
| Convertible notes |
(13,105) |
|
(15,046) |
|
| Mineral tax |
(42,125) |
|
(40,462) |
|
| Foreign withholding tax |
(32,875) |
|
- |
|
| Other items |
(761) |
|
(1,629) |
|
| Total deferred income tax liabilities |
$ |
(719,702) |
|
$ |
(163,831) |
|
| |
|
|
| Balance sheet presentation |
|
|
| Deferred income tax assets |
$ |
4,612 |
|
$ |
63 |
|
| Deferred income tax liabilities |
(483,449) |
|
(127,815) |
|
| Deferred income tax liabilities, net |
$ |
(478,837) |
|
$ |
(127,752) |
|
| (1) | The Company receives investment incentive tax credits
for qualifying expenditures at Çöpler. The application of these tax credits, which are denominated in Turkish Lira,
reduced income tax expense and cash tax payments for the year ended December 31, 2020 and are expected to offset future cash tax
payments. Reviews of eligible expenditures for tax credits by local tax authorities occur periodically and can result in adjustments
to the recognition of investment incentive tax credits. |
As at December 31,
2020, an aggregate deferred tax liability of $14.1 million (2019 - $14.0 million) for temporary differences of $47.0 million (2019
- $46.5 million) related to investments in subsidiaries was not recognized as the Company controls the dividend policy of its subsidiaries
(i.e., the Company controls the timing of reversal of the related taxable temporary differences and is satisfied that they will
not reverse in the foreseeable future).
| SSR Mining Inc. | Financial Statements Year-End 2020 | | 41 |
SSR Mining Inc. Notes to the Consolidated Financial Statements (tabular amounts expressed in thousands of United States dollars unless otherwise stated) |
| 12. | CURRENT AND DEFERRED INCOME TAX (continued) |
The Company recognizes tax
benefits on losses or other deductible amounts generated in countries where it determines that it is
probable that taxable profits will be available to be utilized against those temporary differences. At December 31, 2020,
the Company's unrecognized deductible temporary differences and unused tax losses for which no deferred tax asset is recognized
consist of the following amounts:
| |
December 31, 2020 |
December 31, 2019 |
| Mineral properties, plant and equipment |
$ |
523 |
|
$ |
4,850 |
|
| Reclamation and closure cost provision |
61,650 |
|
46,418 |
|
| Tax loss carryforwards and tax credits |
38,235 |
|
15,192 |
|
| Mineral and foreign withholding tax |
570 |
|
616 |
|
| Share-based compensation |
9,591 |
|
- |
|
| Other items |
8,214 |
|
6,913 |
|
| Unrecognized deductible temporary differences |
$ |
118,783 |
|
$ |
73,989 |
|
At
December 31, 2020, the Company had the following estimated tax operating losses available to reduce future taxable income,
including both losses for which deferred tax assets are utilized to offset applicable deferred tax liabilities and losses for which
deferred tax assets are not recognized as listed in the table above. Losses expire at various dates and amounts between 2021 and
2040.
| |
December 31, 2020 |
| Mexico |
$ |
39,197 |
|
| Canada |
33,304 |
|
| U.S.A. |
7,802 |
|
| Peru |
71 |
|
| Tax operating losses |
$ |
80,374 |
|
| 13. | ACCOUNTS PAYABLE AND ACCRUED LIABILITIES |
| |
December 31, 2020 |
December 31, 2019 |
| Trade payables |
$ |
42,600 |
|
$ |
33,579 |
|
| Accrued liabilities |
46,791 |
|
38,464 |
|
| Royalties payable |
36,019 |
|
3,528 |
|
| Share-based compensation liabilities |
30,050 |
|
19,538 |
|
| Derivative liabilities |
3,764 |
|
- |
|
| Income taxes payable |
9,452 |
|
12,767 |
|
| Lease liabilities |
5,686 |
|
446 |
|
| Other |
1,622 |
|
2,803 |
|
| |
$ |
175,984 |
|
$ |
111,125 |
|
| SSR Mining Inc. | Financial Statements Year-End 2020 | | 42 |
SSR Mining Inc. Notes to the Consolidated Financial Statements (tabular amounts expressed in thousands of United States dollars unless otherwise stated) |
| 14. | DEBT AND CREDIT FACILITY |
| |
December 31, 2020 |
December 31, 2019 |
| 2013 Notes |
$ |
- |
|
$ |
114,280 |
|
| 2019 Notes |
177,582 |
|
169,769 |
|
| Total carrying amount of convertible debt |
177,582 |
|
284,049 |
|
| Term Loan |
210,000 |
|
- |
|
| Other |
3,088 |
|
- |
|
| Total carrying amount |
$ |
390,670 |
|
$ |
284,049 |
|
The
following is a reconciliation of the changes in the Company's debt balance to cash flows arising from financing activities:
| |
December 31, 2020 |
December 31, 2019 |
| Balance, beginning of year (1) |
$ |
286,852 |
|
$ |
250,729 |
|
| Financing cash flows: |
|
|
| Interest paid |
(12,444) |
|
(9,104) |
|
| Redemption of 2013 Notes |
(114,994) |
|
(141,982) |
|
| Issuance of 2019 Notes |
- |
|
164,160 |
|
| Principal paid on Term Loan |
(35,000) |
|
- |
|
| Other changes: |
|
|
| Interest expense |
19,916 |
|
23,049 |
|
| Redemption of 2013 Notes - converted to equity |
(6) |
|
- |
|
| Term Loan assumed (Note 4(a)) |
245,000 |
|
- |
|
| Issuance of debt |
3,088 |
|
- |
|
| Balance, end of year (1) |
392,412 |
|
286,852 |
|
| Less: Accrued interest |
(1,742) |
|
(2,803) |
|
| Carrying amount, end of year |
$ |
390,670 |
|
$ |
284,049 |
|
| |
|
|
| Classified as: |
|
|
| Current |
$ |
71,025 |
|
$ |
114,280 |
|
| Non-current |
319,645 |
|
169,769 |
|
| |
$ |
390,670 |
|
$ |
284,049 |
|
| (1) | Includes accrued interest presented within accounts payable and accrued liabilities. |
2013
Notes
On
March 19, 2019, the Company repurchased $150.0 million of its 2.875% senior convertible notes due 2033 (the "2013 Notes")
for a cash payment of $152.2 million. The redemption amount was bifurcated into the debt and equity components of the 2013
Notes purchased. The amount allocated to the debt component was based on the fair value of the debt of $147.4 million, estimated
using a discounted cash flow model and a discount rate of 4.95% and the residual of $4.8 million was allocated to equity.
The difference of $5.4 million between the fair value and the book value of the redeemed 2013 Notes of $142.0 million
was recognized as a loss in the consolidated statements of income along with the related tax recovery of $1.7 million.
| SSR Mining Inc. | Financial Statements Year-End 2020 | | 43 |
SSR Mining Inc. Notes to the Consolidated Financial Statements (tabular amounts expressed in thousands of United States dollars unless otherwise stated) |
| 14. | DEBT AND CREDIT FACILITY (continued) |
| (a) | Convertible debt (continued) |
2013
Notes (continued)
Pursuant
to the put option under the terms of the 2013 Notes, on January 31, 2020, $49,000 aggregate principal amount of the 2013 Notes
was redeemed at the option of the holders, and $4,000 of debt was converted to equity.
Pursuant
to the call option under the terms of the 2013 Notes, on March 30, 2020, the Company redeemed all of its remaining outstanding
2013 Notes, consisting of an aggregate principal amount of $115.0 million plus accrued interest of $0.5 million, in exchange
for payment of cash of $115.5 million and equity of $2,000.
2019
Notes
On
March 19, 2019, the Company issued $230.0 million of 2.50% convertible senior notes due in 2039 (the “2019 Notes”)
for net proceeds of $222.9 million after payment of commissions and expenses related to the offering of $7.1 million. The 2019
Notes mature on April 1, 2039 and bear an interest rate of 2.50% per annum, payable semi-annually in arrears on April 1 and October
1 of each year. The 2019 Notes are convertible into the Company's common shares at a fixed conversion rate, subject to certain
anti-dilution adjustments. In addition, if certain fundamental changes occur, holders of the 2019 Notes may be entitled to an increased
conversion rate. The 2019 Notes are convertible into the Company's common shares at an initial conversion rate of 54.1082 common
shares per $1,000 principal amount of 2019 Notes converted, representing an initial conversion price of $18.48 per common share.
Prior
to April 1, 2023, the Company may not redeem the 2019 Notes, except in the event of certain changes in Canadian tax law. On or
after April 1, 2023 and prior to April 1, 2026, the Company may redeem all or part of the 2019 Notes for cash, but only if the
last reported sales price of its common shares for 20 or more trading days in a period of 30 consecutive trading days exceeds 130%
of the conversion price in effect on each such trading day. On or after April 1, 2026, the Company may redeem the 2019 Notes in
full or in part, for cash.
Holders
of the 2019 Notes have the right to require the Company to repurchase all or part of their 2019 Notes on April 1 of each of 2026,
2029 and 2034, or upon certain fundamental corporate changes. The repurchase price will be equal to par plus accrued and unpaid
interest.
The
proceeds of the 2019 Notes have been bifurcated between their debt and equity components. The fair value of the debt portion of
$169.4 million was estimated using a discounted cash flow model method based on an expected life of seven years and a discount
rate of 7.5%. The residual of $44.8 million ($60.6 million less deferred tax liability of $15.9 million) was allocated to equity.
The transaction costs of the issuance of the 2019 Notes of $7.1 million have been allocated on a pro rata basis with $5.2 million
to debt and $1.9 million to equity.
The
amount allocated to debt, net of transaction costs, of $164.2 million will be accreted to the face value over the expected
life using the effective interest method.
(b) Term
Loan
In
connection with the acquisition of Alacer (notes 1(a) and 4(a)), the Company assumed a term loan (the "Term Loan"), with
a fair value of $245 million as at the date of acquisition, with a syndicate of lenders (BNP Paribas (Suisse) SA, ING Bank NV,
Societe Generale Corporate & Investment Banking and UniCredit S.P.A.). The Term Loan bears interest at the London Inter-bank
Offered Rate ("LIBOR") plus a fixed interest rate margin in the range of 3.50% to 3.70% depending on the tranche. The
Term Loan has no mandatory hedging or cash sweep requirements, no prepayment penalties, and final repayment is scheduled in the
fourth quarter of 2023.
| SSR Mining Inc. | Financial Statements Year-End 2020 | | 44 |
SSR Mining Inc. Notes to the Consolidated Financial Statements (tabular amounts expressed in thousands of United States dollars unless otherwise stated) |
| 14. | DEBT AND CREDIT FACILITY (continued) |
(b) Term
Loan (continued)
In
addition to the Term Loan, the Company assumed LIBOR interest rate swap contracts with underlying notional amounts of approximately
37% of the outstanding Term Loan balance as at December 31, 2020 through the duration of the interest rate hedge program,
which completes at the end of 2021. The fair value of the interest rate swap contract asset or liability is derived by the difference
between the variable LIBOR interest forward rates as compared to a fixed interest rate of 2.86% on the hedged amounts. Changes
in the fair values of the interest rate swaps are recognized in the consolidated statements of income.
Restricted
cash accounts must be maintained while the Term Loan is outstanding. As at December 31, 2020, the Company held $32.9 million
in restricted cash associated with the Term Loan (note 10).
Under the terms of the Term
Loan, the Company is required to comply with the following financial covenants:
| • | historic and forecast debt service cover
ratio greater than or equal to 1.20:1; |
| • | loan life cover ratio greater than or equal
to 1.30:1; and |
| • | minimum tail reserves as a percentage of
total reserves greater than or equal to 30%. |
As at December 31, 2020, the
Company was in compliance with all applicable covenants related to the Term Loan.
(c) Credit
Facility
On
August 4, 2015, the Company entered into a $75.0 million senior secured revolving credit facility (the "Credit Facility")
with a syndicate of banks. The Credit Facility may be used for reclamation bonding, working capital and other general corporate
purposes. During 2017, the Company extended the maturity of the Credit Facility to June 8, 2020, and concurrently reduced applicable
margins, increased covenant flexibility and added a $25.0 million accordion feature. On June 3, 2020, the Company amended its existing
credit agreement to extend the maturity of the Credit Facility to June 8, 2021. Amounts that are borrowed under the Credit Facility
will incur variable interest at LIBOR plus an applicable margin ranging from 2.25% to 3.75% determined based on the Company's net
leverage ratio, along with a utilization fee. This Credit Facility may only be used to fund activities of entities that were in
the SSR Mining group prior to the acquisition of Alacer.
The
Credit Facility also provides for financial letters of credit at 66% of the applicable margin, undrawn fees are subject to a utilization
fee of 0.25%, and standby fees are calculated as 25% of the drawn applicable margin plus a utilization fee ranging from 0.25% to
0.75%.
All
debts, liabilities and obligations under the Credit Facility are guaranteed by the Company's material subsidiaries and secured
by certain of the Company's assets and material subsidiaries, and pledges of the securities of the Company's material subsidiaries,
excluding Alacer entities. In connection with the Credit Facility, the Company must also maintain certain net tangible worth and
ratios for interest coverage and net leverage. As at December 31, 2020 the Company was in compliance with these covenants.
As at December 31, 2020,
the amount outstanding on the Credit Facility, included in accounts payable and accrued liabilities, was $0.7 million (2019 - $0.6
million).
| SSR Mining Inc. | Financial Statements Year-End 2020 | | 45 |
SSR Mining Inc. Notes to the Consolidated Financial Statements (tabular amounts expressed in thousands of United States dollars unless otherwise stated) |
| 15. | RECLAMATION AND CLOSURE COST PROVISION |
Changes
to the reclamation and closure cost provision during the years ended December 31 were as follows:
| |
2020 |
2019 |
| Balance, beginning of year |
$ |
84,235 |
|
$ |
62,172 |
|
| Provision assumed on acquisition of Alacer (1) (2) |
26,159 |
|
12,990 |
|
| Reclamation expenditures |
(2,447) |
|
(3,568) |
|
| Accretion expense (note 23(b)) |
3,887 |
|
3,743 |
|
| Foreign exchange loss |
110 |
|
308 |
|
| Revisions in estimates and obligations |
(3,360) |
|
4,168 |
|
| Impact of changes in discount rate |
10,990 |
|
4,490 |
|
| Obligations related to divested mining properties |
- |
|
(68) |
|
| Balance, end of year |
119,574 |
|
84,235 |
|
| Less: current portion |
(1,924) |
|
(8,766) |
|
| Non-current reclamation and closure cost provision |
$ |
117,650 |
|
$ |
75,469 |
|
| (1) | On September 16, 2020,
the Company acquired Alacer, including Çöpler (notes 1(a) and 4(a)).
The consideration included the assumption of non-current environmental and reclamation obligations valued at $26.2 million. |
| (2) | On June 27, 2019, the Company acquired 8,900 hectares of
land contiguous to Marigold in Nevada, U.S., net of a 0.5% net smelter returns royalty. The consideration included $22.0 million
in cash and the assumption of related non-current environmental and reclamation obligations then valued at approximately $13.0
million. |
The
reclamation and closure cost provision is calculated as the present value of estimated future net cash outflows based on the following
key assumptions:
| • | Discount rates
used in discounting the estimated reclamation and closure cost provision range between 0.7% and 12.1% for the year ended December
31, 2020 (2019 - 1.8% and 9.9%). |
| • | The majority of
the expenditures are expected to occur between 2027 and 2045. |
| • | A 1% change in
the discount rate would increase or decrease the provision on a consolidated basis by approximately $18.1 million (2019 - $11.1
million), while holding other assumptions consistent. |
The
Company's principal lease relates to its right to use the oxygen plant supplied by Air Liquide Gaz Sanayi ve Ticaret A.S. (the
"Air Liquide Plant") at Çöpler which was assumed on the acquisition of Alacer (notes 1(a) and 4(a)). The
Air Liquide Plant is used for the production, transportation and delivery of oxygen and liquid oxygen to support mining operations
at Çöpler. Under the terms of the Air Liquide Plant lease, the Company pays variable monthly lease payments that depend
on an index. In addition, the Company is subject to variable payments based on consumption and use which have been accounted for
as non-lease components and included in production costs. The Air Liquide Plant lease contains a non-cancellable period of 15 years
ending in 2033 with options to extend for consecutive 2-year periods. The lease term used in the measurement of the Company's lease
liability includes four consecutive 2-year extension periods ending in 2041 for which the Company is reasonably certain to exercise
its option in line with the Çöpler LOM.
| SSR Mining Inc. | Financial Statements Year-End 2020 | | 46 |
SSR Mining Inc. Notes to the Consolidated Financial Statements (tabular amounts expressed in thousands of United States dollars unless otherwise stated) |
Right-of-use
assets related to leased plant and equipment are included in mineral properties, plant and equipment in the consolidated statements
of financial position (note 9). The following table presents the changes in carrying amount
of the Company's right-of-use assets during the years ended December 31, 2020 and 2019:
| |
2020 |
2019 |
| Balance, beginning of year |
$ |
3,502 |
|
$ |
- |
|
| Right-of-use assets acquired on Alacer acquisition (note 4(a)) |
119,568 |
|
- |
|
| Additions |
2,857 |
|
4,584 |
|
| Terminations |
(981) |
|
- |
|
| Depreciation for the year |
(3,304) |
|
(1,082) |
|
| Balance, end of year |
$ |
121,642 |
|
$ |
3,502 |
|
(b) Lease
liabilities
The
following is a summary of the movements in the Company's lease liabilities during the years ended December 31, 2020 and 2019:
| |
2020 |
2019 |
| Balance, beginning of year |
$ |
3,792 |
|
$ |
4,310 |
|
| Financing cash flows: |
|
|
| Lease payments |
(4,883) |
|
(1,265) |
|
| Other changes: |
|
|
| Lease liabilities assumed on acquisition (note 4(a)) |
119,568 |
|
- |
|
| Additions |
2,857 |
|
264 |
|
| Terminations |
(594) |
|
- |
|
| Unrealized foreign exchange loss |
71 |
|
204 |
|
| Interest expense |
1,904 |
|
279 |
|
| Balance, end of year |
$ |
122,715 |
|
$ |
3,792 |
|
| |
|
|
| Classified as: |
|
|
| Current (1) |
$ |
5,686 |
|
$ |
446 |
|
| Non-current |
117,029 |
|
3,346 |
|
| |
$ |
122,715 |
|
$ |
3,792 |
|
| (1) | Included in accounts payable and accrued liabilities (note 13). |
(c) Amounts
recognized in statements of income
| Years ended December 31 |
2020 |
2019 |
| Right-of-use asset depreciation |
$ |
3,304 |
|
$ |
1,082 |
|
| Interest expense on lease liabilities (1) |
1,904 |
|
$ |
279 |
|
| (1) | Included in interest expense and finance costs. |
| SSR Mining Inc. | Financial Statements Year-End 2020 | | 47 |
SSR Mining Inc. Notes to the Consolidated Financial Statements (tabular amounts expressed in thousands of United States dollars unless otherwise stated) |
(d) Amounts
recognized in statements of cash flows
| Years ended December 31 |
2020 |
2019 |
| Total cash outflow for leases |
$ |
(8,198) |
|
$ |
(1,265) |
|
| |
|
|
|
|
|
|
| 17. | SHARE CAPITAL AND SHARE-BASED PAYMENTS |
(a) Authorized
capital
The
Company has unlimited authorized common shares with no par value.
The
2017 and 2020 Share Compensation Plans provide for treasury settlement up to an aggregate total of 6.5% of the Company's issued
and outstanding common shares.
(b) Stock
options
The
Company's existing incentive plan, approved by its shareholders, provides that options to purchase common shares may be granted
to officers, employees and others at the discretion of the Board of Directors. The exercise price of each option is set at the
date of grant and shall not be less than the closing market price of the Company's common shares at the date of grant. The expiry
date for all grants may not exceed the earlier of 7 years after the grant date and the latest date permitted under the rules of
the regulatory authorities. Currently, the vesting periods range up to three years, and the term is seven years. New shares from
treasury are issued on the exercise of stock options.
The
changes in issued stock options during the years ended December 31, 2020 and 2019 are as follows:
| |
2020 |
2019 |
| |
Number of stock options |
Weighted average exercise price (C$/option) |
Number of stock options |
Weighted average exercise price (C$/option) |
| Outstanding, beginning of year |
1,802,623 |
|
12.14 |
|
2,638,749 |
|
10.35 |
|
| Granted |
445,690 |
|
26.12 |
|
514,355 |
|
16.81 |
|
| Exercised |
(820,929) |
|
10.86 |
|
(1,093,844) |
|
(8.78) |
|
| Expired |
(2,622) |
|
14.95 |
|
(193,167) |
|
(18.90) |
|
| Forfeited |
(19,326) |
|
23.53 |
|
(63,470) |
|
(12.81) |
|
| Outstanding, end of year |
1,405,436 |
|
17.16 |
|
1,802,623 |
|
12.14 |
|
As
of December 31, 2020, incentive stock options constitute 0.6% (2019 - 1.5%) of
issued and outstanding common share capital. The aggregate intrinsic value of vested share options (market value less exercise
price) at December 31, 2020 was $9.3 million (2019 - $17.8 million).
During
the year ended December 31, 2020, options granted to officers and employees had exercise prices ranging from C$24.99
to C$29.09 (2019 - C$16.50 to C$17.63) and expiry dates ranging from January 1, 2027 to May 27, 2027.
| SSR Mining Inc. | Financial Statements Year-End 2020 | | 48 |
SSR Mining Inc. Notes to the Consolidated Financial Statements (tabular amounts expressed in thousands of United States dollars unless otherwise stated) |
| 17. | SHARE CAPITAL AND SHARE-BASED PAYMENTS (continued) |
(b) Stock
options (continued)
The
weighted average fair value of stock options granted during the years ended December 31, 2020 and 2019 were estimated to be
C$8.32 and C$6.22 per stock option, respectively,
at the grant date using the Black-Scholes option pricing model, based on the following assumptions:
| Years ended December 31 |
2020 |
2019 |
| Estimated forfeiture rate (%) |
3.0 |
|
3.0 |
|
| Expected dividend yield (%) |
- |
|
- |
|
| Risk-free interest rate (%) |
1.31 |
|
1.78 |
|
| Expected life (years) |
4.2 |
|
4.2 |
| Expected volatility (%) |
45.8 |
|
45.8 |
|
| Weighted average share price (C$) |
26.12 |
|
16.81 |
|
Option
pricing models require the input of highly subjective assumptions. The expected life of the options consider such factors as the
average length of time similar option grants in the past have remained outstanding prior to exercise and the vesting period of
the grants. Expected volatility was estimated based upon historical price observations over the expected term.
The
weighted average share price at the date of the exercise of stock options during the year ended December 31, 2020 was
C$26.03 (2019 - C$18.37).
The
following table summarizes information about stock options outstanding and exercisable at December 31, 2020:
| |
Stock options outstanding |
Stock options exercisable |
| Exercise prices (C$) |
Number of stock options outstanding |
Weighted average remaining contractual life (years) |
Number of stock options exercisable |
Weighted average exercise price
(C$/option) |
| 5.83 - 11.16 |
415,887 |
|
2.5 |
364,219 |
|
9.27 |
|
| 11.17 - 17.06 |
447,821 |
|
4.6 |
365,793 |
|
15.57 |
|
| 17.07 - 27.04 |
431,218 |
|
5.8 |
286,708 |
|
23.92 |
|
| 27.05 - 29.09 |
110,510 |
|
6.4 |
16,980 |
|
29.09 |
|
| |
1,405,436 |
|
4.5 |
1,033,700 |
|
15.89 |
|
(c) Deferred
Share Units
Non-executive
directors may elect to receive all or a portion of their annual compensation in the form of DSUs which are linked to the value
of the Company's common shares. DSUs are issued on a quarterly basis under the terms of the DSU Plan, at the market value of the
Company's common shares at the date of grant. DSUs vest immediately and are redeemable in cash. 50% of a director's DSUs will be
automatically redeemed on each of the following dates: (i) three months following the date the eligible director ceases to be a
director of the Company and (ii) the earlier of fifteen months following, or December 31 of the calendar year following the date
the eligible director ceases to be a director of the Company.
| SSR Mining Inc. | Financial Statements Year-End 2020 | | 49 |
SSR Mining Inc. Notes to the Consolidated Financial Statements (tabular amounts expressed in thousands of United States dollars unless otherwise stated) |
| 17. | SHARE CAPITAL AND SHARE-BASED PAYMENTS (continued) |
(c) Deferred
Share Units (continued)
The
following table summarizes the changes in DSUs outstanding during the years ended December 31, 2020 and 2019:
| |
2020 |
2019 |
| Years ended December 31 |
Number of DSUs |
Number of DSUs |
| Outstanding, beginning of year |
613,617 |
|
533,698 |
|
| Granted |
63,089 |
|
79,919 |
|
| Issued in connection with Alacer acquisition |
234,440 |
|
- |
|
| Redeemed |
(163,161) |
|
- |
|
| Outstanding, end of year |
747,985 |
|
613,617 |
|
DSUs
granted in the year ended December 31, 2020 had a weighted average fair value of C$26.03 per
unit at the date of grant (2019 - C$17.90).
In
connection with the acquisition of Alacer (notes 1(a) and 4(a)), the Company issued DSU Replacement Units to replace the outstanding
DSUs of Alacer. Each DSU Replacement Unit entitles the director to receive a payment in cash for the equivalent value of one common
share on the date the director ceases to be a director. The DSU Replacement Units are accounted for as financial liabilities.
The DSU Replacement Units had a fair value of C$29.63 per unit at the date of acquisition.
The
fair value of the outstanding DSUs at the end of each reporting period is recognized as an accrued liability with the associated
compensation expense recorded in share-based compensation expense. As at December 31, 2020, the fair value of outstanding
DSUs, excluding the DSU Replacement Units, was C$25.56 per unit (2019 - C$24.99 per
unit).
At December 31, 2020, financial
liabilities of $15.0 million relating to DSUs have been recognized and included in accrued liabilities (2019 - $11.8 million) (note
13).
(d) Restricted
Share Units
RSUs are granted to employees
based on the Company's common share price at the date of grant. The awards have a graded vesting schedule over a three-year period.
The terms of the plan provide the Board of Directors the discretion to elect to settle the units in either cash or shares.
To date, RSUs have been cash-settled
and, therefore, are recognized as a liability, with fair value re-measurement at each reporting period. The associated compensation
expense is recorded in share-based compensation expense over the vesting period unless directly attributable to operations, whereby
it is included in production costs, or exploration, evaluation and reclamation expense.
| SSR Mining Inc. | Financial Statements Year-End 2020 | | 50 |
SSR Mining Inc. Notes to the Consolidated Financial Statements (tabular amounts expressed in thousands of United States dollars unless otherwise stated) |
| 17. | SHARE CAPITAL AND SHARE-BASED PAYMENTS (continued) |
(d) Restricted
Share Units (continued)
The
following table summarizes the changes in RSUs outstanding during the years ended December 31, 2020 and 2019:
| |
2020 |
2019 |
| Years ended December 31 |
Number of RSUs |
Number of RSUs |
| Outstanding, beginning of year |
356,160 |
|
425,095 |
|
| Granted |
145,987 |
|
195,530 |
|
| Issued in connection with Alacer acquisition |
998,901 |
|
- |
|
| Settled |
(719,345) |
|
(200,671) |
|
| Forfeited |
(32,838) |
|
(63,794) |
|
| Outstanding, end of year |
748,865 |
|
356,160 |
|
RSUs
granted in the year ended December 31, 2020 had a weighted average fair value of C$29.34 per unit at the date of grant (2019
- C$18.14 per unit). RSUs settled in the year ended December 31, 2020 were settled
at a fair value of C$26.02 per unit (2019 - C$17.67). As at December 31, 2020,
the fair value of outstanding RSUs was C$25.56 per unit (2019 - C$24.99 per
unit).
In connection with the acquisition
of Alacer (notes 1(a) and 4(a)), the Company issued RSU Replacement Units to replace the outstanding unexercised RSUs of Alacer.
The terms of the RSU Replacement Units are similar to the Company’s existing RSUs whereby the units become payable in common
shares as they vest over the vesting period (typically three years). The Board of Directors, at its discretion, may elect to satisfy
all or part of a vesting in cash. The RSU Replacement Units were accounted for as equity instruments at the date of acquisition
as management believed that the Board of Directors had not created a valid expectation or a constructive obligation that future
settlements will be in cash. In December 2020, a portion of the units were cash-settled. At December 31, 2020, the unvested RSU
Replacement Units vesting in 2022 and 2023 were reclassified as cash-settled and accounted for as financial liabilities. RSU Replacement
units vesting in 2021 will be equity-settled and continue to be recorded in equity. The RSU Replacement Units had a fair value
of C$29.29 per unit at the date of acquisition.
At December 31, 2020, financial
liabilities of $2.3 million and $6.5 million relating to RSUs have been recognized and included in accrued liabilities (note 13)
and other non-current liabilities, respectively, in addition to an equity reserve of $0.5 million (2019 - $4.0 million included
in accrued liabilities).
(e) Performance
Share Units
PSUs are granted to senior executives,
and vest after a performance period of three years. The vesting of these awards is based on the Company's total shareholder return
in comparison to its peer group and awards vested range from 0% to 200% of initial PSUs granted. Under the terms of the Company's
2017 and 2020 Share Compensation Plans, the Board of Directors have the discretion to elect to settle PSUs in either cash or shares.
During the year ended December
31, 2019, as a result of its intention to settle its PSUs by issuing common shares, the Company classified its outstanding PSUs
as equity-settled and accordingly reclassified $1.8 million ($1.3 million, net of tax) from non-current financial liabilities to
equity. At December 31, 2020, as a result of cash settlements during the year, the Company determined it had a present obligation
to settle in cash and reclassified its outstanding unvested PSUs vesting in 2022 and 2023 as financial liabilities. As a result,
the Company reclassified $0.4 million from equity to non-current financial liabilities. PSUs vesting in 2021 will be equity-settled
and continue to be recorded in equity.
| SSR Mining Inc. | Financial Statements Year-End 2020 | | 51 |
SSR Mining Inc. Notes to the Consolidated Financial Statements (tabular amounts expressed in thousands of United States dollars unless otherwise stated) |
| 17. | SHARE CAPITAL AND SHARE-BASED PAYMENTS (continued) |
(e) Performance
Share Units (continued)
The associated compensation
cost is recorded in share-based compensation expenses.
| |
2020 |
2019 |
| Years ended December 31 |
Number of PSUs |
Number of PSUs |
| Outstanding, beginning of year |
308,500 |
|
311,100 |
|
| Granted |
222,045 |
|
144,500 |
|
| Issued in connection with Alacer acquisition |
985,489 |
|
- |
|
| Settled |
(402,198) |
|
(122,300) |
|
| Forfeited |
- |
|
(24,800) |
|
| Outstanding, end of year |
1,113,836 |
|
308,500 |
|
PSUs granted in the year
ended December 31, 2020 had a weighted average fair value of C$21.83 per unit at the date of grant (2019 - C$15.22 per unit).
PSUs settled in the year ended December 31, 2020 were settled at a value of C$27.33 per unit (2019 - C$23.43). As at December 31,
2020, the estimated weighted average fair value was C$27.14 per unit (2019 - C$39.60 per unit).
In connection with the acquisition
of Alacer (notes 1(a) and 4(a)), the Company issued PSU Replacement Units to replace the outstanding unexercised PSUs of Alacer.
Each PSU Replacement Unit entitles the participant, at the end of the applicable performance period (typically three years), to
receive a payment in cash for the equivalent value of common shares earned, provided: (i) the participant continues to be employed
or engaged by the Company or any of its affiliates; and (ii) all other terms and conditions of the grant have been satisfied, including
the performance metrics associated with each PSU Replacement Unit. The vesting of these awards is based on the Company's total
shareholder return in comparison to its peer group, actual production against budget and actual costs against budget. Awards vested
range from 0% to 200% of initial PSUs granted. The PSU Replacement Units are accounted for as financial liabilities. The PSU Replacement
Units had a fair value of C$42.14 per unit at the date of acquisition.
At December 31, 2020, financial
liabilities of $12.8 million and $7.8 million relating to PSUs have been recognized and included in accrued liabilities (note 13)
and other non-current liabilities, respectively, in addition to an equity reserve of $1.3 million (2019 - accrued liability of
3.7 million and equity reserve of $3.6 million).
(f) Share-based
compensation expense
Total share-based compensation
expense, including all equity and cash-settled arrangements, for the years ended December 31, 2020 and 2019 has been recognized
in the consolidated financial statements as follows:
| Years ended December 31 |
2020 |
2019 |
| Equity-settled |
|
|
| Production costs |
$ |
449 |
|
$ |
250 |
|
| Share-based compensation expense |
6,903 |
|
3,715 |
|
| Exploration, evaluation and reclamation expense |
43 |
|
40 |
|
| Transaction and integration expense |
1,099 |
|
- |
|
| Cash-settled |
|
|
| Production costs |
1,715 |
|
1,201 |
|
| Share-based compensation expense |
1,597 |
|
9,099 |
|
| Exploration, evaluation and reclamation expense |
126 |
|
119 |
|
| Transaction and integration expense |
3,919 |
|
- |
|
| |
$ |
15,851 |
|
$ |
14,424 |
|
| SSR Mining Inc. | Financial Statements Year-End 2020 | | 52 |
SSR Mining Inc. Notes to the Consolidated Financial Statements (tabular amounts expressed in thousands of United States dollars unless otherwise stated) |
Total
other reserves for the years ended December 31, 2020 and 2019 have been recognized in the consolidated financial statements
as follows:
| Years ended December 31 |
2020 |
2019 |
| Foreign currency translation reserve |
|
|
| Balance, beginning and end of year |
$ |
781 |
|
$ |
781 |
|
| |
|
|
| Fair value reserve |
|
|
| Balance, beginning of year |
(5,195) |
|
(37,240) |
|
| Gain on marketable securities at FVTOCI, net of tax |
19,297 |
|
29,819 |
|
| Unrealized (loss) gain on effective portion of derivative, net of tax |
(5,215) |
|
2,226 |
|
| Realized loss reclassified to net income |
4,513 |
|
- |
|
| Balance, end of year |
13,400 |
|
(5,195) |
|
| |
|
|
| Share-based compensation reserve |
|
|
| Balance, beginning of year |
52,253 |
|
49,696 |
|
| Acquisition of Alacer (notes 1(a) and 4(a)) |
15,419 |
|
- |
|
| Exercise of stock options |
(2,976) |
|
(2,804) |
|
| Settlement of RSUs and PSUs |
(15,632) |
|
- |
|
| Transfer of cash-settled RSUs and PSUs |
(4,138) |
|
- |
|
| Transfer of equity-settled PSUs |
- |
|
1,356 |
|
| Share-based compensation |
8,494 |
|
4,005 |
|
| Balance, end of year |
53,420 |
|
52,253 |
|
| |
|
|
| Other |
|
|
| Balance, beginning of year |
(28,077) |
|
(29,540) |
|
| Acquisition of non-controlling interest (note 4(b)) |
- |
|
1,463 |
|
| Other |
1,046 |
|
- |
|
| Balance, end of year |
(27,031) |
|
(28,077) |
|
| |
|
|
| Total balance, end of year |
$ |
40,570 |
|
$ |
19,762 |
|
| 19. | SUBSIDIARIES AND NON-CONTROLLING INTEREST |
The
principal subsidiaries of SSR Mining Inc. and their geographic locations at December 31, 2020 were as follows:
| Subsidiary |
Location |
Ownership interest |
Principal project or activity |
| Marigold Mining Company |
USA |
100% |
Marigold |
| Anagold |
Turkey |
80% |
Çöpler |
| SGO Mining Inc. |
Canada |
100% |
Seabee |
| Mina Pirquitas Sociedad Anonima |
Argentina |
100% |
Puna |
| SSR Durango, S.A. de C.V. |
Mexico |
100% |
Pitarrilla |
| Intertrade Metals Limited Partnership |
Canada |
100% |
Sales and marketing |
| SSR Mining Inc. | Financial Statements Year-End 2020 | | 53 |
SSR Mining Inc. Notes to the Consolidated Financial Statements (tabular amounts expressed in thousands of United States dollars unless otherwise stated) |
| 19. | SUBSIDIARIES AND NON-CONTROLLING INTEREST (continued) |
The following table summarizes
the financial information relating to Anagold, the Company's non-wholly owned subsidiary with material non-controlling interest
("NCI"), before any intercompany eliminations:
| Year ended December 31 |
|
2020 |
| Current assets |
|
$ |
442,650 |
|
| Non-current assets |
|
2,832,230 |
|
| Current liabilities |
|
(141,007) |
|
| Non-current liabilities |
|
(565,742) |
|
| Net assets |
|
2,568,131 |
|
| Net assets attributable to NCI |
|
$ |
513,626 |
|
| Year ended December 31 |
|
2020 |
| Revenue (1) |
|
$ |
205,536 |
|
| Net income (1) |
|
34,869 |
|
| Other comprehensive income (1) |
|
- |
|
| Total comprehensive income (1) |
|
34,869 |
|
| Net income attributable to NCI (1) |
|
$ |
6,974 |
|
| Total comprehensive income attributable to NCI (1) |
|
6,974 |
|
| (1) | The above information reflects the results of Anagold from the date of acquisition of Alacer on
September 16, 2020 through December 31, 2020 (note 4(a)). |
| Cash flows from operating activities (1) |
|
$ |
137,587 |
|
| Cash flows from investing activities (1) |
|
(25,261) |
|
| Cash flows from financing activities (1) |
|
(34,797) |
|
| Net increase in cash and cash equivalents (1) |
|
$ |
77,529 |
|
| (1) | The above information reflects the results of Anagold from
the date of acquisition of Alacer on September 16, 2020 through December 31, 2020 (note 4(a)). |
| Years ended December 31 |
2020 |
2019 |
| Gold bullion and doré sales |
$ |
750,457 |
|
$ |
461,463 |
|
| Concentrate sales |
105,351 |
|
144,861 |
|
| Other (1) |
(2,719) |
|
526 |
|
| |
$ |
853,089 |
|
$ |
606,850 |
|
| (1) | Other revenue includes: changes in the fair value of concentrate
trade receivables due to changes in silver and base metal prices; and silver and copper by-product revenue arising from the production
and sale of gold bullion and doré. |
| SSR Mining Inc. | Financial Statements Year-End 2020 | | 54 |
SSR Mining Inc. Notes to the Consolidated Financial Statements (tabular amounts expressed in thousands of United States dollars unless otherwise stated) |
| Years ended December 31 |
2020 |
2019 |
| Labour |
$ |
120,306 |
|
$ |
110,022 |
|
| Raw materials and consumables |
137,215 |
|
130,007 |
|
| Contractors |
58,068 |
|
42,715 |
|
| Royalties |
57,496 |
|
33,771 |
|
| Change in inventory and capitalized costs |
(340,437) |
|
(33,022) |
|
| Acquired inventories (note 4(a)) |
349,767 |
|
- |
|
| Other |
36,237 |
|
46,317 |
|
| |
$ |
418,652 |
|
$ |
329,810 |
|
Production costs for the
year ended December 31, 2020 includes $51.9 million (December 31, 2019 - nil) related to fair value adjustments on acquired inventories.
| 22. | GENERAL AND ADMINISTRATIVE EXPENSE |
| Years ended December 31 |
2020 |
2019 |
| Salaries and benefits |
$ |
16,067 |
|
$ |
11,041 |
|
| Consulting and professional fees |
4,076 |
|
2,391 |
|
| Insurance |
1,584 |
|
616 |
|
| Computer |
1,133 |
|
900 |
|
| Travel |
291 |
|
1,100 |
|
| Office and other expenses |
1,475 |
|
2,067 |
|
| |
$ |
24,626 |
|
$ |
18,115 |
|
| 23. | FINANCE INCOME AND EXPENSE |
(a) Interest
and other finance income
| Years ended December 31 |
2020 |
2019 |
| Interest income |
$ |
3,495 |
|
$ |
11,111 |
|
| Other |
3,050 |
|
799 |
|
| |
$ |
6,545 |
|
$ |
11,910 |
|
(b) Interest
expense and other finance costs
| Years ended December 31 |
2020 |
2019 |
| Interest expense on debt (note 14) |
$ |
19,916 |
|
$ |
23,049 |
|
| Accretion of reclamation and closure cost provision (note 15) |
3,887 |
|
3,743 |
|
| Other |
2,984 |
|
4,806 |
|
| |
$ |
26,787 |
|
$ |
31,598 |
|
| SSR Mining Inc. | Financial Statements Year-End 2020 | | 55 |
SSR Mining Inc. Notes to the Consolidated Financial Statements (tabular amounts expressed in thousands of United States dollars unless otherwise stated) |
The
calculations of basic and diluted income per share attributable to equity holders of SSR Mining for the years ended December 31,
2020 and 2019 are based on the following:
| |
|
|
| Years ended December 31 |
2020 |
2019 |
| Net income |
$ |
140,468 |
|
$ |
55,757 |
|
| Net (income) loss attributable to non-controlling interest |
(6,974) |
|
1,558 |
|
| Net income attributable to equity holders of SSR Mining |
133,494 |
|
57,315 |
|
| Adjustment for dilutive instruments |
|
|
| Interest saving on convertible notes, net of tax |
9,868 |
|
- |
|
| Net income used in the calculation of diluted net income per share |
$ |
143,362 |
|
$ |
57,315 |
|
| |
|
|
| Weighted average number of common shares issued |
151,144 |
|
121,769 |
|
| Adjustments for dilutive instruments: |
|
|
| Stock options |
752 |
|
892 |
| Performance share units |
93 |
|
- |
|
| Restricted share units |
3 |
|
- |
|
| Convertible notes |
12,445 |
|
- |
|
| Diluted weighted average number of shares outstanding |
164,437 |
|
122,661 |
|
| |
|
|
| Net income per share attributable to equity holders of SSR Mining |
|
|
| Basic |
$0.88 |
$0.47 |
| Diluted |
$0.87 |
$0.47 |
Operating results of operating
segments are reviewed by the Company's chief operating decision maker ("CODM") to make decisions about resources to be
allocated to the segments and to assess their performance. Each individual operating mine site is considered to be a reportable
operating segment for financial reporting purposes.
In connection with the acquisition
of Alacer, the Company added Çöpler as a new operating segment for the year ended December 31, 2020. Çöpler
is an operating mine site, therefore it is considered a reportable segment for financial reporting purposes.
| SSR Mining Inc. | Financial Statements Year-End 2020 | | 56 |
SSR Mining Inc. Notes to the Consolidated Financial Statements (tabular amounts expressed in thousands of United States dollars unless otherwise stated) |
| 25. | OPERATING SEGMENTS (continued) |
The following is a summary
of the reported amounts of income from mine operations, operating income (loss), income (loss) before income taxes and the carrying
amounts of assets and liabilities by operating segment:
| Year ended and at December 31, 2020 |
Çöpler (1) |
Marigold |
Seabee |
Puna (2) |
Exploration, evaluation and development properties |
Other reconciling items (3) |
Total |
| Revenue |
$ |
205,536 |
|
$ |
409,798 |
|
$ |
135,230 |
|
$ |
102,525 |
|
$ |
- |
|
$ |
- |
|
$ |
853,089 |
|
| Production costs |
(120,618) |
|
(196,409) |
|
(41,308) |
|
(60,317) |
|
- |
|
- |
|
(418,652) |
|
| Depletion and depreciation |
(34,053) |
|
(47,844) |
|
(28,233) |
|
(15,665) |
|
- |
|
- |
|
(125,795) |
|
| Cost of sales |
(154,671) |
|
(244,253) |
|
(69,541) |
|
(75,982) |
|
- |
|
- |
|
(544,447) |
|
| Income from mine operations |
50,865 |
|
165,545 |
|
65,689 |
|
26,543 |
|
- |
|
- |
|
308,642 |
|
| |
|
|
|
|
|
|
|
| Exploration, evaluation and reclamation (expense) recovery |
(3,558) |
|
(2,462) |
|
(6,108) |
|
2,144 |
|
(11,874) |
|
(539) |
|
(22,397) |
|
| Care and maintenance expense (4) |
- |
|
- |
|
(13,643) |
|
(15,950) |
|
- |
|
- |
|
(29,593) |
|
| Transaction and integration expense |
- |
|
- |
|
- |
|
- |
|
- |
|
(20,813) |
|
(20,813) |
|
| Operating income (loss) |
47,213 |
|
162,648 |
|
45,811 |
|
11,222 |
|
(11,874) |
|
(52,307) |
|
202,713 |
|
| Income (loss) before income tax |
41,253 |
|
159,641 |
|
46,304 |
|
(2,410) |
|
(12,678) |
|
(50,789) |
|
181,321 |
|
| As at December 31, 2020 |
|
|
|
|
|
|
|
| Total assets |
$ |
2,486,927 |
|
$ |
642,106 |
|
$ |
455,249 |
|
$ |
241,079 |
|
$ |
1,038,498 |
|
$ |
381,127 |
|
$ |
5,244,986 |
|
| Non-current assets |
2,030,998 |
|
277,196 |
|
311,552 |
|
143,694 |
|
1,036,507 |
|
20,517 |
|
3,820,464 |
|
| Total liabilities |
(735,225) |
|
(121,328) |
|
(90,780) |
|
(50,130) |
|
(29,710) |
|
(277,910) |
|
(1,305,083) |
|
| Year ended and at December 31, 2019 |
Marigold |
Seabee |
Puna (2) |
Exploration, evaluation and development properties |
Other reconciling items (3) |
Total |
| Revenue |
$ |
315,320 |
|
$ |
146,141 |
|
$ |
145,389 |
|
$ |
- |
|
$ |
- |
|
$ |
606,850 |
|
| Production costs |
(183,782) |
|
(48,470) |
|
(97,558) |
|
- |
|
- |
|
(329,810) |
|
| Depletion and depreciation |
(52,291) |
|
(36,368) |
|
(17,498) |
|
- |
|
- |
|
(106,157) |
|
| Cost of sales |
(236,073) |
|
(84,838) |
|
(115,056) |
|
- |
|
- |
|
(435,967) |
|
| Income from mine operations |
79,247 |
|
61,303 |
|
30,333 |
|
- |
|
- |
|
170,883 |
|
| |
|
|
|
|
|
|
| Exploration, evaluation and reclamation expense |
(4,139) |
|
(8,511) |
|
(818) |
|
(3,501) |
|
(647) |
|
(17,616) |
|
| Operating income (loss) |
73,829 |
|
52,371 |
|
27,578 |
|
(3,549) |
|
(27,891) |
|
122,338 |
|
| Income (loss) before income tax |
58,269 |
|
40,851 |
|
12,652 |
|
(2,937) |
|
(22,706) |
|
86,129 |
|
| |
|
|
|
|
|
|
| Total assets |
$ |
524,113 |
|
$ |
484,750 |
|
$ |
270,633 |
|
$ |
115,191 |
|
$ |
355,420 |
|
$ |
1,750,107 |
|
| Non-current assets |
249,962 |
|
310,578 |
|
155,049 |
|
114,327 |
|
20,529 |
|
850,445 |
|
| Total liabilities |
(119,413) |
|
(97,131) |
|
(70,676) |
|
(6,216) |
|
(322,717) |
|
(616,153) |
|
| (1) | The reported statements of income amounts reflect results
from the date of acquisition of Alacer on September 16, 2020 through December 31, 2020 (note 4(a)). |
| (2) | Cost of sales at Puna include a write-down of metal inventories
to NRV of $8.6 million for the year ended December 31, 2020 (December 31, 2019 - $3.6 million). |
| (3) | Other reconciling items refer to items that are not reported
as part of segment performance as they are managed on a corporate basis. |
| SSR Mining Inc. | Financial Statements Year-End 2020 | | 57 |
SSR Mining Inc. Notes to the Consolidated Financial Statements (tabular amounts expressed in thousands of United States dollars unless otherwise stated) |
| 25. | OPERATING SEGMENTS (continued) |
| (4) | On March 20, 2020 and March 25, 2020, due to the COVID-19
pandemic, the Company temporarily suspended operations at Puna and Seabee, respectively. From and after such dates, the Company
continued to perform care and maintenance activities and incurred incremental costs as a result. These incremental costs do not
relate to producing or selling metal concentrate or gold, and therefore they have been identified and presented separately within
operating income (loss). |
Revenue
by metal
Çöpler,
Marigold and Seabee produce gold in doré form. Doré is unrefined gold bullion bars usually consisting of in excess
of 90% gold that is refined to pure gold bullion. The Company mainly sells gold bullion to customers, which are typically bullion
banks. Puna produces silver-lead and zinc concentrates, which are sold to smelters or traders for further refining. During 2020,
revenues from two customers included within the Marigold and Seabee operating segments accounted for 45% and 14% (2019 - 37% and
17%) of the Company's total revenues, respectively, and revenues from one customer included within the Çöpler operating
segment accounted for 24% (2019 - nil) of the Company's total revenues. The following table provides a summary of revenue by metal:
| Years ended December 31 |
2020 |
2019 |
| Gold |
88 |
% |
76 |
% |
| Silver |
10 |
% |
19 |
% |
| Lead |
1 |
% |
3 |
% |
| Zinc |
1 |
% |
2 |
% |
| |
100 |
% |
100 |
% |
Non-current
assets
The following table provides
a summary of non-current assets, excluding financial instruments and deferred income taxes, by location:
| At December 31 |
2020 |
2019 |
| Turkey |
$ |
2,902,093 |
|
$ |
- |
|
| Canada |
323,599 |
|
326,272 |
|
| United States |
318,036 |
|
285,686 |
|
| Argentina |
143,695 |
|
154,986 |
|
| Mexico |
67,677 |
|
67,160 |
|
| Peru |
11,244 |
|
607 |
|
| |
$ |
3,766,344 |
|
$ |
834,711 |
|
Impairment
assessment - Puna
At
December 31, 2019, the Company performed an assessment of Puna to identify indicators of potential impairment. The Company determined
that there was an indicator of potential impairment on the $141.9 million carrying amount of Puna, which resulted in the Company
assessing the recoverable amount of the CGU. The recoverable amount of the Puna CGU was determined to be the FVLCTD, which is based
upon the estimated future after-tax cash flows of the CGU. The cash flows were determined based on cash flow projections over the
projection period of 2020 to 2026, which incorporate management's estimates of metal prices, production based on current estimates
of Mineral Reserves and future operating costs and capital expenditures. The Company used a long-term silver price of $17.81 per
ounce in the cash flow projections, based on market consensus forecasts. Projected cash flows under the FVLCTD model are after-tax
and discounted at 9.3% using the Company's estimated weighted average cost of capital adjusted for project and country specific
risks. The Company concluded that the FVLCTD exceeded the carrying amount of the Puna CGU and therefore, no impairment was required.
Additionally, the Company performed a sensitivity analysis over the inputs determined to be most sensitive within the FVLCTD model.
The average silver price would have had to decrease by more than approximately 15.0% for Puna to be impaired.
| SSR Mining Inc. | Financial Statements Year-End 2020 | | 58 |
SSR Mining Inc. Notes to the Consolidated Financial Statements (tabular amounts expressed in thousands of United States dollars unless otherwise stated) |
| 26. | FINANCIAL INSTRUMENTS AND FAIR VALUE MEASUREMENTS |
The Company's financial instruments
include cash and cash equivalents, marketable securities, trade receivables, restricted cash, other current and non-current financial
assets, trade and other payables, debt, lease liabilities, and derivative liabilities.
(a) Financial
assets and liabilities by category
| At December 31, 2020 |
Amortized cost |
FVTPL |
FVTOCI (1) |
Total |
| Financial assets |
|
|
|
|
| Cash and cash equivalents (note 5) |
$ |
860,637 |
|
$ |
- |
|
$ |
- |
|
$ |
860,637 |
|
| Marketable securities (note 6) |
- |
|
- |
|
26,748 |
|
26,748 |
|
| Trade receivables (2) (note 7) |
- |
|
38,456 |
|
- |
|
38,456 |
|
| Restricted cash (note 10) |
35,288 |
|
- |
|
- |
|
35,288 |
|
| Other current and non-current financial assets |
5,228 |
|
10,991 |
|
- |
|
16,219 |
|
| Total financial assets |
$ |
901,153 |
|
$ |
49,447 |
|
$ |
26,748 |
|
$ |
977,348 |
|
| |
|
|
|
|
| Financial liabilities |
|
|
|
|
| Trade and other payables |
$ |
125,004 |
|
$ |
- |
|
$ |
- |
|
$ |
125,004 |
|
| Debt (note 14) |
390,670 |
|
- |
|
- |
|
390,670 |
|
| Lease liabilities (note 16) |
122,715 |
|
- |
|
- |
|
122,715 |
|
| Derivative liabilities |
- |
|
3,881 |
|
- |
|
3,881 |
|
| Total financial liabilities |
$ |
638,389 |
|
$ |
3,881 |
|
$ |
- |
|
$ |
642,270 |
|
| At December 31, 2019 |
Amortized cost |
FVTPL |
FVTOCI (1) |
Total |
| Financial assets |
|
|
|
|
| Cash and cash equivalents (note 5) |
$ |
503,647 |
|
$ |
- |
|
$ |
- |
|
$ |
503,647 |
|
| Marketable securities (note 6) |
- |
|
- |
|
66,453 |
|
66,453 |
|
| Trade receivables (2) (note 7) |
- |
|
54,164 |
|
- |
|
54,164 |
|
| Restricted cash (note 10) |
2,339 |
|
- |
|
- |
|
2,339 |
|
| Other current and non-current financial assets |
13,337 |
|
2,288 |
|
1,000 |
|
16,625 |
|
| Total financial assets |
$ |
519,323 |
|
$ |
56,452 |
|
$ |
67,453 |
|
$ |
643,228 |
|
| |
|
|
|
|
| Financial liabilities |
|
|
|
|
| Trade and other payables |
$ |
74,836 |
|
$ |
- |
|
$ |
- |
|
$ |
74,836 |
|
| Debt (note 14) |
284,049 |
|
- |
|
- |
|
$ |
284,049 |
|
| Lease liabilities (note 16) |
3,792 |
|
- |
|
- |
|
$ |
3,792 |
|
| Total financial liabilities |
$ |
362,677 |
|
$ |
- |
|
$ |
- |
|
$ |
362,677 |
|
| (1) | Investments in equity securities were designated as FVTOCI
upon initial recognition as the management of the equity securities is not considered to be part of the Company's core operations.
Securities in the portfolio are disposed of when they no longer meet the Company's long-term investment strategy. |
| (2) | Trade receivables are classified as FVTPL due to the derivative
identified through provisional pricing arrangements discussed in note 2(o). |
| SSR Mining Inc. | Financial Statements Year-End 2020 | | 59 |
SSR Mining Inc. Notes to the Consolidated Financial Statements (tabular amounts expressed in thousands of United States dollars unless otherwise stated) |
| 26. | FINANCIAL INSTRUMENTS AND FAIR VALUE MEASUREMENTS (continued) |
(b) Fair
value of financial instruments
Fair values of financial assets
and liabilities measured at fair value
The
categories of the fair value hierarchy that reflect the significance of inputs used in making fair value measurements are as follows:
Level
1 - quoted prices in active markets for identical assets or liabilities;
Level
2 - inputs other than quoted prices included in Level 1 that are observable for the asset or liability, either directly (i.e.,
as prices) or indirectly (i.e., derived from prices); and
Level
3 - inputs for the asset or liability that are not based on observable market data.
The
levels in the fair value hierarchy into which the Company's financial assets and liabilities that are measured and recognized on
the consolidated statements of financial position at fair value on a recurring basis were categorized as follows:
| |
Fair value at December 31, 2020 |
| |
Level 1 (1) |
Level 2 (2) |
Level 3 (3) |
Total |
| Marketable securities (note 6) |
$ |
26,748 |
|
$ |
- |
|
$ |
- |
|
$ |
26,748 |
|
| Trade receivables (note 7) |
- |
|
38,456 |
|
- |
|
38,456 |
|
| Other financial assets |
- |
|
1,243 |
|
9,748 |
|
10,991 |
|
| Derivative liabilities |
- |
|
(3,881) |
|
- |
|
(3,881) |
|
| |
$ |
26,748 |
|
$ |
35,818 |
|
$ |
9,748 |
|
$ |
72,314 |
|
| |
Fair value at December 31, 2019 |
| |
Level 1 (1) |
Level 2 (2) |
Level 3 (3) |
Total |
| Marketable securities (note 6) |
$ |
66,453 |
|
$ |
- |
|
$ |
- |
|
$ |
66,453 |
|
| Trade receivables (note 7) |
- |
|
54,164 |
|
- |
|
54,164 |
|
| Other financial assets |
- |
|
2,641 |
|
647 |
|
3,288 |
|
| |
$ |
66,453 |
|
$ |
56,805 |
|
$ |
647 |
|
$ |
123,905 |
|
| (1) | Marketable securities of publicly quoted companies, consisting of FVTOCI investments, are valued
using a market approach based upon unadjusted quoted prices in an active market obtained from securities exchanges. |
| (2) | Trade receivables relating to sales of concentrate are included in Level 2 as the basis of valuation
uses quoted commodity forward prices. Derivative assets and liabilities are included in Level 2 as the basis of valuation uses
quoted prices in active markets. |
| (3) | Certain items of deferred consideration from the sale of exploration and evaluation assets are
included in Level 3, as certain assumptions used in the calculation of the fair value are not based on observable market data. |
During
the years ended December 31, 2020 and 2019, no amounts were transferred between Levels.
| SSR Mining Inc. | Financial Statements Year-End 2020 | | 60 |
SSR Mining Inc. Notes to the Consolidated Financial Statements (tabular amounts expressed in thousands of United States dollars unless otherwise stated) |
| 26. | FINANCIAL INSTRUMENTS AND FAIR VALUE MEASUREMENTS (continued) |
(b) Fair
value of financial instruments (continued)
Fair values
of financial assets and liabilities not already measured at fair value
As at December 31, 2020,
the fair value of the 2019 Notes and Term Loan as compared to the carrying amounts were as follows:
| |
|
December 31, 2020 |
December 31, 2019 |
| |
Level |
Carrying amount |
Fair value |
Carrying amount |
Fair value |
| 2013 Notes (1) |
1 |
$ |
- |
|
$ |
- |
|
$ |
(114,280) |
|
$ |
(116,581) |
|
| 2019 Notes (1) |
1 |
(177,582) |
|
(317,538) |
|
(169,769) |
|
(297,735) |
|
| Term Loan |
3 |
(210,000) |
|
(221,943) |
|
- |
|
- |
|
| Total borrowings |
|
$ |
(387,582) |
|
$ |
(539,481) |
|
$ |
(284,049) |
|
$ |
(414,316) |
|
| (1) | The fair value disclosed for the Company's 2013 Notes and 2019 Notes is included in Level 1 as
the basis of valuation uses a quoted price in an active market. The carrying amount of such convertible notes represents the debt
component of the convertible notes, while the fair value represents both the debt and equity components of the convertible notes
(see note 14(a)). |
| 27. | FINANCIAL RISK MANAGEMENT |
The
Company is exposed to a variety of financial risks as a result of its operations, including market risk (which includes price risk,
currency risk and interest rate risk), credit risk, liquidity risk and capital risk. The Company's overall risk management strategy
seeks to reduce potential adverse effects on its financial performance. Risk management is carried out under policies approved
by the Board of Directors.
The
Company may, from time to time, use foreign exchange contracts, commodity price contracts, equity hedges and interest rate swaps
to manage its exposure to fluctuations in foreign currency, metal and energy prices, marketable securities values and interest
rates, which are subject to the oversight of its Board of Directors. The Company does not have a practice of trading derivatives.
The
risks associated with the Company's financial instruments, and the policies on how the Company mitigates those risks are set out
below. This is not intended to be a comprehensive discussion of all risks. There were no significant changes to the Company's exposures
to these risks or the management of its exposures during the year ended December 31, 2020, except as noted below.
(a) Market
Risk
This
is the risk that the fair values of financial instruments will fluctuate due to changes in market prices. The significant market
risks to which the Company is exposed are price risk, currency risk and interest rate risk.
This
is the risk that the fair values or future cash flows of the Company's financial instruments will fluctuate because of changes
in market prices. Income from mine operations depends on metal prices for gold, silver, lead and zinc and also prices of input
commodities such as diesel which are affected by numerous factors that are outside of the Company's control.
The
Company has not hedged the price of any metal as part of its overall corporate strategy.
| SSR Mining Inc. | Financial Statements Year-End 2020 | | 61 |
SSR Mining Inc. Notes to the Consolidated Financial Statements (tabular amounts expressed in thousands of United States dollars unless otherwise stated) |
| 27. | FINANCIAL RISK MANAGEMENT (continued) |
(a) Market
Risk (continued)
| (i) | Price Risk (continued) |
The
Company's concentrate metal sales agreements are subject to pricing terms that settle within one to four months after delivery
of concentrate. This adjustment period represents the Company's exposure to commodity price risk on its trade receivables. A 10%
increase or decrease in the silver price as at December 31, 2020, with all other variables held constant, would have resulted
in a $3.0 million increase or decrease to the Company's after-tax net income, respectively.
As
the Company does not have trade receivables relating to gold sales, changes in gold prices do not impact the value of its financial
instruments.
The
costs relating to the Company's production activities vary depending on market prices on consumables, including diesel fuel and
electricity. The Company hedges a portion of its future cash flows relating to diesel consumption through swap and option contracts
within limits set under a risk management policy approved by the Board of Directors to manage its exposure to fluctuations in diesel
prices. In addition, due to the ice road supply at Seabee, the Company purchases annual consumable supplies in advance at prices
which are generally fixed at the time of purchase, and not during period of use.
During
the year ended December 31, 2020, in accordance with its risk management policy, the Company used swaps and options to hedge
a portion of its diesel costs at Marigold and Seabee and recognized an unrealized loss of $1.2 million in OCI and a realized loss
of $4.1 million in the consolidated statements of income (2019 - unrealized gain of $1.2 million in OCI).
Marigold
The
following table summarizes the financial information relating to the future anticipated diesel consumption at Marigold that the
Company has hedged as at December 31, 2020:
| |
2021 |
2022 |
| Gallons hedged (in thousands) |
10,440 |
|
1,380 |
|
| Portion of forecast diesel consumption hedged (%) |
89.2 |
|
12.7 |
|
| Floor price ($/gallon) (1) |
1.54 |
|
1.48 |
|
| Cap price ($/gallon) (1) |
1.91 |
|
1.80 |
|
| (1) | Based on the U.S. Gulf Coast Ultra-Low Sulfur Diesel Index. |
As
at December 31, 2020, the spot price of diesel was $1.43 per gallon.
Seabee
The
following table summarizes the financial information relating to the future anticipated diesel consumption at Seabee that the Company
has hedged as at December 31, 2020:
| |
|
2021 |
| Litres hedged (in thousands) |
|
3,560 |
|
| Portion of forecast diesel consumption hedged (%) |
|
94.9 |
|
| Floor price ($/litre) (1) |
|
0.43 |
|
| Cap price ($/litre)(1) |
|
0.48 |
|
| (1) | Based on the NYMEX Heating Oil Ultra-Low Sulphur Diesel Index. |
As
at December 31, 2020, the spot price of diesel was $0.39 per litre.
| SSR Mining Inc. | Financial Statements Year-End 2020 | | 62 |
SSR Mining Inc. Notes to the Consolidated Financial Statements (tabular amounts expressed in thousands of United States dollars unless otherwise stated) |
| 27. | FINANCIAL RISK MANAGEMENT (continued) |
(a) Market
Risk (continued)
| (i) | Price Risk (continued) |
As
at December 31, 2020, the fair value of the Company's derivative instruments relating to diesel hedges at Marigold and Seabee
was $2.0 million, $1.9 million and $0.1 million of which are included in accounts payable and accrued liabilities and other non-current
liabilities, respectively, in the consolidated statements of financial position (2019 - $0.3 million included in accounts payable
and accrued liabilities).
As
at December 31, 2020, the Company has not hedged future anticipated diesel consumption at Puna or Çöpler.
If and when it is determined to be favorable, the Company may execute additional diesel fuel
hedges under its risk management policy.
Marketable Securities
The
Company holds certain investments in marketable securities which are measured at fair value, being the closing share price of each
equity investment at the balance sheet date. The Company is exposed to changes in share prices which would result in gains and
losses being recognized in OCI. A 10% change in prices as at December 31, 2020 would have resulted in a $2.3 million increase
or decrease in the Company's total comprehensive income for the year ended December 31, 2020.
The
Company did not hedge any securities in 2020 or 2019.
Currency
risk is the risk that the fair values or future cash flows of the Company's financial instruments will fluctuate because of changes
in foreign exchange rates. Exchange rate fluctuations affect the costs the Company incurs at its operations. Gold, silver, lead
and zinc are sold in USD and the Company's costs are principally in USD, Turkish lira ("TRY"), CAD and Argentine pesos
("ARS"). The appreciation or depreciation of foreign currencies against the USD can increase or decrease the cost of
metal production and capital expenditures in USD terms. The Company is also exposed to currency risk arising from cash, cash equivalents
and restricted cash held in foreign currencies, marketable securities, accounts receivable and other financial assets, trade and
other payables, lease liabilities, other financial liabilities, and income and other taxes receivable (payable) denominated in
foreign currencies, Further, the Company is exposed to currency risk through non-monetary assets and liabilities and tax bases
of assets, liabilities and losses of entities whose taxable profit or tax loss are denominated in foreign currencies. Changes in
exchange rates give rise to temporary differences resulting in a deferred tax liability or asset with the resulting deferred tax
charged or credited to income tax expense, respectively.
Effective
September 2, 2019, Argentina introduced new Central Bank regulations which require export proceeds to be converted into ARS within
five business days of such proceeds entering the country. These provisions were intended to be temporary until December 31, 2019;
however, the provisions remained in effect as at December 31, 2020. While these provisions remain in effect, the Company is
unable to hold funds in Argentina in USD, which may increase its exposure to the ARS, depending on the overall cash position within
the country, which is currently minimal.
| SSR Mining Inc. | Financial Statements Year-End 2020 | | 63 |
SSR Mining Inc. Notes to the Consolidated Financial Statements (tabular amounts expressed in thousands of United States dollars unless otherwise stated) |
| 27. | FINANCIAL RISK MANAGEMENT (continued) |
(a) Market
Risk (continued)
| (ii) | Currency Risk (continued) |
At
December 31, 2020, the Company was primarily exposed to currency risk through the following financial assets and liabilities
denominated in foreign currencies:
| |
December 31, 2020 |
| |
TRY |
CAD |
ARS |
| Financial assets |
|
|
|
| Cash and cash equivalents |
$ |
1,435 |
|
$ |
4,556 |
|
$ |
3,325 |
|
| Marketable securities |
- |
|
25,235 |
|
- |
|
| Accounts receivable and other financial assets (1) |
11,395 |
|
363 |
|
2,670 |
|
| Financial liabilities |
|
|
|
| Trade and other payables |
(33,904) |
|
(39,445) |
|
(8,576) |
|
| Lease liabilities (1) |
(6,389) |
|
(3,284) |
|
- |
|
| Other financial liabilities |
(3,195) |
|
(13,933) |
|
(3) |
|
| |
$ |
(30,658) |
|
$ |
(26,508) |
|
$ |
(2,584) |
|
| |
December 31, 2019 |
| |
TRY |
CAD |
ARS |
| Financial assets |
|
|
|
| Cash and cash equivalents |
$ |
- |
|
$ |
4,786 |
|
$ |
146 |
|
| Marketable securities |
|
65,586 |
|
- |
|
|
Accounts receivable and other financial assets (1)
|
- |
|
- |
|
1,250 |
|
| Financial liabilities |
|
|
|
| Trade and other payables |
- |
|
(26,695) |
|
(13,411) |
|
| Lease liabilities(1) |
- |
|
(3,679) |
|
- |
|
| Other financial liabilities |
- |
|
- |
|
- |
|
| |
$ |
- |
|
$ |
39,998 |
|
$ |
(12,015) |
|
| (1) | Includes current and non-current portion. |
The Company assessed the impact
of a 10% change in the USD exchange rate relative to the TRY and CAD and a 25% change in the USD exchange rate relative to the
ARS as at December 31, 2020 on the Company's net income based on the above net financial assets and liabilities. As at December 31,
2020, depreciation of the TRY, CAD, and ARS against the USD would have resulted in an increase to the Company's total comprehensive
income as follows:
| Year ended December 31 |
|
2020 |
| TRY |
|
$ |
2,453 |
|
| CAD |
|
1,935 |
|
| ARS |
|
485 |
|
| SSR Mining Inc. | Financial Statements Year-End 2020 | | 64 |
SSR Mining Inc. Notes to the Consolidated Financial Statements (tabular amounts expressed in thousands of United States dollars unless otherwise stated) |
| 27. | FINANCIAL RISK MANAGEMENT (continued) |
(a) Market
Risk (continued)
| (ii) | Currency Risk (continued) |
During
the year ended December 31, 2020, in accordance with its risk management policy, the Company entered into CAD/USD foreign
currency hedges to manage the foreign currency exposure at Seabee and recognized an unrealized gain of $0.5 million in OCI and
a realized loss of $0.4 million in the consolidated statements of income (2019 - unrealized gain of $1.0 million in OCI).
As
at December 31, 2020, the Company had the following hedge positions outstanding:
| |
2021 |
2022 |
| Notional amount (in thousands of CAD) |
24,957 |
|
9,000 |
|
| Portion of forecast exposure hedged (%) |
33.9 |
|
11.9 |
|
| Floor level (CAD per 1 USD) |
1.32 |
|
1.35 |
|
| Cap level (CAD per 1 USD) |
1.38 |
|
1.42 |
|
As
at December 31, 2020, the fair value of derivative instruments related to the Company's foreign currency hedges was $1.2 million,
$0.8 million and $0.5 million of which are included in other current and non-current assets, respectively, in the consolidated
statements of financial position (2019 - $0.4 million included in other current assets).
The
Company has not hedged its foreign currency exposure to the TRY or ARS.
Interest
rate risk is the risk that the fair values or future cash flows of the Company's financial instruments will fluctuate because of
changes in market interest rates. The Company manages interest rate risk by maintaining an investment policy for short-term investments
and cash held in banks, which focuses on preservation of capital and liquidity. As at December 31, 2020, the Company is exposed
to interest rate cash flow risk arising from its cash and restricted cash in bank accounts that earn variable interest rates, and
interest expense on variable rate borrowings. The Company's variable rate borrowings are comprised of the Term Loan, which is subject
to a variable interest rate of LIBOR plus 3.50% to 3.70%,
and the Credit Facility, which is subject to a variable interest rate of LIBOR plus 2.25% to 3.75%.
Future
net cash flows from interest income on cash, restricted cash, and interest expense on variable rate borrowings will be affected
by interest rate fluctuations. To mitigate exposures to interest rate risk, the Company may purchase short-term investments at
market interest rates that result in fixed yields to maturity.
The
Company holds interest rate swaps to limit exposure to the impact of the variable LIBOR interest rate volatility. As at December 31,
2020, approximately 37% of the outstanding Term Loan balance is covered through interest rate swap contracts through the duration
of the interest rate hedge program, ending in December 2021 (note 14(b)). As at December 31, 2020, the fair value of the interest
rate swaps was $1.9 million included in accounts payable and accrued liabilities in the consolidated statements of financial position
(2019 - nil).
As at December 31, 2020, a
1.0% increase or decrease in the LIBOR interest rate, assuming all other variables remained constant and assuming no effect from
the interest rate swap contract, would decrease or increase the Company's after-tax net income for the year ended December 31,
2020 by $0.4 million.
| SSR Mining Inc. | Financial Statements Year-End 2020 | | 65 |
SSR Mining Inc. Notes to the Consolidated Financial Statements (tabular amounts expressed in thousands of United States dollars unless otherwise stated) |
| 27. | FINANCIAL RISK MANAGEMENT (continued) |
(a) Market
Risk (continued)
| (iii) | Interest Rate Risk (continued) |
As at December 31, 2020,
the weighted average interest rate earned on the Company's cash and cash equivalents was 0.16% (2019 - 1.8%). With other variables
unchanged, a 1.0% change in the annualized interest rate would impact the Company's after-tax net income for the year ended December 31,
2020 by $4.0 million (2019 - $3.3 million).
As
at December 31, 2020, the Company is exposed to interest rate fair value risk on the 2019 Notes which is subject to a fixed
interest rate. A change in interest rates would impact the fair value of the 2019 Notes (note 26(b)). However, as the 2019 Notes
are measured at amortized cost, there would be no impact on the Company's financial results.
(b) Credit
Risk
Credit
risk is the risk that the counterparty to a financial instrument will cause a financial loss for the Company by failing to discharge
its obligations under the terms of the financial contract. The Company's credit risk is limited to the following instruments:
| (i) | Credit risk related to financial institutions and cash
deposits |
Credit
risk related to financial institutions and cash deposits is managed by diversifying cash and cash equivalents and restricted cash
holdings among various financial institutions and by investing those holdings in diverse investment types including short term
investment grade securities and money market fund holdings, including bankers’ acceptances, guaranteed investment contracts,
corporate commercial paper, and United States treasury bills and notes in accordance with the Company’s investment policy.
Investment objectives are primarily directed towards preservation of capital and liquidity. The investment policy provides limitations
on concentrations of credit risk, credit quality, and the duration of investments, as well as minimum rating requirements for banks
and financial institutions that hold the Company’s cash and cash equivalents and restricted cash.
| (ii) | Credit risk related to trade receivables |
The
Company is exposed to credit risk through its trade receivables on concentrate sales, which are principally with internationally-recognized
counterparties. Payments of receivables are scheduled, routine and received within a contractually agreed time frame. The Company
manages this risk through provisional payments of approximately 75% of the value of the concentrate shipped and through transacting
with multiple counterparties.
| (iii) | Credit risk related to other financial assets and VAT
receivables |
The
Company's credit risk with respect to other financial assets includes deferred consideration in connection with the sales of certain
mineral properties. The Company has security related to these payments in the event of default.
The
Company is exposed to credit risk through its value-added tax ("VAT") receivables and other receivables that are collectible
from the governments of Turkey and Argentina. With respect to VAT in Turkey, the balance is expected to be recoverable in full.
With respect to VAT in Argentina, the balance is expected to be recoverable in full; however, due to legislative rules and the
complex collection process, a portion of the asset is classified as non-current until government approval of the recovery claim
is approved. Management monitors its exposure to credit risk on a continual basis.
| SSR Mining Inc. | Financial Statements Year-End 2020 | | 66 |
SSR Mining Inc. Notes to the Consolidated Financial Statements (tabular amounts expressed in thousands of United States dollars unless otherwise stated) |
| 27. | FINANCIAL RISK MANAGEMENT (continued) |
(b) Credit
Risk (continued)
| (iii) | Credit risk related to other financial assets and VAT
receivables (continued) |
The
Company's maximum exposure to credit risk as at December 31, 2020 and December 31, 2019 was as follows:
| |
December 31, 2020 |
December 31, 2019 |
| Cash and cash equivalents |
$ |
860,637 |
|
$ |
503,647 |
|
| Trade receivables |
38,456 |
|
54,164 |
|
| Value added tax receivable |
30,279 |
|
21,416 |
|
| Restricted cash |
35,288 |
|
2,339 |
|
| Other current and non-current financial assets |
16,219 |
|
15,625 |
|
| |
$ |
980,879 |
|
$ |
597,191 |
|
At
December 31, 2020, no amounts were held as collateral except those discussed above related to other financial assets.
(c) Liquidity
Risk
Liquidity
risk is the risk that the Company will not be able to meet its obligations associated with financial liabilities as they fall due.
The Company manages its liquidity risk through a rigorous planning, budgeting and forecasting process, which is reviewed and updated
on a regular basis, to help determine the funding requirements to support its current operations, expansion and development plans,
and by managing its capital structure as described in note 27(d). The Company's objective is to ensure that there are sufficient
committed financial resources to meet its business requirements for a minimum of twelve months.
To
supplement corporate liquidity, the Company has the Credit Facility (note 14(c)) available for reclamation bonding, working capital
and other general corporate purposes, of which it has utilized $0.7 million as at December 31, 2020 (2019 - $0.6 million).
In
addition, the Company uses surety bonds to support certain environmental bonding obligations. As at December 31, 2020, the
Company had surety bonds totaling $117.5 million outstanding (2019 - $84.4 million).
The
Company enters into contracts in the normal course of business that give rise to commitments for future minimum payments. The following
table summarizes the remaining contractual maturities of the Company's financial liabilities, operating and capital commitments,
shown in contractual undiscounted cash flows:
| |
Payments due by period (as at December 31, 2020) |
| |
Less than one year |
1 - 3 years |
4-5 years |
After 5 years |
Total |
| Accounts payable and accrued liabilities |
$ |
123,534 |
|
$ |
- |
|
$ |
- |
|
$ |
- |
|
$ |
123,534 |
|
| Convertible notes (principal portion) (note 14(a)) |
- |
|
- |
|
- |
|
230,000 |
|
230,000 |
|
| Term Loan and other debt (principal portion (note 14(b)) |
71,025 |
|
142,063 |
|
- |
|
- |
|
213,088 |
|
| Interest payments on debt (notes 14(a) and 14(b)) |
12,840 |
|
17,585 |
|
11,500 |
|
2,875 |
|
44,800 |
|
| Lease liabilities |
12,452 |
|
21,376 |
|
19,522 |
|
133,049 |
|
186,399 |
|
| Derivative liabilities |
3,764 |
|
117 |
|
- |
|
- |
|
3,881 |
|
| Reclamation and closure costs |
1,840 |
|
13,248 |
|
2,064 |
|
122,290 |
|
139,442 |
|
| Operating expenditure commitments |
2,900 |
|
752 |
|
- |
|
- |
|
3,652 |
|
| Capital expenditure commitments |
20,077 |
|
- |
|
- |
|
- |
|
20,077 |
|
| Other |
696 |
|
330 |
|
327 |
|
- |
|
1,353 |
|
| Total contractual obligations |
$ |
249,128 |
|
$ |
195,471 |
|
$ |
33,413 |
|
$ |
488,214 |
|
$ |
966,226 |
|
| SSR Mining Inc. | Financial Statements Year-End 2020 | | 67 |
SSR Mining Inc. Notes to the Consolidated Financial Statements (tabular amounts expressed in thousands of United States dollars unless otherwise stated) |
| 27. | FINANCIAL RISK MANAGEMENT (continued) |
(c) Liquidity
Risk (continued)
The
Company believes working capital at December 31, 2020, together with future cash flows from operations, are sufficient to
support its commitments through 2021.
(d) Capital
risk
The
Company's objectives when managing capital are to:
| • | safeguard its
ability to continue as a going concern in order to develop and operate its current projects and pursue strategic growth initiatives;
and |
| • | maintain a flexible
capital structure and minimize the cost of capital. |
In
assessing its capital structure, the Company includes the components of shareholders’ equity and the 2019 Notes, Term Loan
and other debt. In order to facilitate the management of capital requirements, the Company prepares annual budgets and periodic
forecasts and continuously monitor and review actual and forecasted cash flows. The annual budgets are monitored and approved by
the Board of Directors.
To
maintain or adjust the capital structure, the Company may, from time to time, issue new shares, issue new debt, repay debt or dispose
of non-core assets. The Company expects its current capital resources will be sufficient to carry out its exploration plans and
support operations through the current operating period.
As
of December 31, 2020, the Company was in compliance with its externally-imposed financial covenants in relation to the Term
Loan (note 14(b)) and Credit Facility (note 14(c)). The Company does not have any financial covenants in relation to the 2019 Notes
(note 14(a)).
| 28. | RELATED PARTY TRANSACTIONS |
Key
management includes the Company's directors (executive and non-executive) and other key officers, including the Chief Executive
Officer, Chief Financial Officer and Chief Operating Officer. The compensation paid or payable to key management for employee services
is shown below and includes payments relating to former directors and executives:
| Years ended December 31 |
2020 |
2019 |
| Salaries and other short-term employee benefits |
$ |
4,516 |
|
$ |
3,401 |
|
| Post-employment benefits |
113 |
|
134 |
|
| Termination benefits |
4,542 |
|
- |
|
| Share-based compensation (1) |
9,548 |
|
12,370 |
|
| Total compensation |
$ |
18,719 |
|
$ |
15,905 |
|
| (1) | Share-based compensation includes fair value remeasurements
on outstanding DSUs, RSUs and PSUs included in the consolidated statements of income. |
| SSR Mining Inc. | Financial Statements Year-End 2020 | | 68 |
SSR Mining Inc. Notes to the Consolidated Financial Statements (tabular amounts expressed in thousands of United States dollars unless otherwise stated) |
| 29. | SUPPLEMENTAL CASH FLOW INFORMATION |
Adjustments
for other non-cash operating activities during the years ended December 31, 2020 and 2019 were as follows:
| Years ended December 31 |
2020 |
2019 |
| Share-based payments |
$ |
2,082 |
|
$ |
4,005 |
|
| Loss or write-down on sale of mineral properties, plant and equipment |
1,265 |
|
1,008 |
|
| Loss on change in fair value of concentrate trade receivables |
1,396 |
|
- |
|
| Other |
(1,909) |
|
6,528 |
|
| |
$ |
2,834 |
|
$ |
11,541 |
|
Net
change in operating assets and liabilities during the years ended December 31, 2020 and 2019 were as follows:
| Years ended December 31 |
2020 |
2019 |
| Trade and other receivables |
$ |
16,509 |
|
$ |
(58,525) |
|
| Other current assets |
(10,649) |
|
(7,819) |
|
| Inventories |
79,103 |
|
(10,872) |
|
| Accounts payable and accrued liabilities |
(17,072) |
|
15,801 |
|
| Reclamation and closure cost provision - current |
(4,832) |
|
(3,493) |
|
| |
$ |
63,059 |
|
$ |
(64,908) |
|
Non-cash
investing and financing transactions during the years ended December 31, 2020 and 2019 were as follows:
| Years ended December 31 |
2020 |
2019 |
| Consideration issued for acquisition of Alacer (note 4(a)) |
$ |
(2,179,647) |
|
$ |
- |
|
| Acquisition of net assets in exchange for a receivable |
12,576 |
|
- |
|
| Reclamation and closure cost provision assumed in land acquisition |
- |
|
(12,990) |
|
| Transfer of share-based payment reserve upon exercise of stock options (note 18) |
(2,976) |
|
(2,804) |
|
| Transfer of equity-settled PSUs (note 18) |
- |
|
1,356 |
|
| Transfer of cash-settled RSUs and PSUs (note 18) |
(4,138) |
|
- |
|
| Extinguishment of loan receivable in connection with the acquisition of non-controlling interest (note 4(b)) |
- |
|
11,369 |
|
| Non-cash consideration for acquisition of non-controlling interest (note 4(b)) |
- |
|
(30,101) |
|
| Other non-cash investing and financing transactions |
2,643 |
|
- |
|
| |
$ |
(2,171,542) |
|
$ |
(33,170) |
|
On February 17, 2021, the
Company declared a quarterly cash dividend of $0.05 per common share, payable on March 31, 2021 to holders of record at the close
of business on March 5, 2021 for estimated total dividends of $11.0 million.
| SSR Mining Inc. | Financial Statements Year-End 2020 | | 69 |
Exhibit 99.2
MANAGEMENT'S DISCUSSION
AND ANALYSIS FOR THE YEAR ENDED
DECEMBER 31, 2020
SSR Mining Inc. | MD&A Q4 2020 | 2 |
MANAGEMENT'S DISCUSSION
AND ANALYSIS OF THE FINANCIAL POSITION AND RESULTS OF OPERATIONS FOR THE YEAR ENDED DECEMBER 31, 2020
This Management's Discussion and Analysis
("MD&A") is intended to supplement the audited consolidated financial statements of SSR Mining Inc., ("SSR Mining",
or the "Company") for the year ended December 31, 2020, and the related notes thereto, which have been prepared in accordance
with International Financial Reporting Standards ("IFRS", or "GAAP"), as issued by the International Accounting
Standards Board (the "IASB"). All figures are expressed in U.S. dollars except where otherwise indicated. This MD&A
has been prepared as of February 17, 2021, and should be read in conjunction
with the audited consolidated financial statements for the year ended December 31, 2020.
Additional information, including the Company's
most recent Annual Information Form and Annual Report on Form 40-F, is available on SEDAR at www.sedar.com,
on the EDGAR section of the U.S. Securities and Exchange Commission ("SEC") website at www.sec.gov
and on the ASX at www.asx.com.au.
This MD&A contains "forward-looking
statements" that are subject to risk factors set out in a cautionary note contained in Section 16 herein. The Company uses
certain non-GAAP financial measures in this MD&A; for a description of each of these measures, please see the discussion under
"Non-GAAP Financial Measures" in Section 13. The Company uses Mineral Reserves and Mineral Resources classifications
in this MD&A, which differ significantly from the classifications required by the SEC, as set out in the cautionary note contained
in Section 16.
On September 16, 2020, the Company acquired
all of the issued and outstanding shares of Alacer Gold Corp. (“Alacer”). The Company began consolidating the operating
results, cash flows and net assets of Alacer from and after September 16, 2020, and the results in this MD&A reflect such consolidation.
Please refer to the discussion under “Business Developments” in Section 3 for further details of this transaction.
SSR Mining Inc. | MD&A Q4 2020 | 3 |
| 1. | FOURTH QUARTER AND FULL YEAR 2020 HIGHLIGHTS |
| • | Closed zero-premium
merger with Alacer: On September 16, 2020, completed the transaction
with Alacer to create a leading intermediate precious metals producer with robust margins, strong free cash flow generation and
long mine lives led by a highly experienced leadership team with a track record of value creation. |
| • | Robust free cash flow:
Reported fourth quarter attributable net income of $89.0 million, or $0.41
per share, and adjusted 2020 attributable net income of $108.8 million, or $0.50 per share. Generated cash flows from operating
activities of $217.4 million and free cash flow of $157.0 million in the fourth quarter.(1) |
| • | Record fourth quarter
performance: Delivered fourth quarter production of 220,432
gold equivalent ounces at AISC of $976 per gold equivalent ounce, exiting the year with strong operational momentum.(1) |
| • | Enhanced
balance sheet and liquidity: Cash and cash
equivalents and consolidated cash balances at year-end increased to $860.6 million and $897.0 million, respectively, further strengthening
the Company's peer-leading balance sheet.(1) Cash and cash equivalents increased by $127.1 million during the fourth
quarter. |
| • | Inaugural
dividend announced: The Board declared the
first quarterly cash dividend of $0.05 per share. |
| • | Delivered positive Çöpler
District Master Plan studies: Released an updated NI 43-101
technical report outlining two production scenarios which demonstrate the long-term value and the significant organic growth potential
of this world-class operation. |
| • | Discovered C2 copper-gold
porphyry target at Çöpler: Announced positive results
from four diamond drill holes below the Çöpler pit, with all holes intersecting gold-rich copper porphyry mineralization.
The C2 results are another example of the long-term potential of Çöpler. |
| • | Çöpler
contributes low-cost production: Delivered
gold production of 83,029 ounces in the fourth quarter and annual production of 326,908 ounces.(2) Reported AISC of
$748 per ounce in the fourth quarter, generating robust margins.(1) |
| • | Record production at
Marigold: Delivered gold production of 76,941 ounces for the
fourth quarter and annual production of 234,443 ounces, marking both quarterly and annual production records for the operation. |
| • | Marigold recognized
for operator safety: The Marigold team was awarded first place
by the Nevada Mining Association for safety for large metal operator in 2020. |
| • | Steady-state production
at Seabee: Produced 31,915 ounces of gold at AISC of $787 per
ounce in the fourth quarter as the mine returned to steady-state operations.(1) |
| • | Strong performance at
Puna: Produced 2.2 million ounces of silver at cash costs of
$8.92 per ounce in the fourth quarter.(1) AISC of $15.90 per ounce was impacted by sales well below production due to
lags as concentrate shipments resumed.(1) |
| • | Provided robust 2021
outlook: In 2021, the Company expects to produce, on a consolidated
basis, 720,000 to 800,000 gold-equivalent ounces at consolidated AISC of $1,050 to $1,110 per gold equivalent ounce.(1) |
| (1) | SSR Mining reports the non-GAAP financial measures of all-in sustaining costs ("AISC")
per ounce of gold, silver and gold equivalent sold, adjusted attributable net income, adjusted attributable net income per share,
free cash flow and consolidated cash to manage and evaluate the Company's operating performance. See “Non-GAAP Financial
Measures” in Section 13. |
| (2) | Includes full year 2020 production from Çöpler. SSR Mining is not entitled to the economic
benefits from Çöpler prior to acquisition. |
SSR Mining Inc. | MD&A Q4 2020 | 4 |
| 2. | BUSINESS OVERVIEW AND STRATEGY |
Business Overview
SSR Mining is an intermediate precious
metals mining company with four producing assets located in the USA, Turkey, Canada and Argentina, combined with a global pipeline
of high-quality development and exploration assets in the USA, Turkey, Canada, Mexico and Peru. SSR Mining's diversified asset
portfolio is comprised of high-margin, long-life assets along several of the world's most prolific metal districts.
The Company has an experienced leadership
team with a proven track record of delivery and value creation. Across the organization, the Company has expertise in project construction,
mining (open pit and underground), and processing (pressure oxidation, heap leach and flotation), with a strong commitment to health,
safety, community engagement and environmental management.
The Company has a strong balance sheet,
with $897.0 million in consolidated cash(1) as at December 31, 2020, to support its growth pipeline. The Company
intends to leverage its strong balance sheet and proven track record of free cash flow generation to fund growth across the portfolio
and facilitate superior returns to shareholders.
SSR Mining is listed under the ticker symbol
SSRM on the Toronto Stock Exchange and Nasdaq Global Select Market (NASDAQ) and SSR on the Australian Securities Exchange.
Strategy
The Company's focus is on safe, profitable
gold and silver production at its Çöpler Gold Mine ("Çöpler"), Marigold Mine ("Marigold"),
Seabee Gold Operation ("Seabee"), and Puna Operations ("Puna").
The Company is committed to delivering
safe production through relentless emphasis on Operational Excellence. The Company is also focused on growing production and Mineral
Reserves through exploration and asset acquisition for accretive growth.
Sustainability is of growing importance
to all stakeholders, whether they are local communities, local and national governments, the Company's shareholders or its employees.
The Company is committed to building on its solid foundation through honest and open disclosure and continuous improvement.
SSR Mining's four producing assets are
described below:
Çöpler Gold
Mine, Turkey
Çöpler, 80% owned by SSR Mining,
is an open pit gold mine located along the Tethyan belt in east-central Turkey in the Erzincan Province, approximately 1,100 kilometers
southeast of Istanbul and 550 kilometers east of Ankara. Çöpler contains oxide and sulfide ores which are mined concurrently
and processed through its two processing plants using heap leach and pressure oxidation processing, respectively, to produce gold
bullion. Çöpler and nearby tenements are positioned on a land package of approximately 25,800 hectares.
Marigold Mine, USA
Marigold is an open pit gold mine located
along the Battle Mountain-Eureka Trend in Nevada, USA. Marigold is a run-of-mine heap leach operation, moving more than 200,000
tonnes of material per day, and producing gold bullion. Marigold is positioned on a land package of approximately 20,000 hectares.
Seabee Gold Operation,
Canada
Seabee is an underground gold mine located
along the Trans-Hudson Corridor in east-central Saskatchewan, Canada. Seabee processes ore through its processing plant using gravity
concentration and cyanide leaching to produce gold bullion. Seabee is positioned on a land package of approximately 60,000 hectares,
including the Fisher property option.
SSR Mining Inc. | MD&A Q4 2020 | 5 |
| 2. | BUSINESS OVERVIEW AND STRATEGY (continued) |
Puna Operations, Argentina
Puna is an open pit silver-lead-zinc mine
located along the Bolivian silver belt in northern Argentina in the Province of Jujuy. Puna processes ore mined from the Chinchillas
mine through its Pirquitas mill, using flotation processing to produce silver-lead and zinc concentrates.
| (1) | SSR Mining reports the non-GAAP financial measure of consolidated cash to supplement information
in the Company's consolidated financial statements. See “Non-GAAP Financial Measures” in Section 13. |
Alacer Transaction
On September 16, 2020, the Company acquired
all of the issued and outstanding common shares of Alacer, with Alacer shareholders receiving 0.3246 of an SSR Mining common share
for every one Alacer share (the "Exchange Ratio"). The transaction resulted in the issuance of 95,699,911 SSR Mining
common shares to the former shareholders of Alacer. Furthermore, all outstanding restricted share units (RSUs), performance share
units (PSUs) and deferred share units (DSUs) of Alacer that were not exercised prior to the acquisition date, were converted to
equivalent SSR Mining units (collectively, the "Replacement Units"), with the number of such securities issuable adjusted
by the Exchange Ratio.
Immediately subsequent to the share issuance,
SSR Mining and former Alacer shareholders owned 57% and 43%, respectively, of the shares of the combined entity. With the completion
of the transaction (the "Alacer Transaction"), Alacer has become a wholly-owned
subsidiary of SSR Mining. Alacer holds an 80% interest in Anagold Madencilik Sanayi ve Ticaret Anonim Şirketi ("Anagold"),
the owner and operator of Çöpler, a large-scale open pit gold mine in east-central Turkey. The 20% non-controlling
interest in Anagold is held by Lidya Madencilik Sanayi ve Ticaret Anonim Şirketi ("Lidya Mining").
In
accordance with the acquisition method of accounting, the consideration transferred has been allocated to the underlying assets
acquired and liabilities assumed, based upon their estimated fair values as at the date of acquisition.
The combined entity continues to operate
as SSR Mining with two corporate offices, one in Denver, Colorado and one in Vancouver, British Columbia. The combined entity is
led by Rod Antal as President & CEO and Michael Anglin as Chair of the Company's Board of Directors. The newly-constituted
Board of Directors is comprised of five directors from each of the previous SSR Mining and Alacer boards of directors for a total
of ten directors, including the CEO.
The zero-premium merger of SSR Mining and
Alacer creates a leading intermediate gold producer with robust margins, strong free cash flow generation, and long mine lives
across four mining-friendly jurisdictions. In addition, the increased financial strength of the combined business enables the Company
to leverage the proven project execution capabilities of the combined management team to continue delivering on the extensive organic
growth portfolio and compete for attractive assets as they arise. The Company expects the complementary nature of the assets and
the cultural alignment of the organizations to facilitate an effective integration and allow us to continue to deliver value to
its shareholders.
COVID-19 Response and
Impact on Operations
During the year ended December 31, 2020,
the coronavirus disease 2019 ("COVID-19") pandemic has negatively impacted global economic and certain financial markets.
Many industries have been impacted by the COVID-19 pandemic and are facing operating challenges associated with the regulations
and guidelines resulting from efforts to contain it.
The Company continues to restrict all non-essential
travel and manage the contact of its employees and contractors in order to reduce the risk of COVID-19 impacting its operations.
The Company is operating its corporate offices at reduced capacity, with employees working remotely.
SSR Mining Inc. | MD&A Q4 2020 | 6 |
| 3. | BUSINESS DEVELOPMENTS (continued) |
As discussed in "Results of Operations"
in Section 6, Seabee and Puna were placed into care and maintenance near the end of the first quarter of 2020 and subsequently
restarted through the second and third quarters of 2020. While there have been some impacts caused by the COVID-19 pandemic, Çöpler's
and Marigold's operations have continued uninterrupted.
At Seabee, phased re-start plans were successfully
implemented during the third quarter. In July, ore extraction and development rates ramped up and, in early August, milling operations
re-commenced. Prior to restarting the mill, the Company built up an ore stockpile, which provided the mill with operating flexibility
relative to mine extraction. Operations have returned to or exceeded pre-COVID-19 rates since August. Maintaining flight and camp
operations within determined health and safety protocols continue to be an ongoing focus.
At Puna, operations returned to production
late in the second quarter, with the recommencement of mining, hauling and milling operations. During the third quarter, COVID-19
infection rates in the Province of Jujuy escalated, resulting in further interruptions to operations. Puna suspended operations
in September in order to manage camp occupancy, conduct testing for employees and contractors and reduce the risk of transmission.
Mining and milling activities returned to pre-COVID-19 operating levels at the beginning of October. Strict protocols remain in
place to manage the COVID-19 risk within the camp and operations.
During the temporary suspensions at Seabee
and Puna, the sites continued to perform care and maintenance activities. Costs incurred during the suspensions associated with
these activities have been separately identified and accounted for as care and maintenance expenses within operating income in
the consolidated statements of income.
At Çöpler and Marigold, the
sites continue to operate with limited impact from COVID-19 and have implemented numerous measures intended to protect employees,
including quarantining, testing, ensuring physical distancing and providing additional protective equipment. COVID-19 is slowing
government processes, including permitting. In Turkey, considerable effort is being expended to attain permits and land access
for continued growth and operations.
Currently, Çöpler, Marigold,
Seabee and Puna are all operating with some impacts caused by the COVID-19 pandemic. Each of the sites continue to work with national
and local authorities in accordance with applicable regulations and remain vigilant with respect to on-site specific protocols
to protect the health and safety of employees and stakeholders; however, all sites remain exposed to potential COVID-19 impacts.
See the "Risks and Uncertainties"
in Section 13 and "Cautionary Notes" in Section 16 of this MD&A for further information on the impact that the COVID-19
pandemic has had on the Company's business and the actions the Company has taken in response.
Çöpler District
Master Plan
During the fourth quarter of 2020,
the Company released the results of its independently prepared study of the Çöpler District ("Çöpler
District Master Plan 2020", or "CDMP 2020") which increased Mineral Reserves by 22%, Measured and Indicated Mineral
Resources by 24% and Inferred Mineral Resources by 58% as compared to December 31, 2019. The CDMP 2020 summarized SSR Mining's
current development strategy for Çöpler and included analysis for two production scenarios. The first scenario considers
a feasibility level Mineral Reserve case which incorporates a supplemental flotation circuit, resulting in a net present value
of $1.7 billion at a 5% discount rate with life-of-mine ("LOM") gold production of 3.6 million ounces. The second scenario
provides an alternative Preliminary Economic Assessment ("PEA") case which includes the development of the Ardich gold
deposit ("Ardich"), located six kilometers northeast of the Çöpler processing facilities, resulting in a
net present value of $2.2 billion at a 5% discount rate with LOM gold production of 4.6 million ounces.
The PEA case is preliminary in nature
and includes an economic analysis that is based, in part, on Inferred Mineral Resources. Inferred Mineral Resources are considered
too speculative geologically for the application of economic considerations that would allow them to be categorized as Mineral
Reserves, and there is no certainty that the results will be realized. Mineral Resources that are not Mineral Reserves do not
have demonstrated economic viability.
SSR Mining Inc. | MD&A Q4 2020 | 7 |
| 3. | BUSINESS DEVELOPMENTS (continued) |
SilverCrest Divestment
During the second quarter of 2020, the
Company completed a transaction to divest all of its equity position in SilverCrest Metals Inc. (“SilverCrest”). The
Company divested an aggregate 9,000,645 common shares of SilverCrest at a price of C$10.06 per share for gross proceeds of $64.3
million (C$90.5 million). Upon divestment, the Company recognized a pre-tax gain of $37.8 million (C$55.3 million) within other
comprehensive income.
Convertible Notes Redemption
During the first quarter of 2020,
holders of the Company's 2.875% senior convertible notes issued in 2013 (the "2013 Notes") had the right to surrender
their 2013 Notes for purchase by the Company at their option (the "Put Option") pursuant to the terms of the indenture
governing the 2013 Notes any time before January 31, 2020. As of the expiration of the Put Option on January 31, 2020, $49,000
aggregate principal amount of the 2013 Notes were put to the Company and redeemed, and $4,000 of 2013 Notes were converted to equity.
The remaining outstanding 2013 Notes
were callable by the Company at par, plus accrued and unpaid interest thereon. On February 13, 2020, the Company provided notice
of redemption to call the remaining outstanding 2013 Notes. On March 30, 2020, the Company redeemed all of its remaining outstanding
2013 Notes consisting of an aggregate principal amount of $115.0 million plus accrued interest of $0.5 million, in exchange for
payment of cash of $115.5 million and equity of $2,000.
This section of the MD&A provides
management's production, cost, capital, exploration and development expenditure estimates for 2021. These are “forward-looking
statements” and subject to the cautionary note regarding the risks associated with forward-looking statements contained in
Section 16. Cash costs and AISC per ounce of gold and silver sold are non-GAAP financial measures. Please see the discussion under
"Non-GAAP Financial Measures" in Section 13.
For the full year 2021, the Company expects
to produce, on a consolidated basis, 720,000 to 800,000 gold equivalent ounces from its four operating mines at consolidated AISC
of $1,050 to $1,110 per gold equivalent ounce.
| Operating Guidance (100%) (1) | |
| |
Çöpler (2) | |
Marigold | |
Seabee | |
Puna | |
Other | |
Consolidated |
| Gold Production | |
koz | |
310 - 340 | |
235 - 265 | |
95 - 105 | |
— | |
— | |
640 - 710 |
| Silver Production | |
Moz | |
— | |
— | |
— | |
6.0 - 7.0 | |
— | |
6.0 - 7.0 |
| Gold Equivalent Production | |
koz | |
310 - 340 | |
235 - 265 | |
95 - 105 | |
80 - 90 | |
— | |
720 - 800 |
| Cash Cost per Ounce (3) | |
| $/oz | | |
| 550 - 600 | | |
| 810 - 860 | | |
| 525 - 575 | | |
| 10.00 - 11.50 | | |
| — | | |
| 660 - 715 |
Sustaining Capital Expenditures (4) | |
| $M | | |
| 52 | | |
| 53 | | |
| 11 | | |
| 19 | | |
| — | | |
| 135 |
| Capitalized Stripping / Capitalized Development | |
| $M | | |
| 9 | | |
| 47 | | |
| 19 | | |
| 13 | | |
| — | | |
| 88 |
| Sustaining Exploration Expenditures | |
| $M | | |
| 2 | | |
| 7 | | |
| 1 | | |
| 1 | | |
| — | | |
| 11 |
| General & Administrative (5) | |
| $M | | |
| — | | |
| — | | |
| — | | |
| — | | |
| 30 - 35 | | |
| 30 - 35 |
| Share-based Compensation (5) | |
| $M | | |
| — | | |
| — | | |
| — | | |
| — | | |
| 15 - 20 | | |
| 15 - 20 |
| All-In Sustaining Cost per Ounce (3) | |
| $/oz | | |
| 760
- 810 | | |
| 1,250
- 1,290 | | |
| 860
- 910 | | |
| 16.00
- 17.50 | | |
| — | | |
| 1,050
- 1,110 |
| Growth Capital Expenditures | |
| $M | | |
| 26 | | |
| — | | |
| 7 | | |
| — | | |
| — | | |
| 33 |
| Growth Exploration and Development Expenditures (6) | |
| $M | | |
| 31 | | |
| 11 | | |
| 7 | | |
| — | | |
| 5 | | |
| 54 |
| Total Growth Capital | |
| $M | | |
| 57 | | |
| 11 | | |
| 14 | | |
| — | | |
| 5 | | |
| 87 |
| | |
| | | |
| | | |
| | | |
| | | |
| | | |
| | | |
| |
| (1) | Figures may not add due to rounding. |
| (2) | Figures are reported on a 100% basis. Çöpler is 80% owned by SSR Mining. |
| (3) | SSR Mining reports the non-GAAP financial measures of cash costs and AISC per ounce of gold and
silver sold to manage and evaluate operating performance at Çöpler, Marigold, Seabee and Puna. Refer to Section 13
"Non-GAAP Financial Measures". |
| (4) | Excludes sustaining exploration expenditures. Includes $9.5 million oxygen plant lease payment
at Çöpler. |
| (5) | General and administrative expenses exclude share-based compensation, which is reported separately. |
| (6) | Growth exploration and development expenditures are shown on a 100% basis, of which SSR Mining
attributable amount totals $46 million. |
| (7) | All figures in U.S. dollars, unless otherwise noted. Gold equivalent figures for 2021 operating
guidance are based on a gold-to-silver ratio of 76:1. Cash costs and capital expenditures guidance is based on an oil price of
$45 per barrel and an exchange rate of 1.30 Canadian dollars to one U.S. dollar and 7.5 Turkish lira to one U.S. dollar. |
SSR Mining Inc. | MD&A Q4 2020 | 8 |
SSR Mining has a number of operational
priorities and development catalysts for 2021, as detailed below.
Çöpler
| • | Flotation
circuit construction, with expected ramp-up beginning mid-year 2021 |
| • | Ardich
exploration and concurrent development towards first production in 2023 |
| • | OC2
Porphyry copper-gold exploration and advancement, focusing on an expandable development plan |
Marigold
| • | Ongoing
cost reduction and continuous improvement initiatives |
| • | Oxide exploration targeting higher grades
and conversion at Mackay, Valmy, New Millennium, Trenton Canyon and Buffalo Valley |
| • | Sulfide
exploration and evaluation |
Seabee
| • | Increase
mining rates to exploit latent mill capacity |
| • | Gap
Hanging Wall Mineral Resource conversion |
| • | Seabee
and Fisher exploration and resource development |
Puna
| • | Continue
steady state production with focus on increasing productivity |
| • | Achieve
and sustain mill throughput rates above 4,000 tonnes per day |
| • | Implement
and integrate owner-operated ore transport fleet |
Free cash flow generation in 2021 is expected
to be approximately 75% weighted to the second half of the year due to the timing of the ramp-up and commissioning of the flotation
circuit at Çöpler, timing of capital expenditures across all sites, working capital seasonality at Seabee, and tax
and royalty payments that are paid in the first half of the year.
Capital Returns
Capital Allocation
The Company's capital allocation strategy
is to balance continuing investment in high-return growth, maintaining peer leading financial strength, and providing sustainable
capital returns to shareholders.
In recognition of SSR Mining's position
as a leading and sustainable free cash flow generator in the intermediate gold sector, it is the Company's intention to return
excess attributable free cash flow to shareholders through a two-tiered capital return structure. While a recurring quarterly dividend
is expected to be the primary method of capital return, the Company will periodically evaluate supplementing this dividend from
excess attributable free cash flow in the form of incremental dividends and/or share buyback programs.
On February 17,
2021, the Company’s Board of Directors approved its inaugural quarterly dividend payment of $0.05 per common share
to be paid on March 31, 2021 to shareholders of record on March 5, 2021. The declaration and payment of future dividends will be
at the discretion of the Board of Directors and will be made based on the Company’s financial position and other factors
relevant at the time.
The dividend was designated as an “eligible
dividend” for Canadian federal and provincial income tax purposes. Dividends paid to shareholders who are non-residents of
Canada will be subject to Canadian non-resident withholding taxes.
SSR Mining Inc. | MD&A Q4 2020 | 9 |
| 5. | FINANCIAL AND OPERATING HIGHLIGHTS |
A summary of the Company's consolidated
financial and operating results for the three months and year ended December 31, 2020 and 2019 are presented below:
| (in thousands of US dollars, except per share data) |
Three months ended December 31, |
Year ended December 31, |
| |
2020 |
2019 |
2020 |
2019 |
| Financial Results |
|
|
|
|
| Revenue |
$ |
370,729 |
|
$ |
177,603 |
|
$ |
853,089 |
|
$ |
606,850 |
|
| Income from mine operations |
$ |
146,456 |
|
$ |
58,913 |
|
$ |
308,642 |
|
$ |
170,883 |
|
| Gross margin (2) |
40 |
% |
33 |
% |
36 |
% |
28 |
% |
| Operating income |
$ |
120,332 |
|
$ |
43,228 |
|
$ |
202,713 |
|
$ |
122,338 |
|
| Net income |
$ |
97,654 |
|
$ |
19,479 |
|
$ |
140,468 |
|
$ |
55,757 |
|
| Net income attributable to equity holders of SSR Mining |
$ |
89,039 |
|
$ |
19,479 |
|
$ |
133,494 |
|
$ |
57,315 |
|
| Basic attributable net income per share |
$ |
0.41 |
|
$ |
0.16 |
|
$ |
0.88 |
|
$ |
0.47 |
|
| Adjusted attributable net income (1) |
$ |
108,813 |
|
$ |
23,717 |
|
$ |
213,172 |
|
$ |
78,758 |
|
| Adjusted basic attributable net income per share (1) |
$ |
0.50 |
|
$ |
0.19 |
|
$ |
1.41 |
|
$ |
0.65 |
|
| |
|
|
|
|
| Cash generated by operating activities |
$ |
217,383 |
|
$ |
51,917 |
|
$ |
348,615 |
|
$ |
145,844 |
|
| Cash (used in) generated by investing activities |
$ |
(54,099) |
|
$ |
(22,303) |
|
$ |
180,790 |
|
$ |
(130,328) |
|
| Cash (used in) generated by financing activities |
$ |
(36,938) |
|
$ |
(3,536) |
|
$ |
(173,204) |
|
$ |
68,907 |
|
| |
|
|
|
|
| Operating Results |
|
|
|
|
| Gold produced (oz) |
191,885 |
|
81,255 |
|
418,744 |
|
332,364 |
|
| Gold sold (oz) |
182,328 |
|
85,404 |
|
414,163 |
|
331,350 |
|
| Silver produced ('000 oz) |
2,165 |
|
2,132 |
|
5,581 |
|
7,674 |
|
| Silver sold ('000 oz) |
1,010 |
|
2,584 |
|
4,661 |
|
7,695 |
|
| Lead produced ('000 lb) (4) |
6,529 |
|
7,985 |
|
17,193 |
|
23,957 |
|
| Lead sold ('000 lb) (4) |
3,158 |
|
9,371 |
|
14,903 |
|
24,119 |
|
| Zinc produced ('000 lb) (4) |
2,932 |
|
3,007 |
|
6,988 |
|
8,392 |
|
| Zinc sold ('000 lb) (4) |
1,898 |
|
3,067 |
|
6,039 |
|
14,072 |
|
| |
|
|
|
|
| Gold equivalent produced (oz) (5) |
220,432 |
|
106,205 |
|
484,153 |
|
421,828 |
|
| Gold equivalent sold (oz) (5) |
194,862 |
|
114,268 |
|
465,471 |
|
415,383 |
|
| |
|
|
|
|
| Average realized gold price ($/oz sold) |
$ |
1,880 |
|
$ |
1,480 |
|
$ |
1,812 |
|
$ |
1,394 |
|
| Average realized silver price ($/oz sold) |
$ |
24.78 |
|
$ |
17.32 |
|
$ |
21.23 |
|
$ |
16.26 |
|
| |
|
|
|
|
| Cash cost per gold equivalent ounce sold (1, 5,) |
$ |
693 |
|
$ |
716 |
|
$ |
759 |
|
$ |
740 |
|
| AISC per gold equivalent ounce sold (1, 5,) |
$ |
976 |
|
$ |
1,088 |
|
$ |
1,138 |
|
$ |
1,087 |
|
| |
|
|
|
|
| Financial Position |
December 31, 2020 |
December 31, 2019 |
| Cash and cash equivalents |
$ |
860,637 |
|
$ |
503,647 |
|
| Current assets |
$ |
1,424,522 |
|
$ |
899,662 |
|
| Total assets |
$ |
5,244,986 |
|
$ |
1,750,107 |
|
| Current liabilities |
$ |
248,933 |
|
$ |
234,171 |
|
| Total liabilities |
$ |
1,305,083 |
|
$ |
616,153 |
|
| Working capital (3) |
$ |
1,175,589 |
|
$ |
665,491 |
|
| (1) | The Company reports non-GAAP financial measures including adjusted attributable net income, adjusted
basic attributable net income per share, cash costs and AISC per ounce sold to manage and evaluate its operating performance at
its mines. See "Non-GAAP Financial Measures" in Section 13. |
| (2) | Gross margin is defined as income from mine operations divided by revenue. |
| (3) | Working capital is defined as current assets less current liabilities. |
| (4) | Data for lead production and sales relate only to lead in lead concentrate. Data for zinc production
and sales relate only to zinc in zinc concentrate. |
| (5) | Gold equivalent ounces have been established using the average realized metal prices per ounce
of precious metals sold in the period and applied to the recovered silver metal content produced by the mines. Zinc and lead production
are not included in gold equivalent ounces produced. |
SSR Mining Inc. | MD&A Q4 2020 | 10 |
Çöpler,
Turkey
(amounts presented on 100%
basis)
| |
Three months ended
December 31 |
Period from acquisition to
December 31, 2020 |
Year ended December 31 |
| Operating Data |
2020 |
2020 (1) |
2020 (2) |
| Gold produced - oxide (oz) |
21,200 |
|
26,458 |
|
87,548 |
|
| Gold produced - sulfide (oz) |
61,830 |
|
76,158 |
|
239,360 |
|
| Total gold produced (oz) |
83,029 |
|
102,616 |
|
326,908 |
|
| Gold sold (oz) |
80,388 |
|
108,283 |
|
321,272 |
|
| |
|
|
|
| Ore mined - oxide (kt) |
1,354 |
|
1,501 |
|
2,823 |
|
| Ore mined - sulfide (kt) |
935 |
|
1,034 |
|
2,255 |
|
| Total material mined (kt) |
7,045 |
|
8,108 |
|
25,861 |
|
| Waste removed (kt) |
4,756 |
|
5,573 |
|
20,783 |
|
| Strip ratio |
2.1 |
|
2.2 |
|
4.1 |
|
| |
|
|
|
| Ore stacked - oxide (kt) |
1,292 |
|
1,413 |
|
2,841 |
|
| Gold grade stacked - oxide (g/t) |
1.20 |
|
1.20 |
|
1.13 |
|
| |
|
|
|
| Ore processed - sulfide (kt) |
584 |
|
669 |
|
2,158 |
|
| Gold grade processed - sulfide (g/t) |
3.61 |
|
3.62 |
|
3.74 |
|
| Gold recovery - sulfide (%) |
90.3 |
|
90.1 |
|
90.7 |
|
| |
|
|
|
| Average realized gold price ($/oz sold) |
$ |
1,876 |
|
$ |
1,887 |
|
N/A |
| |
|
|
|
| Cash costs ($/oz gold sold) (3, 4) |
$ |
619 |
|
$ |
614 |
|
N/A |
| AISC ($/oz gold sold) (3, 4) |
$ |
748 |
|
$ |
743 |
|
N/A |
| |
|
|
|
| Financial Data ($000s) |
|
|
|
| Revenue |
$ |
151,970 |
|
$ |
205,536 |
|
N/A |
| Production costs |
$ |
79,948 |
|
$ |
120,618 |
|
N/A |
| Depletion and depreciation |
$ |
25,158 |
|
$ |
34,053 |
|
N/A |
| Income from mine operations |
$ |
46,864 |
|
$ |
50,865 |
|
N/A |
| Exploration and evaluation expenses |
$ |
2,605 |
|
$ |
3,558 |
|
N/A |
| Capital expenditures |
$ |
18,463 |
|
$ |
22,883 |
|
N/A |
| (1) | The data presented in this column is for the period from September 16, 2020 to December 31, 2020,
the period for which the Company was entitled to all economic benefits of Çöpler following the Company's acquisition
of Alacer. |
| (2) | The operating data presented in this column includes operating results for Çöpler for
the entire year ended December 31, 2020, including the period prior to the Company's acquisition of Alacer on September 16, 2020.
As the Company was not entitled to the economic benefits of Çöpler prior to the acquisition, financial data for the
periods prior to September 16, 2020 are not provided. |
| (3) | The Company reports the non-GAAP financial measures of cash costs and AISC per ounce of gold sold
to manage and evaluate operating performance at Çöpler. For further information, please refer to “Non-GAAP Financial
Measures” in Section 13. |
| (4) | Cash costs and AISC per ounce of gold sold exclude the impact of any fair value adjustment on acquired
inventories as at the date of the Company's acquisition of Alacer. |
SSR Mining Inc. | MD&A Q4 2020 | 11 |
Full
Year and Fourth Quarter 2020 Operating and Financial Results
Production
During the fourth quarter of 2020, Çöpler
produced 83,029 ounces of gold, which included 21,200 ounces of gold production from the Çöpler oxide plant and 61,830
ounces of gold production from the sulfide plant. Production was in line with guidance despite the impacts of COVID-19. The mine
plan was revised and other actions taken to mitigate the impacts of COVID-19.
From September 16, 2020, the date of the
Company's acquisition of Alacer, to December 31, 2020, Çöpler produced 102,616 ounces of gold, which included 26,458
ounces of gold production from the Çöpler oxide plant and 76,158 ounces of gold production from the sulfide plant.
For the year ended December 31, 2020, Çöpler
produced 326,908 ounces of gold, which included 87,548 ounces of gold production from the Çöpler oxide plant and 239,360
ounces of gold production from the sulfide plant. Production was in line with the revised mine plan that was adopted to diversify
ore sources and optimize production in light of the shortfall in mine operator numbers resulting from COVID-19.
For the three months and year ended December
31, 2020, oxide ore tonnes mined were 1.4 million and 2.8 million tonnes, respectively. The oxide ore mined grade was 1.16 g/t
and 1.06 g/t, respectively.
For the three months and year ended December
31, 2020, sulfide ore tonnes mined were 0.9 million and 2.3 million tonnes, respectively, in line with the revised mine plan.
For the three months and year ending December
31, 2020, the sulfide plant treated 0.6 million and 2.2 million tonnes of sulfide ore, respectively. The sulfide plant continued
to efficiently operate above design throughput. Plant gold recovery averaged approximately 91% for the year ended December 31,
2020. Recovery improvement projects continued in the fourth quarter of 2020, some of which continue into 2021.
Mine operator availability suffered in
2020 due to COVID-19 restrictions. The revised mine plan reduced the haulage of material to the tailings storage facility ("TSF"),
stockpiling this material for 2021, and allowed for available mining resources to be focused on the Manganese pit cutback. The
TSF is approximately 5 kilometers from the mine and is constructed from competent mine waste. Despite the reduced construction
rate in 2020 as a result of the impacts from COVID-19, the TSF is advancing ahead of operational requirements. A mining area was
also brought into production in the Main Pit to diversify ore sources, in part, as a risk management strategy should COVID-19 related
restrictions increase. Total mined tonnes for the fourth quarter and full year 2020, with the revised mine plan, were above the
original mine plan.
For the three months and year ended December
31, 2020, the total waste tonnes mined were 4.8 million and 20.8 million tonnes, respectively, in line with the revised mine plan.
The Çöpler District Master
Plan 2020 ("CDMP2020"), issued in November 2020, updated the operating parameters of the sulfide plant and includes the
results of optimization studies and programs, including the supplemental flotation circuit.
The
flotation circuit included in the recent amendment to the Çöpler Environmental Impact Assessment application and incorporated
into the CDMP2020 was approved for construction by the Board of Directors. The flotation circuit will treat a side stream from
the grinding circuit, with the concentrate reporting to autoclave feed and the tails to leaching. The flotation circuit is anticipated
to increase the gold and sulfur grades processed through the autoclaves (increasing autoclave and oxygen utilization), reduce unit
costs, and increase total sulfide plant throughput and gold production. Overall recovery declines modestly due to lower float tails
recovery. The currently-installed grinding mills have demonstrated significant latent capacity, sufficient to support an increase
in sulfide plant throughput capacity up to approximately 3 million tonnes per annum. The capital cost estimate for the flotation
circuit is approximately $18 million. At December 31, 2020, the detailed engineering designs for the flotation circuit were 89%
complete and the civil construction was 95% complete. The fabrication of the steel work is in progress, with tank delivery at 75%
and assembly at 55% completion. The flotation circuit commissioning is targeted for mid-year 2021.
SSR Mining Inc. | MD&A Q4 2020 | 12 |
Revenue
Revenue
for the fourth quarter of 2020 was $152.0 million as 80,388 ounces
of gold were sold at an average realized gold price of $1,876 per ounce.
Revenue
for the period from September 16, 2020, the date of the Company's acquisition of Alacer, to December 31, 2020, was $205.5
million as 108,283 ounces of gold were sold
at an average realized gold price of $1,887 per ounce.
Gold
ounces sold in the fourth quarter of 2020 were lower than production due to the timing of gold pours at year end. Gold ounces sold
from the date of acquisition to December 31, 2020 were higher than production due to the sale of finished goods inventory acquired
on the acquisition date.
Operating Costs
Cash
costs and AISC per ounce of gold sold are non-GAAP financial measures. Please see the discussion under "Non-GAAP Financial
Measures" in Section 13.
Unit
operating costs remained stable as a weaker local currency offset by the impacts associated with COVID-19. The impact of fair value
adjustments on acquired inventories and mineral interests are reflected in production costs and depletion and depreciation, respectively.
These impacts have been removed in the calculation of cash costs and AISC per ounce of gold sold (refer to Section 13).
In the fourth quarter
of 2020, cash costs per ounce of gold sold were $619. Royalty expense included in cash costs increased due to a combination of
higher rate and higher gold prices.
In
the fourth quarter of 2020, AISC per ounce of gold sold was $748, which was also affected by increased royalty expense.
SSR Mining Inc. | MD&A Q4 2020 | 13 |
Marigold, USA
| |
Three months ended December 31, |
Year ended December 31, |
| Operating Data |
2020 |
2019 |
Change |
2020 |
2019 |
Change |
| Gold produced (oz) |
76,941 |
|
59,186 |
|
30 |
% |
234,443 |
|
220,227 |
|
6 |
% |
| Gold sold (oz) |
73,927 |
|
61,088 |
|
21 |
% |
230,043 |
|
226,957 |
|
1 |
% |
| |
|
|
|
|
|
|
| Total material mined (kt) |
22,699 |
|
18,457 |
|
23 |
% |
85,594 |
|
74,039 |
|
16 |
% |
| Waste removed (kt) |
15,946 |
|
11,736 |
|
36 |
% |
62,038 |
|
48,364 |
|
28 |
% |
| Total ore stacked (kt) |
6,753 |
|
6,721 |
|
- |
% |
23,556 |
|
25,676 |
|
(8) |
% |
| Gold stacked grade (g/t) |
0.48 |
|
0.36 |
|
33 |
% |
0.39 |
|
0.40 |
|
(3) |
% |
| Strip ratio |
2.4 |
|
1.7 |
|
41 |
% |
2.6 |
|
1.9 |
|
37 |
% |
| |
|
|
|
|
|
|
| Average realized gold price ($/oz sold) |
$ |
1,885 |
|
$ |
1,478 |
|
28 |
% |
$ |
1,783 |
|
$ |
1,391 |
|
28 |
% |
| |
|
|
|
|
|
|
| Cash costs ($/oz gold sold) (1) |
$ |
838 |
|
$ |
778 |
|
8 |
% |
$ |
852 |
|
$ |
811 |
|
5 |
% |
| AISC ($/oz gold sold) (1) |
$ |
1,070 |
|
$ |
1,117 |
|
(4) |
% |
$ |
1,222 |
|
$ |
1,034 |
|
18 |
% |
| |
|
|
|
|
|
|
| Financial Data ($000s) |
|
|
|
|
|
|
| Revenue |
$ |
139,183 |
|
$ |
90,198 |
|
54 |
% |
$ |
409,798 |
|
$ |
315,320 |
|
30 |
% |
| Production costs |
$ |
62,228 |
|
$ |
47,472 |
|
31 |
% |
$ |
196,409 |
|
$ |
183,782 |
|
7 |
% |
| Depletion and depreciation |
$ |
15,752 |
|
$ |
12,463 |
|
26 |
% |
$ |
47,844 |
|
$ |
52,291 |
|
(9) |
% |
| Income from mine operations |
$ |
61,203 |
|
$ |
30,263 |
|
102 |
% |
$ |
165,545 |
|
$ |
79,247 |
|
109 |
% |
| Exploration and evaluation expenses |
$ |
427 |
|
$ |
319 |
|
34 |
% |
$ |
2,462 |
|
$ |
936 |
|
163 |
% |
| Capital expenditures |
$ |
15,833 |
|
$ |
20,754 |
|
(24) |
% |
$ |
80,161 |
|
$ |
53,702 |
|
49 |
% |
| (1) | The Company reports the non-GAAP financial measures of cash costs and AISC per ounce of gold sold
to manage and evaluate operating performance at Marigold. For further information, please refer to “Non-GAAP Financial Measures”
in Section 13. |
Full Year and Fourth Quarter 2020 Operating
and Financial Results
Production
In the fourth quarter of 2020, 22.7 million
tonnes of material were mined, a 23% increase compared to the fourth quarter of 2019. For the year ended December 31, 2020, 85.6
million tonnes of material were mined, a 16% increase over the year ended December 31, 2019. These increases are attributable to
shorter haulage cycles coupled with increased fleet capacities in load, haul and drilling.
During the fourth quarter of 2020, 6.8
million tonnes of ore was stacked at a gold grade of 0.48 g/t. This compares to 6.7 million tonnes of ore stacked at a gold grade
of 0.36 g/t in the fourth quarter of 2019. The higher grades delivered in the fourth quarter of 2020 as compared to the fourth
quarter 2019 are associated with the planned mining of the higher-grade portions of Mackay 4 and Mackay 8. In the fourth quarter
of 2019, mining activities focused on the lower grade portions of Mackay 5 and stripping of Mackay 4.
For the year ended December 31, 2020, 23.6
million tonnes of ore was stacked at a gold grade of 0.39 g/t compared to 25.7 million tonnes of ore stacked at a gold grade of
0.40 g/t for the year ended December 31, 2019. The reduction in both ore tonnes stacked and gold grade are associated with the
transition from mining higher grade Mackay 5 ore in 2019 to the stripping and mining of Mackay Phases 4 and 8 in 2020.
SSR Mining Inc. | MD&A Q4 2020 | 14 |
During the fourth quarter of 2020, Marigold
produced a quarterly record 76,941 ounces of gold, an increase of 30% compared to the fourth quarter of 2019 and 15% higher than
the previous quarterly record. Production benefited from higher grades stacked at lower lifts on the heap leach pads. A decrease
in electrowinning cell inventory also contributed to ounces produced in the fourth quarter of 2020.
Annual production in 2020 of 234,443 ounces
was a record for the mine's 32-year history. This was 6% higher than the 220,227 ounces of gold for the year ended December 31,
2019. The increase was due to low stacking elevations throughout 2020 which contributed to faster leach times and a decrease in
electrowinning cell inventory during 2020.
Revenue
Revenue increased by 54% to $139.2 million
in the fourth quarter of 2020 compared to the fourth quarter of 2019, due to a 28% increase in the average realized gold price
and 21% more ounces sold.
Revenue increased by 30% for the year ended
December 31, 2020 compared to the year ended December 31, 2019, due to an increase of 28% in the average realized gold price.
Gold ounces sold in the fourth quarter
and for the year ended December 31, 2020 were lower than production due to the timing of gold pours at year end.
Operating Costs
Cash
costs and AISC per ounce of gold sold are non-GAAP financial measures. Please see the discussion under "Non-GAAP Financial
Measures" in Section 13.
Cash costs per ounce of gold sold for the
fourth quarter of 2020 was $838, an 8% increase compared to the fourth quarter of 2019, primarily due to an increase in per unit
royalty costs due to higher realized gold prices. Cash costs per ounce of gold sold for the full year 2020 were $852, a 5%
increase compared to the full year 2019 for the same reason.
In the fourth quarter of 2020, AISC per
ounce of gold sold was $1,070, a 4% decrease compared to the fourth quarter of 2019, due to lower capital expenditures per gold
ounce sold partially offset by higher cash costs. Capital spend was lower in the fourth quarter of 2020 primarily due to the purchase
of a hydraulic shovel in the fourth quarter of 2019 with no comparable purchase in 2020.
AISC per ounce of gold sold for the year
ended December 31, 2020 was $1,222, an 18% increase compared to the year ended December 31, 2019 due to higher cash costs and an
increase in capital expenditures per gold ounce sold. Capital expenditures were higher than the year ended December 31, 2019, due
to mobile mine equipment replacements, increased leach pad construction, dewatering construction costs and higher deferred stripping.
SSR Mining Inc. | MD&A Q4 2020 | 15 |
Seabee, Canada
| |
Three months ended December 31, |
Year ended December 31, |
| Operating Data |
2020 |
2019 |
Change |
2020 |
2019 |
Change |
| Gold produced (oz) |
31,915 |
|
22,069 |
|
45 |
% |
81,686 |
|
112,137 |
|
(27) |
% |
| Gold sold (oz) |
28,013 |
|
24,362 |
|
15 |
% |
75,837 |
|
104,915 |
|
(28) |
% |
| |
|
|
|
|
|
|
| Total ore milled (t) |
99,487 |
|
87,394 |
|
14 |
% |
255,178 |
|
344,039 |
|
(26) |
% |
| Ore milled per day (t/day) |
1,081 |
|
950 |
|
14 |
% |
697 |
|
943 |
|
(26) |
% |
| Gold mill feed grade (g/t) |
9.85 |
|
7.89 |
|
25 |
% |
10.10 |
|
9.56 |
|
6 |
% |
| Gold recovery (%) |
98.4 |
|
97.9 |
|
1 |
% |
98.4 |
|
98.2 |
|
- |
% |
| |
|
|
|
|
|
|
| Average realized gold price ($/oz sold) |
$ |
1,877 |
|
$ |
1,484 |
|
26 |
% |
$ |
1,790 |
|
$ |
1,398 |
|
28 |
% |
| |
|
|
|
|
|
|
| Cash costs ($/oz sold) (1) |
$ |
531 |
|
$ |
505 |
|
5 |
% |
$ |
534 |
|
$ |
464 |
|
15 |
% |
| AISC ($/oz sold) (1) |
$ |
787 |
|
$ |
751 |
|
5 |
% |
$ |
939 |
|
$ |
812 |
|
16 |
% |
| |
|
|
|
|
|
|
| Financial Data ($000s) |
|
|
|
|
|
|
| Revenue |
$ |
52,498 |
|
$ |
36,142 |
|
45 |
% |
$ |
135,230 |
|
$ |
146,141 |
|
(7) |
% |
| Production costs |
$ |
15,583 |
|
$ |
12,283 |
|
27 |
% |
$ |
41,308 |
|
$ |
48,470 |
|
(15) |
% |
| Depletion and depreciation |
$ |
11,148 |
|
$ |
10,124 |
|
10 |
% |
$ |
28,233 |
|
$ |
36,368 |
|
(22) |
% |
| Income from mine operations |
$ |
25,767 |
|
$ |
13,735 |
|
88 |
% |
$ |
65,689 |
|
$ |
61,303 |
|
7 |
% |
| Exploration and evaluation expenses |
$ |
2,088 |
|
$ |
1,210 |
|
73 |
% |
$ |
6,108 |
|
$ |
8,770 |
|
(30) |
% |
| Capital expenditures |
$ |
8,201 |
|
$ |
5,946 |
|
38 |
% |
$ |
33,758 |
|
$ |
33,559 |
|
1 |
% |
| (1) | The Company reports the non-GAAP financial measures of cash
costs and AISC per ounce of gold sold to manage and evaluate operating performance at Seabee. For further information, please refer
to “Non-GAAP Financial Measures” in Section 13. |
Full Year and Fourth
Quarter 2020 Operating and Financial Results
Production
In
response to the COVID-19 pandemic, Seabee was voluntarily placed into temporary care and maintenance on March 25, 2020 as a precautionary
measure to protect the Company's employees, their families and communities. Through this period, employees maintained the mine
in a state of operational readiness.
In
June 2020, a phased restart of the operation commenced. The first phase focused on underground ventilation raises and capital development
within the mine while COVID-19-related protocols were assessed. Limited ore extraction was initiated at the end of June. In early
July, Seabee commenced the second phase, which involved increasing underground development rates and mine production while continuing
to monitor COVID-19 related protocols. In August, the third and final phase commenced, which involved a restart of milling operations
and ramp-up to full mine production with a complete workforce, while continuing to maintain effective COVID-19-related protocols.
The mine has operated at full capacity since completion of the final phase in August.
During
the fourth quarter of 2020, Seabee produced 31,915 ounces of gold, a 45% increase compared to the fourth quarter of 2019, due to
increases in tonnes and grade mined and milling of stockpiled ore. Mill feed grade was 9.85 g/t gold during the fourth quarter
of 2020, a 25% increase compared to the fourth quarter of 2019, due to the scheduled sequencing of the mine.
For
the year ended December 31, 2020, Seabee produced 81,686 ounces of gold, a 27% decrease compared to the year ended December 31,
2019, reflecting that the mill was shut down from March through August 2020, whereas the mill was fully operational in 2019.
SSR Mining Inc. | MD&A Q4 2020 | 16 |
Revenue
Revenue
increased by 45% in the fourth quarter of 2020 compared to the fourth quarter of 2019 due to a 15% increase in gold ounces sold
and a 26% increase in the average realized gold price.
Revenue
decreased by 7% for the year ended December 31, 2020 compared to the year ended December 31, 2019, due to a 28% decrease in gold
ounces sold, partially offset by a 28% increase in the average realized gold price. The decrease in gold ounces sold is due to
the temporary suspension of operations as a result of COVID-19.
Gold
ounces sold in the fourth quarter and for the year ended December 31, 2020 were lower than production due to the timing of shipments
of gold on carbon fines and the timing of gold pours at year end.
Operating
Costs
Cash
costs and AISC per ounce of gold sold are non-GAAP financial measures. Please see the discussion under "Non-GAAP Financial
Measures" in Section 13.
In
the fourth quarter of 2020, cash costs per ounce of gold sold were $531, a 5% increase compared to the fourth quarter of 2019,
due to higher general and administrative costs associated with the ramp up to full production.
In
the fourth quarter of 2020, AISC per ounce of gold sold was $787, a 5% increase compared to the fourth quarter of 2019, due to
higher cash costs. Capital expenditures in the fourth quarter of 2020 related mainly to the tailings expansion project. Full construction
activities at the tailings expansion project resumed in early August 2020.
For
the year ended December 31, 2020, cash costs per ounce of gold sold were $534, a 15% increase compared to the year ended December
31, 2019, due to higher unit mining and general and administrative costs, driven by the temporary suspension of operations for
all of the second quarter and beginning of the third quarter.
For
the year ended December 31, 2020, AISC per ounce of gold sold was $939, a 16% increase compared to the year ended December 31,
2019, due to higher cash costs.
SSR Mining Inc. | MD&A Q4 2020 | 17 |
Puna, Argentina
(amounts presented
on 100% basis)
| |
Three months ended December 31, |
Year ended December 31, |
| Operating Data |
2020 |
2019 |
Change |
2020 |
2019 |
Change |
| Silver produced ('000 oz) |
2,165 |
|
2,132 |
|
2 |
% |
5,581 |
|
7,674 |
|
(27) |
% |
| Silver sold ('000 oz) |
1,010 |
|
2,584 |
|
(61) |
% |
4,661 |
|
7,695 |
|
(39) |
% |
| Lead produced ('000 lb) (1) |
6,529 |
|
7,985 |
|
(18) |
% |
17,193 |
|
23,957 |
|
(28) |
% |
| Lead sold ('000 lb) (1) |
3,158 |
|
9,371 |
|
(66) |
% |
14,903 |
|
24,119 |
|
(38) |
% |
| Zinc produced ('000 lb) (1) |
2,932 |
|
3,007 |
|
(2) |
% |
6,988 |
|
8,392 |
|
(17) |
% |
| Zinc sold ('000 lb) (1) |
1,898 |
|
3,067 |
|
(38) |
% |
6,039 |
|
14,072 |
|
(57) |
% |
| |
|
|
|
|
|
|
| Total material mined (kt) |
2,750 |
|
3,244 |
|
(15) |
% |
5,696 |
|
12,282 |
|
(54) |
% |
| Waste removed (kt) |
2,440 |
|
2,725 |
|
(10) |
% |
4,879 |
|
10,839 |
|
(55) |
% |
| Strip ratio |
7.9 |
|
5.3 |
|
49 |
% |
6.0 |
|
7.5 |
|
(20) |
% |
| |
|
|
|
|
|
|
| Ore milled (kt) |
416 |
|
400 |
|
4 |
% |
1,118 |
|
1,394 |
|
(20) |
% |
| Silver mill feed grade (g/t) |
170 |
|
174 |
|
(2) |
% |
164 |
|
184 |
|
(11) |
% |
| Lead mill feed grade (%) |
0.78 |
|
0.99 |
|
(21) |
% |
0.77 |
|
0.89 |
|
(13) |
% |
| Zinc mill feed grade (%) |
0.52 |
|
0.63 |
|
(17) |
% |
0.51 |
|
0.54 |
|
(6) |
% |
| Silver recovery (%) |
95.2 |
|
95.1 |
|
- |
% |
94.6 |
|
93.2 |
|
2 |
% |
| Lead recovery (%) |
90.8 |
|
91.9 |
|
(1) |
% |
90.2 |
|
85.8 |
|
5 |
% |
| Zinc recovery (%) |
61.4 |
|
54.3 |
|
13 |
% |
55.5 |
|
49.2 |
|
13 |
% |
| |
|
|
|
|
|
|
| Average realized silver price ($/oz) |
$ |
24.78 |
|
$ |
17.32 |
|
43 |
% |
$ |
21.23 |
|
$ |
16.26 |
|
31 |
% |
| |
|
|
|
|
|
|
| Cash costs ($/oz silver sold) (2) |
$ |
8.92 |
|
$ |
8.90 |
|
- |
% |
$ |
11.43 |
|
$ |
10.38 |
|
10 |
% |
| AISC ($/oz silver sold) (2) |
$ |
15.90 |
|
$ |
11.18 |
|
42 |
% |
$ |
15.22 |
|
$ |
14.06 |
|
8 |
% |
| |
|
|
|
|
|
|
| Financial Data ($000s) |
|
|
|
|
|
|
| Revenue |
$ |
27,078 |
|
$ |
51,263 |
|
(47) |
% |
$ |
102,525 |
|
$ |
145,389 |
|
(29) |
% |
| Production costs |
$ |
11,822 |
|
$ |
29,424 |
|
(60) |
% |
$ |
60,317 |
|
$ |
97,558 |
|
(38) |
% |
| Depreciation and depletion |
$ |
2,634 |
|
$ |
6,924 |
|
(62) |
% |
$ |
15,665 |
|
$ |
17,498 |
|
(10) |
% |
| Income from mine operations |
$ |
12,622 |
|
$ |
14,915 |
|
(15) |
% |
$ |
26,543 |
|
$ |
30,333 |
|
(12) |
% |
| Exploration, evaluation and reclamation expense |
$ |
(2,337) |
|
$ |
492 |
|
(575) |
% |
$ |
(2,144) |
|
$ |
786 |
|
(373) |
% |
| Capital expenditures |
$ |
6,480 |
|
$ |
5,557 |
|
17 |
% |
$ |
17,690 |
|
$ |
33,819 |
|
(48) |
% |
| (1) | Data for lead production and sales relate only to lead in lead concentrate. Data for zinc production
and sales relate only to zinc in zinc concentrate. |
| (2) | The Company reports the non-GAAP financial measures of cash costs and AISC per ounce of silver
sold to manage and evaluate operating performance at Puna. For further information, please refer to “Non-GAAP Financial Measures”
in Section 13. |
SSR Mining Inc. | MD&A Q4 2020 | 18 |
Full Year and Fourth Quarter 2020 Operating
and Financial Results
Production
On
March 20, 2020, Puna temporarily suspended operations as a result of government-mandated restrictions due to the COVID-19 pandemic.
Subsequently, the Government of Argentina reinstated mining as an essential business activity. During the second quarter of 2020,
a phased restart complying with government regulations and guidelines was implemented with the recommencement of mining, hauling
and milling operations. During the third quarter of 2020, COVID-19 infection rates in the Province of Jujuy escalated, resulting
in further interruptions to operations. In September, operations were suspended in order to manage camp occupancy, conduct testing
and reduce the risk of transmission. Due to the significant ore stockpiles at Puna, milling operations were prioritized over mining
operations through restarts. As a result, tonnes mined in the third quarter of 2020 were impacted due to COVID-19 related interruptions.
Mining and milling activities were operating at expected levels by the beginning of October 2020.
During
the fourth quarter of 2020, Puna produced 2.2 million ounces of silver, a 2%
increase compared to the fourth quarter of 2019, due to higher tonnage milled at modestly
lower grades. Lead and zinc production decreased 18% and 2% respectively, due to lower base metal head grades with zinc benefiting
from a significant increase in recovery due to achieving finer ore grind. Ore milled was
0.4 million tonnes, a 4% increase compared to the fourth quarter of 2019 due
to an increase in throughput and shorter shutdowns for scheduled maintenance. Processed ore
contained an average silver grade of 170 g/t, a 2% decrease compared to the fourth
quarter of 2019, which was in-line with the mine plan. The mill averaged approximately
4,517 tonnes per day during the fourth quarter of 2020, demonstrating an improved performance on plant throughput and tailings
pumping system capacity achieved through continuous improvements.
For
the year ended December 31, 2020, Puna produced 5.6 million ounces of silver, a 27% decrease compared to the year ended December
31, 2019, due to the temporary suspension of operations in response to COVID-19 during the second and third quarters of 2020. Lead
and zinc production was similarly affected by the COVID-19 related shutdowns. Ore milled was 1.1 million tonnes, a 20% decrease
compared to the year ended December 31, 2019, also as a result of COVID-19 related shutdowns. Processed ore contained an average
silver grade of 164 g/t, an 11% decrease compared to the year ended December 31, 2019, but in-line with the mine plan.
Revenue
Revenue decreased by 47% in the fourth
quarter of 2020 compared to the fourth quarter of 2019, due to a 61% decrease in silver ounces sold, partially offset by a 43%
increase in the average realized silver price. Sales in the fourth quarter and for the year ended December 31, 2020 were significantly
below production due to the normal transport and refining cycles associated with ramp-up after the COVID-19 related shutdowns.
Revenue decreased by 29% for the year ended
December 31, 2020 compared to the year ended December 31, 2019, due to a 39% decrease in silver ounces sold as a result of the
COVID-19 operational shutdowns, partially offset by a 31% increase in the average realized silver price.
Operating Costs
Cash costs and AISC per ounce
of silver sold are non-GAAP financial measures. Please see the discussion under "Non-GAAP Financial Measures" in Section
13.
In the fourth quarter of 2020, cash costs
per ounce of silver sold were $8.92, consistent with the fourth quarter of 2019.
In the fourth quarter of 2020, AISC per
ounce of silver sold was $15.90, an increase of 42% compared to the fourth quarter of 2019. The increase in AISC was primarily
due to higher capital expenditures per silver ounce sold, driven by silver ounces sold well below production due to normal ramp-up
times for shipping and selling concentrates.
SSR Mining Inc. | MD&A Q4 2020 | 19 |
For the year ended December 31, 2020, cash
costs per ounce of silver sold were $11.43, an increase of 10% compared to the year ended December 31, 2019, primarily due to higher
mining unit costs, offset by lower processing and general and administrative unit costs as a result of higher average daily plant
throughput and the positive impact of the renegotiation of the natural gas contract. Mining costs were higher due to operating
inefficiencies through shutdown and start-up phases and an increase in maintenance work performed during the temporary suspensions.
For the year ended December 31, 2020, AISC
per ounce of silver sold was $15.22, an increase of 8% compared to the year ended December 31, 2019, due to higher cash costs per
ounce sold, offset partially by lower sustaining capital expenditures, mainly due to lower deferred stripping costs and the deferral
of capital projects due to impacts of COVID-19.
| 7. | EXPLORATION AND DEVELOPMENT |
The
Company holds a portfolio of prospective exploration tenures across Turkey, the USA, Canada, Mexico and Peru both near or adjacent
to the existing operations (near-mine) and greenfield standalone prospects. The Company continues exploring both near-mine and
greenfield prospects with a focus on the near-mine targets. Near-mine expansion projects can leverage existing mine infrastructure
and capability to generate lower cost, faster development opportunities.
Çöpler
District Exploration
The
Company takes a disciplined approach to exploration at the Çöpler District, optimizing the historical exploration database,
remapping and reinterpreting data, and judiciously drill testing new targets.
A
primary focus in the Çöpler District is to fast-track exploration of oxide ore to take advantage of spare oxide plant
capacity.
The
Çöpler Saddle prospect and the Ardich and Çakmaktepe deposits represent the priorities as near-mine development
projects with potential to add to the Company’s production profile within the next two to three years.
Çöpler
(80% owned)
The
operating mine is the center for district exploration activities, with established infrastructure for treating both oxide and sulfide
gold ores.
Commencing
in 2017, a Çöpler in-pit exploration program successfully provided additional oxide ore to the processing facilities.
The in-pit exploration program is ongoing, targeting both oxide and sulfide ore. Recently, the in-pit exploration program identified
the possibility of a copper-gold porphyry system below the Main pit. Designated C2, drill testing of the target commenced at the
end of the second quarter of 2020 and continued through the third quarter. Initial drill results are encouraging and are described
in detail below.
C2
Porphyry Copper-Gold (80% owned)
The
C2 target lies directly below the Main pit of the Çöpler mine. In 2020, four diamond drill holes were completed along
a line of approximately 730 meters, with all holes intersecting gold-rich copper porphyry mineralization. Chalcopyrite is visible
in the drill core with mineralization starting at or close to the bottom of the currently defined Çöpler Main pit.
Some
of the newly discovered porphyry intrusive has been exposed in parts of the lower benches. The porphyry has well-developed stockwork
and sheeted sulfide-quartz veins. Where exposed in the pit benches, these veins are locally overprinted by thicker quartz-sericite-sulfide
veins. The copper mineralization is predominantly chalcopyrite formed as disseminations in the matrix and as thin veins associated
with quartz accompanied with rare molybdenite mineralization. There is elevated arsenic in some zones, but this does not seem to
be directly correlated to the copper mineralization. The gold mineralization is not visible.
SSR Mining Inc. | MD&A Q4 2020 | 20 |
| 7. | EXPLORATION AND DEVELOPMENT (continued) |
In
2020, the Company drilled eleven diamond core holes totaling 5,379 meters, with results of the first four holes announced in a
news release dated November 25, 2020.
Significant
results were returned from the initial four holes:
| • | CDD955 returned
0.74% CuEq(1) over 241.5 meters from 37 meters, and 0.42% CuEq(1) over 166.2 meters from 287.5 meters. |
| • | CDD935 returned
0.86% CuEq(1) over 108.6 meters from 103.1 meters. |
| • | CDD940 returned
0.71% CuEq(1) over 81.5 meters from 271.2 meters. |
| • | CDD947 returned
1.14% CuEq(1) over 49.6 meters from 156.9 meters,1.20% CuEq(1) over 18.4 meters from 237.8 meters, and 0.30%
CuEq(1) over 127.7 meters from 303.3 meters. |
| (1) | Copper equivalent calculated as CuEq = [Cu ppm + ((Au ppm*Au
price(g) / Cu price(g)) /10,000)]. Based upon metal prices of $1,750/oz gold and $3.00/pound copper with recovery assumed to be
100% as no metallurgical test work has been completed. CuEq will change proportionally to the metal’s relative recoveries
once metallurgical test work is complete. Intervals reported are sections with more than 0.2%CuEq (and a minimum 0.1%Cu) and less
than of 5 meters contiguous dilution. |
Metallurgical
test work commenced at a contract laboratory in Canada on C2 diamond drill core samples. Preliminary indications from the metallurgical
flotation test work is encouraging. The Company is currently drilling with three diamond drill rigs and plans to increase the number
of rigs to nine in the first quarter of 2021.
Ardich
Gold Deposit (80% owned)
The
Ardich gold deposit is six kilometers northeast of the Çöpler processing facilities and is accessible by the nearby
haul road to Çakmaktepe. The deposit mostly forms a tabular flat-lying gold-rich oxide and sulfide zone at the contact between
an overlying assemblage of ultramafic rocks and underlying clastic and limestone rock types. The deposit is predominantly oxide
mineralization.
A
total of 175 drill holes were included in the maiden Ardich Mineral Resource estimate announced November 22, 2019. Since the cut-off
date for the November 2019 Mineral Resource, data has been obtained for an additional 129 drill holes for a total of 304 drill
holes. Based on the additional drill data, the Company provided an updated Ardich Mineral Resource estimate on November 30, 2020
within the CDMP2020, a summary of which is provided in the table below .
The
CDMP20 includes an alternative PEA case including the development of Ardich.
Drilling
continues at Ardich as the Mineral Resource remains open for expansion. Subsequent to the November 2020 Mineral Resource estimate
published in the Technical Report which included drilling data up to February 2020, a total of 147 additional diamond drill holes
totaling 35,147 meters have been drilled in the Ardich project. Development work including additional technical studies and permitting
also continues.
| Mineral Resource Estimate for the Ardich Deposit (as at the Effective Date) |
| Material Type |
Resource Category Material |
Tonnes (kt) |
Au (g/t) |
Contained Gold (koz) |
| Oxide (LS+HS) |
Measured |
4,707 |
1.63 |
246 |
| Indicated |
12,817 |
1.62 |
666 |
| Measured + Indicated |
17,524 |
1.62 |
912 |
| Inferred |
4,713 |
1.62 |
246 |
| Sulfide |
Measured |
695 |
2.56 |
57 |
| Indicated |
2,231 |
3.71 |
266 |
| Measured + Indicated |
2,926 |
3.43 |
323 |
| Inferred |
782 |
4.24 |
107 |
| Total |
Measured |
5,402 |
1.75 |
303 |
| Indicated |
15,048 |
1.93 |
932 |
| Measured + Indicated |
20,451 |
1.88 |
1,235 |
| Inferred |
5,495 |
1.99 |
352 |
SSR Mining Inc. | MD&A Q4 2020 | 21 |
| 7. | EXPLORATION AND DEVELOPMENT (continued) |
1.
Mineral Resources for Adrich have an effective date of 27 November 2020 and have been prepared in accordance with National Instrument
43-101 - Standards of Disclosure for Mineral Projects (“NI 43-101”). The Mineral Resources estimate for Ardich has
been prepared by Sharron Sylvester, BSc (Geol), RPGeo AIG (10125), employed by OreWin Pty Ltd as Technical Director - Geology,
a qualified person as defined under NI 43-101. All key assumptions, parameters and methods used to estimate Mineral Resources for
Ardich and the data verification procedures followed are set out in the CDMP 2020.
2.
Mineral Resources that are not Mineral Reserves have not demonstrated economic viability.
3.
Due to the uncertainty that may be attached to Inferred Mineral Resources, it cannot be assumed that all or any part of an Inferred
Mineral Resource will be upgraded to an Indicated or Measured Mineral Resource as a result of continued exploration.
4.
Mineral Resources are shown on a 100% basis. More than 96% of the Mineral Resources are located on the SSR Mining owned 80% ground,
with the remainder of the mineralization within the 50%/50% ownership boundary.
5.
Low-sulfur (LS) oxide is defined as material with <1% total sulfur, high-sulfur (HS) oxide is material with total sulfur >1%
and <2%, and sulfide material has ≥2% total sulfur.
6.
All Mineral Resources in the CDMP 2020 were assessed for reasonable prospects for eventual economic extraction by reporting only
material that fell within conceptual pit shells based on metal prices of $1,750/oz for gold. The following parameters were used:
metallurgical recoveries in oxide 40.0%-73.0%, and in sulfide 82.9%; Au cut-off grades in oxide 0.30-0.55 g/t Au, and in sulfide
0.77 g/t Au, (there are no credits for Ag or Cu in the cut-off grade calculations); allowances have been made for royalty payable.
7.
Reported Mineral Resources contain no allowances for unplanned dilution, or mining recovery. Tonnage and grade measurements are
in metric units. Contained gold is reported in troy ounces.
8. Tonnages are
rounded to the nearest thousand tonnes; grades are rounded to two decimal places. As a result, totals may not match.
Çöpler
Saddle (80% owned)
The
Saddle prospect borders the western flank of Çöpler as a two kilometer long north-south shear zone passing through
West pit.
Çakmaktepe Mine
(50% owned)
Çakmaktepe
lies five kilometers east of the Çöpler processing infrastructure. In 2019, Phase 1 was mined. Exploration is investigating
continuity to Ardich, which is immediately adjacent to the northeast of Çakmaktepe.
The Mavialtin Porphyry
Belt (50% owned by SSR Mining)
The
Mavialtin Porphyry Belt contains at least four gold-copper porphyry type exploration targets over a seven by 20 kilometer area
from Çakmaktepe in the north to the deposit at Mavidere in the south. In February 2020, positive drill results were announced
for Mavidere, Findiklidere, and Aslantepe. The mineralization is close to surface and appears to be low in deleterious elements.
The
exploration strategy for Mavialtin is two-fold:
| • | Expand the known areas of mineralization,
while concurrently making new discoveries, to economically justify a stand-alone mine; and/or |
| • | Define a Mavialtin Complex where various
smaller deposits could be processed through a central facility. |
Mavialtin’s developmental potential
and optionality are supported by:
| • | Proximity to existing Çöpler
operations/infrastructure; |
| • | Near-surface nature of the mineralization; |
| • | Length of the mineralized intercepts which
indicate the potential for volume; and |
| • | Some high-grade intercepts. |
Based
on the results announced in February 2020, additional mapping and geochemistry, the Company drilled five diamond core holes totaling
2,122 meters in Findiklidere and drilled three diamond core holes totaling 1,384 meters in Saridere Prospects between July 2020
and October 2020.
SSR Mining Inc. | MD&A Q4 2020 | 22 |
| 7. | EXPLORATION AND DEVELOPMENT (continued) |

Copper
Hill Copper Exploration Prospect (50% owned)
In
April 2020, the Company announced encouraging drill results from the Copper Hill exploration prospect in the Black Sea region (northeast
Turkey). The intercepts were high grade, close to surface and appear to be very low in contaminates. The drilling pattern was constrained
to areas previously permitted for drilling. Additional diamond drilling planned in 2020, to test the extension of the mineralization,
was deferred due to COVID-19 related issues and is now planned for the 2021 summer drill season.
Marigold Exploration
An
important focus of the 2020 exploration program was to identify new Mineral Resources on 11,740 hectares of adjoining mineral tenures
that were acquired between 2015 and 2019.
At
Valmy, there are three historic open pits mined by previous owners between 2002 and 2005, which produced approximately 196,000
ounces of gold. The Company has been expanding Mineral Resources around these pits since acquisition in 2015.
At
Trenton Canyon, there is a historical Mineral Resource area and three mined pits developed by previous owners between 1996 and
2005, which produced approximately 290,000 ounces of gold. Since acquisition in 2019, the Company has been conducting exploration
to confirm the historic drill database validity and expand known mineralization areas. The main objective is to define an open-pit
oxide gold Mineral Resource amenable to heap leach processing.
SSR Mining Inc. | MD&A Q4 2020 | 23 |
| 7. | EXPLORATION AND DEVELOPMENT (continued) |
At
Buffalo Valley, predecessor companies mined a small open pit, which produced approximately 50,000 ounces of gold between 1987 and
1990. Following acquisition in mid-2019, the Company has focused on verifying historical information and assessing the potential
for oxide gold Mineral Resources.
A
focus for the Company is to increase gold production at Marigold by defining Mineral Resources to support additional stand-alone
heap leach facilities in the North Peak area. In 2020, Marigold tested areas south of the currently producing Mackay Pit including
Valmy, Crossfire, East Basalt, Section 6 and Trenton Canyon. As a result of land acquisitions, the Company is exploring the opportunity
for a larger pit concept, encompassing East Basalt, Antler, Battle Cry and Section 6, which the Company refers to as New Millennium.
In total, 15,185 meters of reverse circulation drilling in 48 holes and 1,055 meters of core drilling in 1 hole were completed
in the fourth quarter of 2020. During 2020, a total of 72,788 meters were completed in 208 drill holes.
The
Company completed 17.6 kilometers of seismic geophysical survey in two lines; one east-west transect, crossing just south of the
Basalt and Antler open pits, and a north-south line the length of the Marigold deposits and onto the Trenton Canyon ground. Once
compiled, the Company expects to validate the interpretation with the current core drilling results that have identified the favorable
Comus Formation. This work aims to establish a method of mapping the 3D structure of the main rock assemblages beneath the entire
property to identify targets with potential for higher-grade sulfide mineralization.
SSR Mining Inc. | MD&A Q4 2020 | 24 |
| 7. | EXPLORATION AND DEVELOPMENT (continued) |
In
the fourth quarter of 2020, a soil sampling program was initiated at the Trenton Canyon property. A total of 14.5 square kilometers
of coverage is planned, with samples collected in a 61 meter staggered grid pattern for 3,854 total samples. In the fourth quarter
of 2020, the Company completed approximately 1.5 square kilometers, collecting 395 samples. This program is expected to be completed
in the first quarter of 2021, weather permitting. The soil survey covers an area of ground east of the Trenton Canyon mine extending
to the tenement boundary where there is no historic surface geochemical coverage. Anomalous gold and pathfinder concentrations
in soil strongly correlate to known mineral centers at Trenton Canyon, and anomalies identified by the new survey will be evaluated
for future exploration campaigns.
For
2021, the Company is planning 71,450 meters of reverse circulation and core drilling for Mineral Resource and Mineral Reserve conversion
and additions at Mackay, Valmy, New Millennium, Trenton Canyon, and Buffalo Valley.
Canada Exploration
The
Company controls two separate claim groupings in Saskatchewan, Canada: Seabee and the Amisk project, which is 140 kilometers southeast
of Seabee.
Seabee
The
Seabee mineral interests comprise 100%-owned mineral tenures that are referred to as Seabee claims and an 80% owned joint venture
interest on the contiguous Fisher property. Through late 2020 and early 2021, Seabee exercised its option to acquire 80% of the
Fisher property and establish a joint venture, with Seabee being the operator, to advance exploration and development. Exploration
activities in 2020, particularly at Fisher and other Seabee brownfield targets, were impacted as the mine shut down and then reduced
ancillary activities due to COVID-19.
At
Santoy, recent exploration success on Gap Hanging Wall ("Gap HW") encouraged the Company to establish underground access
to the zone on the 46 level, which is 450 meters below surface. Gap HW has excellent potential to provide additional ore feed and
is approximately 220 meters in the 8A mining area's hanging wall. Sheeted quartz veins in siliceous intrusive rock host gold mineralization
at Gap HW, and the metallurgy is similar to other ores from Santoy.
The
first excavation in the Gap HW was completed in the fourth quarter of 2020. A total of 12,470 tonnes of mineralized material was
removed, with results reconciling closely to the Company’s block model estimates in this part of the orebody. In addition,
the excavation provided the Company with geotechnical, structural and grade continuity determinations critical for mine design.
A mobile drill rig is currently drilling tightly spaced holes into the foot wall and hanging wall of the current excavation to
further determine grade continuity across the entire width of the zone and enhance future block model estimates, development drives
and stope design initiatives. This program is intended to confirm structural interpretation, continuity and grades as part of the
technical work to convert Mineral Resources to Mineral Reserves.
The
focus of drilling efforts for the fourth quarter of 2020 remained on infill and extension drilling of the Gap HW, as well as exploring
the prospective Santoy Hanging Wall (Santoy HW) target. During the fourth quarter of 2020, the Company drilled 9,606 meters underground
and an additional 3,887 meters from surface for a combined total of 13,493 meters. During 2020, the Company completed 39,855 meters
of drilling underground and 9,638 meters from surface for a total of 49,493 meters.
In
the first quarter of 2020, brownfield exploration drilling approximately 1 kilometer south of the Santoy Mine Complex encountered
high-grade gold mineralization at the Joker target. The sheeted quartz veins are hosted in the same siliceous intrusive rocks as
the Gap HW deposit and represent an encouraging new target to be followed-up in 2021.
SSR Mining Inc. | MD&A Q4 2020 | 25 |
| 7. | EXPLORATION AND DEVELOPMENT (continued) |
The
Fisher property is contiguous to Seabee claims and, in May 2020, the Company reported encouraging drill results from gold prospects
at Mac North, Yin and Abel Lake. In the fourth quarter of 2020, the Company completed a 3,500 meter drill program at the Mac North
target and was successful in expanding the zone down-plunge and along strike, encountering wider visible gold-bearing zones than
previous drilling. In total, the Company drilled 37 holes for 12,976 meters at Fisher in 2020. These targets will be further explored
in 2021.
Amisk
The
Amisk property is 39,882 hectares and hosts an Indicated Mineral Resource estimate. Proterozoic volcano-sedimentary rock assemblages,
prospective for both base metal massive sulfide deposits and orogenic gold deposits, underlie the area. The Company’s plan
for this property is to investigate its potential for lode gold mineralization on the claim's western portion. The summer field
program comprised detailed mapping and prospecting of the numerous gold showings on the property.
Metal Prices
The market prices of gold
and silver are key drivers of the Company's profitability. The price of gold can fluctuate widely and is affected by a number of
macroeconomic factors, including global or regional consumption patterns, the supply of, and demand for gold, interest rates, exchange
rates, inflation or deflation, global economic conditions resulting from the COVID-19 pandemic, and the political and economic
conditions of major gold-producing and gold-consuming countries throughout the world. Importantly, the price of gold can be impacted
by its role as a safe haven during periods of market turmoil and as defense against the perceived inflationary impacts and currency
depreciation caused by the responses of governments and central banking authorities to the economic threats caused by the COVID-19
pandemic.
During 2020, the gold price
increased steadily, reaching an all-time high in August of $2,067 per ounce and moderating to levels near $1,850 per ounce in the
latter part of the year. Throughout the year, the positive trend for precious metal prices was largely supported by continued uncertainty
surrounding the COVID-19 pandemic, increased precious metals ETF demand, and the persistence of nearly zero percent interest rates
maintained by the major central banks to aid the stabilization of the global economy and financial markets, combined with large
fiscal economic support packages, perceived as inflationary. The price of silver exhibited more volatility compared to gold, due
to a smaller, less liquid silver market and concerns driven by an annual decline in silver production, primarily as a result of
COVID-19 related suspensions or shut-downs of mining operations.
During the fourth quarter
of 2020, the price of gold, based on the London Bullion Market Association ("LBMA") gold PM Fix price, traded between
$1,763 per ounce and $1,941 per ounce. The quarterly average of $1,874 per ounce was $35 per ounce, or 2%, lower than the average
of $1,909 per ounce in the third quarter of 2020 and $393 per ounce, or 27%, higher than the average of $1,481 per ounce in the
fourth quarter of 2019. During 2020, the price of gold averaged $1,770 per ounce, which was $377 per ounce, or 27%, higher than
the 2019 annual average of $1,393 per ounce.
SSR Mining Inc. | MD&A Q4 2020 | 26 |
| 8. | MARKET OVERVIEW (continued) |
During the fourth quarter
of 2020, the price of silver, based on the LBMA silver price, traded between $22.15 per ounce and $26.49 per ounce. The quarterly
average of $24.39 per ounce was 1% higher compared to the average of $24.26 per ounce in the third quarter of 2020 and 41% higher
compared to the average of $17.32 per ounce in the fourth quarter of 2019. During 2020, the price of silver averaged $20.55 per
ounce, 27% higher than the 2019 annual average of $16.21 per ounce.

During the fourth quarter
of 2020, gold oscillated, within a range of nearly $200, around $1,875 per ounce. Key factors impacting gold price during the quarter
included the U.S. Presidential elections and continued news on COVID-19 vaccines mixed with uncertainty and renewed economic lock-downs
related to a second wave of COVID-19 cases. During the fourth quarter, the silver price tracked the gold price with significantly
reduced volatility compared to the third quarter.
Currency Markets
Turkish Lira
The Turkish Lira (“TRY”)
closed 2020 at 7.43 TRY per one U.S. dollar ("USD"), representing a 4% appreciation of the currency from the beginning
of the fourth quarter rate of 7.75 TRY per one USD and a 25% devaluation from the beginning of the full year 2020 rate of 5.95
TRY per one USD.
The average foreign exchange
rate during the fourth quarter of 2020 was 7.86 TRY per one USD compared to 7.23 TRY per one USD in the third quarter of 2020.
The average foreign exchange rate during 2020 was 7.02 TRY per one USD compared to a 5.68 TRY per one USD average rate during 2019,
representing an annualized devaluation of 24%. In November 2020, the TRY reached a record low level against the USD of 8.52 TRY
per one USD amid concerns of sharply negative real interest rates, continued high inflation, despite central bank actions to tighten
policy, and significant depletion of foreign currency reserves. During the fourth quarter of 2020, interest rates were increased
to 17%, which brought support to the currency.
SSR Mining Inc. | MD&A Q4 2020 | 27 |
| 8. | MARKET OVERVIEW (continued) |
While a weaker Turkish
currency is generally positive for the Company's Çöpler mine operating costs, the Company expects Turkish inflation
rates to be higher in response which would largely offset the currency devaluation benefits. The weakening currency also impacts
the USD value of assets denominated in TRY. The Company currently does not hedge its exposure to TRY.

Canadian Dollar
During 2020, the Canadian
dollar ("CAD") performance was impacted largely by shifts in broad risk factors, such as steady oil prices and a weaker
USD, rather than Canada-specific factors. The central bank continued to provide monetary policy stimulus as needed to support the
economic recovery targets that arose from negative impacts of the COVID-19 pandemic on the country.
The CAD closed 2020 at
$1.27 per one USD, representing a 5% appreciation of the currency from the beginning of the fourth quarter rate of $1.33 CAD per
one USD and a 2% appreciation from the beginning of the full year 2020 rate of $1.30 CAD per one USD. The average foreign exchange
rate during the fourth quarter of 2020 was $1.30 CAD per one USD compared to $1.33 CAD per one USD in the third quarter of 2020,
representing an annualized appreciation of 2%. The average foreign exchange rate during 2020 was $1.34 CAD per one USD compared
to $1.33 CAD per one USD average rate during 2019, representing a devaluation of 1%.
During the fourth quarter
of 2020, the Canadian economy continued to experience growth due to significant fiscal stimulus along with increased oil prices
as global production climbed. Further, the USD remained under pressure as the global equity markets experienced underlying bullish
investor sentiment and, therefore, contributed to the CAD strengthening. Approaching the close of the year, concerns of a new faster-spreading
variant of coronavirus and potential tightening of lock-down and/or travel restrictions resulted in dampening of a fuel demand
recovery.

SSR Mining Inc. | MD&A Q4 2020 | 28 |
| 8. | MARKET OVERVIEW (continued) |
Argentine Peso
During 2020, the Argentine
peso ("ARS") experienced a 40% devaluation since the start of the year due to increased economic pressure, resulting
from perceived government inaction to stabilize the economy, reduced foreign investments, GDP contraction and higher unemployment
rates, which is largely related to the COVID-19 pandemic restrictions. The Company currently does not hedge its exposure to ARS.
The ARS closed 2020 at
ARS 84 per one USD, representing a 11% devaluation of the currency from the beginning of the fourth quarter rate of ARS 76 per
one USD and a 40% devaluation from the beginning of the full year 2020 rate of ARS 60 per one USD. The average foreign exchange
rate during the fourth quarter of 2020 was ARS 80 per one USD compared to ARS 73 per one USD in the third quarter of 2020 representing
an annualized decline of 10%.The average foreign exchange rate during 2020 was ARS 71 per one USD compared to ARS 48 per one USD
average rate during 2019, representing an annualized decline of 48%.
During the fourth quarter
of 2020, the ARS experienced a weakening of 10% as economic growth remained weak and inflation remained high. Government negotiations
with the International Monetary Fund for repayment of Argentine debt and possible restructuring of local-issued provincial debt
are a cause for further uncertainty.
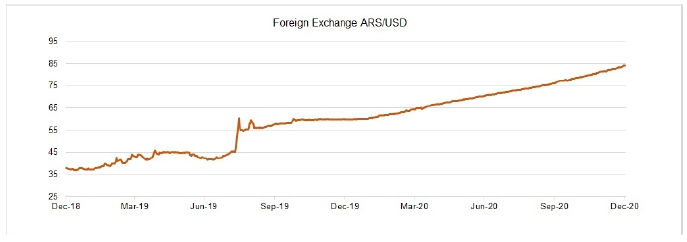
SSR Mining Inc. | MD&A Q4 2020 | 29 |
| 8. | MARKET OVERVIEW (continued) |
Commodity Markets
Diesel fuel is a significant
operating cost at the Company's mines. Diesel is obtained through the distillation of crude oils, of which the West Texas Intermediate
("WTI") is the main pricing benchmark in North America and the Brent Crude oil ("Brent") is the main pricing
benchmark for the Atlantic basin and Eurasia. The average WTI oil price in the fourth quarter of 2020 was $43 per barrel, a 5%
increase compared to $41 per barrel in the third quarter of 2020. In 2020, the WTI oil price averaged $39 per barrel, compared
to $57 per barrel in 2019, a 32% decline. The average Brent oil price in the fourth quarter of 2020 was $45 per barrel, a 5% increase
compared to $43 per barrel in the third quarter of 2020. In 2020, the Brent oil price averaged $43 per barrel, compared to $64
per barrel in 2019, a 33% decline.
During 2020, oil prices
declined significantly compared to 2019 as a result of continued uncertainty surrounding the COVID-19 pandemic and the negative
implications of the global economic lock-downs and travel restrictions on prolonged weakness in oil demand, coupled with OPEC+
oversupply and periods of limited U.S. oil storage.
During the fourth quarter
of 2020, oil prices were supported by the U.S. Presidential elections outcome and its potential implications on foreign policy,
continued positive news on COVID-19 vaccines, and additional U.S. fiscal stimulus, offset by the uncertainty and renewed economic
lock-downs related to a second wave and a new strain of the COVID-19 virus and the decision by OPEC+ to increase production.
To mitigate against oil
price volatility, Marigold and Seabee manage a portion of their diesel price risk through hedging activity, with hedges in place
through 2022.

SSR Mining Inc. | MD&A Q4 2020 | 30 |
The following table sets out selected
financial results for each of the eight most recently completed quarters, expressed in millions of US dollars, except per share
and per ounce amounts:
| |
Q4 2020 |
Q3 2020 |
Q2 2020 |
Q1 2020 |
Q4 2019 |
Q3 2019 |
Q2 2019 |
Q1 2019 |
| Revenue |
$ |
370.7 |
|
$ |
225.4 |
|
$ |
92.5 |
|
$ |
164.5 |
|
$ |
177.6 |
|
$ |
147.8 |
|
$ |
155.1 |
|
$ |
126.3 |
|
| Income from mine operations |
$ |
146.5 |
|
$ |
83.2 |
|
$ |
34.2 |
|
$ |
44.8 |
|
$ |
58.9 |
|
$ |
51.9 |
|
$ |
29.8 |
|
$ |
30.2 |
|
| Gross margin (1) |
40 |
% |
37 |
% |
37 |
% |
27 |
% |
33 |
% |
35 |
% |
19 |
% |
24 |
% |
| Income (loss) before income tax |
$ |
110.7 |
|
$ |
49.2 |
|
$ |
(8.5) |
|
$ |
30.0 |
|
$ |
31.1 |
|
$ |
33.0 |
|
$ |
13.1 |
|
$ |
8.9 |
|
| Net income (loss) |
$ |
97.7 |
|
$ |
25.1 |
|
$ |
(6.3) |
|
$ |
24.0 |
|
$ |
19.5 |
|
$ |
18.1 |
|
$ |
12.4 |
|
$ |
5.7 |
|
| Attributable net income (loss) to equity holders of SSR Mining |
$ |
89.0 |
|
$ |
26.8 |
|
$ |
(6.3) |
|
$ |
24.0 |
|
$ |
19.5 |
|
$ |
20.7 |
|
$ |
10.6 |
|
$ |
6.5 |
|
| |
|
|
|
|
|
|
|
|
| Basic attributable net income (loss) per share |
$ |
0.41 |
|
$ |
0.19 |
|
$ |
(0.05) |
|
$ |
0.19 |
|
$ |
0.16 |
|
$ |
0.17 |
|
$ |
0.09 |
|
$ |
0.05 |
|
| Diluted attributable net income (loss) per share |
$ |
0.39 |
|
$ |
0.19 |
|
$ |
(0.05) |
|
$ |
0.19 |
|
$ |
0.16 |
|
$ |
0.17 |
|
$ |
0.09 |
|
$ |
0.05 |
|
| |
|
|
|
|
|
|
|
|
| Gold equivalent ounces sold (2) |
194,862 |
|
115,312 |
|
51,559 |
|
104,715 |
|
114,268 |
|
95,112 |
|
112,022 |
|
93,452 |
|
| |
|
|
|
|
|
|
|
|
| Average realized gold price ($/oz) (3) |
$ |
1,880 |
|
$ |
1,914 |
|
$ |
1,722 |
|
$ |
1,597 |
|
$ |
1,480 |
|
$ |
1,480 |
|
$ |
1,314 |
|
$ |
1,303 |
|
| Average realized silver price ($/oz) (3) |
$ |
24.78 |
|
$ |
26.69 |
|
$ |
15.45 |
|
$ |
17.47 |
|
$ |
17.32 |
|
$ |
17.31 |
|
$ |
14.92 |
|
$ |
15.35 |
|
| |
|
|
|
|
|
|
|
|
| Cash and cash equivalents |
$ |
860.6 |
|
$ |
733.6 |
|
$ |
461.7 |
|
$ |
398.4 |
|
$ |
503.6 |
|
$ |
474.5 |
|
$ |
452.2 |
|
$ |
461.4 |
|
| Total assets |
$ |
5,245.0 |
|
$ |
5,081.1 |
|
$ |
1,634.7 |
|
$ |
1,612.0 |
|
$ |
1,750.1 |
|
$ |
1,688.4 |
|
$ |
1,650.2 |
|
$ |
1,607.1 |
|
| Working capital (4) |
$ |
1,175.6 |
|
$ |
1,007.9 |
|
$ |
662.9 |
|
$ |
646.6 |
|
$ |
665.5 |
|
$ |
636.3 |
|
$ |
599.7 |
|
$ |
616.8 |
|
| Non-current liabilities |
$ |
1,056.2 |
|
$ |
1,046.0 |
|
$ |
394.7 |
|
$ |
377.3 |
|
$ |
382.0 |
|
$ |
374.7 |
|
$ |
370.2 |
|
$ |
360.8 |
|
| (1) | Gross margin is defined as income from mine operations divided by revenue. |
| (2) | Gold equivalent ounces have been established using the average realized metal prices per ounce
of precious metals sold in the period and applied to the recovered silver metal content produced by the mines. Zinc and lead production
are not included in gold equivalent ounces produced. |
| (3) | The Company reports the non-GAAP financial measures of average realized metal prices per ounce
of precious metals sold to manage and evaluate operating performance at its mines. For a better understanding of these measures,
please refer to “Non-GAAP Financial Measures” in Section 13. |
| (4) | Working capital is defined as current assets less current liabilities. |
The volatility in revenue over the past
eight quarters has resulted from variable precious metals prices, which are not under the Company's control, sales volumes and
the acquisition of Çöpler. There are no significant seasonal fluctuations in the results for the presented periods.
Over the past eight quarters, average realized gold prices have ranged between $1,303 and $1,920 per ounce and average realized
silver prices have ranged between $14.92 and $26.69 per ounce. Sales volumes have benefited from generally increasing production
at Seabee, normal production variations at Marigold due to its nature as a run-of-mine heap leach operation, and increasing production
at Puna after commercial production was declared at the Chinchillas mine on December 1, 2018. During the second quarter of 2020,
as a result of the temporary suspensions at Seabee and Puna in response to the COVID-19 pandemic, sales volumes decreased significantly,
negatively impacting revenue. During the third and fourth quarters of 2020, revenue was positively impacted by the Alacer Transaction
which added gold sales at Çöpler.
SSR Mining Inc. | MD&A Q4 2020 | 31 |
Year ended December 31, 2020, compared
to the year ended December 31, 2019
(expressed in thousands of USD, except for
per share amounts)
| |
Years ended December 31 |
| |
2020 |
2019 |
2018 |
| Total revenue |
$ |
853,089 |
|
$ |
606,850 |
|
$ |
420,675 |
|
| Net income (loss) |
140,468 |
|
55,757 |
|
(31) |
|
| Net income attributable to equity holders of SSR Mining |
133,494 |
|
57,315 |
|
6,379 |
|
| Basic income per share attributable to equity holders of SSR Mining |
0.88 |
|
0.47 |
|
0.05 |
|
| Diluted income per share attributable to equity holders of SSR Mining |
0.87 |
|
0.47 |
|
0.05 |
|
| Total assets |
5,244,986 |
|
1,750,107 |
|
1,521,138 |
|
| Total non-current liabilities |
1,056,150 |
|
381,982 |
|
431,908 |
|
Net income attributable to SSR Mining shareholders
for the year ended December 31, 2020 was $133.5 million ($0.88 per share), compared to net income of $57.3 million ($0.47
per share) in the same period of 2019. The following is a summary and discussion of the significant components of income and expenses
recognized during the year ended December 31, 2020 compared to the same period in the prior year.
| |
Year ended December 31, |
| |
2020 |
2019 |
| Revenue |
$ |
853,089 |
|
$ |
606,850 |
|
| Cost of sales |
|
|
| Production costs |
(418,652) |
|
(329,810) |
|
| Depletion and depreciation |
(125,795) |
|
(106,157) |
|
| |
(544,447) |
|
(435,967) |
|
| Income from mine operations |
308,642 |
|
170,883 |
|
| General and administrative expense |
(24,626) |
|
(18,115) |
|
| Share-based compensation expense |
(8,500) |
|
(12,814) |
|
| Exploration, evaluation and reclamation expense |
(22,397) |
|
(17,616) |
|
| Care and maintenance expense |
(29,593) |
|
- |
|
| Transaction and integration expense |
(20,813) |
|
- |
|
| Operating income |
202,713 |
|
122,338 |
|
| Interest and other finance income |
6,545 |
|
11,910 |
|
| Interest expense and other finance costs |
(26,787) |
|
(31,598) |
|
| Loss on redemption of convertible debt |
- |
|
(5,423) |
|
| Other income (expense) |
2,605 |
|
(5,739) |
|
| Foreign exchange loss |
(3,755) |
|
(5,359) |
|
| Income before income tax |
181,321 |
|
86,129 |
|
| Income tax expense |
(40,853) |
|
(30,372) |
|
| Net income |
$ |
140,468 |
|
$ |
55,757 |
|
| |
|
|
| Attributable to: |
|
|
| Equity holders of SSR Mining |
$ |
133,494 |
|
$ |
57,315 |
|
| Non-controlling interest |
$ |
6,974 |
|
$ |
(1,558) |
|
SSR Mining Inc. | MD&A Q4 2020 | 32 |
Revenue
Revenue increased by $246.2 million, or
41%, to $853.1 million for the year ended December 31, 2020, compared to $606.9 million in the comparative period of 2019.
The increase was mainly due to $205.5 million in gold sales at Çöpler and a $94.5 million increase in gold sales at
Marigold, partially offset by a decrease of $42.9 million in silver sales at Puna and a decrease of $10.9 million in gold sales
at Seabee. At Marigold, gold sales were 30% higher primarily due to a 28% increase in the average realized gold price. At Puna,
concentrate sales were 29% lower primarily due to a 39% decrease in the volume of silver ounces sold, partially offset by a 31%
increase in the average realized silver price. Puna's revenue for the year ended December 31, 2020 included a negative fair
value adjustment of $1.4 million on concentrate metal trade receivables. At Seabee, gold sales were 7% lower due to a 28% decrease
in the volume of gold ounces sold, offset partially by a 28% increase in the average realized gold price. The lower sales volumes
at Seabee and Puna were due to the impact of the temporary suspensions of operations related to COVID-19.
Production costs
Production costs increased by $88.8 million,
or 27%, to $418.7 million for the year ended December 31, 2020, compared to $329.8 million in the comparative period of 2019.
The increase in production costs was due to $120.6 million in production costs at Çöpler, which includes $51.9 million
of fair value adjustments on inventories acquired that were subsequently processed and sold, as well as a $12.6 million increase
in production costs at Marigold. These increases were partially offset by lower production costs at Seabee and Puna. At Marigold,
production costs were 7% higher mainly due to higher unit inventory costs, while production costs were 15% and 38% lower at Seabee
and Puna, respectively, mainly due to lower sales volumes due to the impact of the temporary suspensions of operations related
to COVID-19.
Depletion and depreciation
| Year ended December 31, |
2020 |
2019 |
Change |
| Depletion and depreciation ($000s) |
$ |
125,795 |
|
$ |
106,157 |
|
18 |
% |
| Gold equivalent ounces sold |
465,471 |
|
415,383 |
|
12 |
% |
| Depletion and depreciation per gold equivalent ounce sold |
$ |
270 |
|
$ |
256 |
|
5 |
% |
Depletion and depreciation expense increased
by $19.6 million, or 18%, to $125.8 million for the year ended December 31, 2020 compared to $106.2 million for the comparative
period of 2019. The increase is mainly due to $34.1 million of depletion and depreciation at Çöpler, which includes
$9.2 million of depletion of fair value adjustments on mineral properties acquired, partially offset by decreases at the Company's
other operations. At Seabee, depletion and depreciation decreased by 22% mainly due to lower gold sales volumes as a result of
the temporary suspension of operations due to COVID-19. At Marigold, depletion and depreciation decreased by 9% mainly due to the
impact of a higher average depletable reserve base.
General and administrative expense
General and administrative expense for
the year ended December 31, 2020 was $24.6 million compared to $18.1 million for the comparative period 2019. General and
administrative expense increased mainly due to the Alacer Transaction.
Share-based compensation expense
Share-based compensation expense for the
year ended December 31, 2020 was $8.5 million compared to $12.8 million for the comparative period of 2019. Share-based compensation
expense decreased mainly due to a decrease in cash-settled share-based compensation expense as a result of a smaller increase in
SSR Mining's common share price during 2020 compared to the comparative period of 2019.
SSR Mining Inc. | MD&A Q4 2020 | 33 |
Exploration, evaluation and reclamation expense
Exploration, evaluation and reclamation
expense for the year ended December 31, 2020 was $22.4 million compared to $17.6 million for the comparative period of 2019.
The expenditures incurred during the year ended December 31, 2020 mainly related to greenfield exploration work performed
at Trenton Canyon, as well as at Çöpler and Seabee. The expenditures incurred during the year ended December 31, 2019
mainly related to greenfield exploration work performed at Trenton Canyon and Seabee.
Care and maintenance expense
Care and maintenance expense for the year
ended December 31, 2020 was $29.6 million compared to nil for the comparative period of 2019. These costs related to expenses
incurred with the temporary suspension of operations at Seabee and Puna in response to COVID-19. Operations at Seabee successfully
re-started at the beginning of the third quarter of 2020 following a temporary suspension that began near the end of the first
quarter. Operations at Puna also re-started during the third quarter of 2020 after being suspended near the end of the first quarter,
however activities were again temporarily suspended in September due to an increase in COVID-19 infection rates in the Province
of Jujuy. During the temporary suspensions, certain costs were incurred at each of the sites to provide care and maintenance activities.
These costs were identified and recognized as care and maintenance expenses in the consolidated statements of income. For the year
ended December 31, 2020, $13.6 million and $16.0 million were recognized in care and maintenance expenses at Seabee and Puna,
respectively.
Transaction and integration expense
Transaction and integration expense for
the year ended December 31, 2020 was $20.8 million compared to nil for the comparative period of 2019. These costs are associated
with the Alacer Transaction.
Interest and other finance income
Interest and other finance income for the
year ended December 31, 2020 was $6.5 million compared to $11.9 million for the comparative period of 2019. The decrease in
interest and other finance income is mainly due to a significant decrease in the rate of interest earned on short-term investments.
Interest expense and other finance
costs
| Year ended December 31, |
2020 |
2019 |
| Interest expense on debt |
$ |
19,916 |
|
$ |
23,049 |
|
| Accretion of reclamation and closure cost provision |
3,887 |
|
3,743 |
|
| Other |
2,984 |
|
4,806 |
|
| |
$ |
26,787 |
|
$ |
31,598 |
|
Interest expense and other finance costs
for the year ended December 31, 2020 were $26.8 million compared to $31.6 million for the comparative period of 2019. The
decrease is mainly due to lower interest expense on the Company's convertible notes due to the redemption of the remaining 2013
Notes during the first quarter of 2020, offset partially by interest expense on the Term Loan assumed in the Alacer Transaction.
Loss on redemption of convertible debt
In the first quarter of 2019, $150 million
of the outstanding $265 million of the 2013 Notes were repurchased. Upon repurchase, a loss of $5.4 million was recognized, which
represents the difference between the estimated fair value of the debt portion repurchased and the book value of the repurchased
2013 Notes.
SSR Mining Inc. | MD&A Q4 2020 | 34 |
Foreign exchange loss
Foreign exchange loss for the year ended
December 31, 2020 was $3.8 million compared to $5.4 million for the comparative period of 2019. The Company's main foreign
exchange exposures are related to net monetary assets and liabilities denominated in TRY, ARS and CAD. During the year ended December 31,
2020, the foreign exchange loss was mainly due to a weakening of the ARS and its impact on the ARS-denominated assets at Puna,
offset partially by a foreign exchange gain on corporate CAD-denominated liabilities during the first quarter of 2020, as the CAD
weakened, in addition to a foreign exchange gain on corporate-denominated cash and cash equivalents balance during the second and
third quarters of 2020 as the CAD strengthened. During the year ended December 31, 2019, the foreign exchange loss was due mainly
a weakening of the ARS and its impact on ARS denominated assets at Puna, as well as a strengthening of the CAD and its impact on
CAD denominated assets.
Income tax expense
Income tax expense for the year ended December 31,
2020 was $40.9 million compared to $30.4 million in the comparative period of 2019. The tax expense for the year ended December 31,
2020 is a result of profitable operations at Çöpler, Marigold and Seabee, in addition to gold and metal concentrate
sales activities in Canada, offset partially by the impact of care and maintenance expenses related to the temporary suspension
of operations at Seabee and Puna, as well as the impact of general and administrative expenses and transaction and integration
expenses incurred in Canada. Income tax expense for the year ended December 31, 2020 includes a deferred tax expense of $12.8
million related to the impact of foreign exchange rate changes on foreign currency denominated deferred tax balances principally
at Puna.
The income tax expense for the year ended
December 31, 2019 was a result of profitable operations at Marigold and Seabee, as well as gold and metal concentrate sales activities
in Canada, offset by general and administrative expenses in Canada and a tax recovery from the redemption of the 2013 Notes.
Other comprehensive income
Other comprehensive income for the year
ended December 31, 2020 was $18.6 million compared to $32.0 million for the comparative period of 2019. During the year ended
December 31, 2020, the Company recognized a gain, net of tax, of $19.3 million on marketable securities compared to a gain,
net of tax, of $29.8 million for the comparative period of 2019, mainly due to changes in the fair value of its investment in SilverCrest
prior to divestment in the second quarter of 2020. Additionally, the Company recognized an unrealized loss on the effective portion
of its derivatives, net of tax, of $5.2 million compared to an unrealized gain, net of tax, of $2.2 million for the comparative
period of 2019, mainly due to changes in diesel and currency prices relative to its hedge contract prices, as well as the impact
of additional hedges executed in the first quarter of 2020 that extend through 2022. The Company also reclassified realized losses
of $4.5 million on its derivative hedges to net income during the year ended December 31, 2020 compared to the reclassification
of nil losses for the comparative period of 2019.
SSR Mining Inc. | MD&A Q4 2020 | 35 |
REVIEW OF FOURTH QUARTER
FINANCIAL RESULTS
Three months ended December 31, 2020, compared
to the three months ended December 31, 2019
(expressed in thousands of USD, except for
per share amounts)
Net income attributable to SSR Mining shareholders
for the three months ended December 31, 2020 was $89.0 million ($0.41 per share), compared to net income of $19.5 million
($0.16 per share) for the three months ended December 31, 2019. The following is a summary and discussion of the significant components
of income and expenses recognized during the three months ended December 31, 2020 compared to the same period in the prior
year.
| |
Three months ended December 31, |
| |
2020 |
2019 |
| Revenue |
$ |
370,729 |
|
$ |
177,603 |
|
| Cost of sales |
|
|
| Production costs |
(169,581) |
|
(89,179) |
|
| Depletion and depreciation |
(54,692) |
|
(29,511) |
|
| |
(224,273) |
|
(118,690) |
|
| Income from mine operations |
146,456 |
|
58,913 |
|
| General and administrative expense |
(9,071) |
|
(4,902) |
|
| Share-based compensation expense |
(6,480) |
|
(5,340) |
|
| Exploration, evaluation and reclamation expense |
(6,343) |
|
(5,443) |
|
| Care and maintenance expense |
(1,896) |
|
- |
|
| Transaction and integration expense |
(2,334) |
|
- |
|
| Operating income |
120,332 |
|
43,228 |
|
| Interest and other finance income |
636 |
|
1,669 |
|
| Interest expense and other finance costs |
(7,577) |
|
(7,545) |
|
| Other income (expense) |
263 |
|
(1,571) |
|
| Foreign exchange loss |
(2,952) |
|
(4,633) |
|
| Income before income tax |
110,702 |
|
31,148 |
|
| Income tax expense |
(13,048) |
|
(11,669) |
|
| Net income |
$ |
97,654 |
|
$ |
19,479 |
|
| |
|
|
| Attributable to: |
|
|
| Equity holders of SSR Mining |
$ |
89,039 |
|
$ |
19,479 |
|
| Non-controlling interest |
$ |
8,615 |
|
$ |
— |
|
Revenue
Revenue increased by $193.1 million, or
109%, to $370.7 million for the three months ended December 31, 2020, compared to $177.6 million in the comparative period
of 2019. The increase was mainly due to $152.0 million in gold sales at Çöpler for the fourth quarter of 2020, in addition
to higher gold sales at Marigold and Seabee, offset partially by lower silver sales at Puna. Gold sales at Marigold were $49.0
million, or 54%, higher due to a 28% increase in the average realized gold price and a 21% increase in the volume of gold ounces
sold. Gold sales at Seabee were $16.4 million, or 45%, higher due to a 26% increase in the average realized gold price and a 15%
increase in the volume of gold ounces sold. Silver sales at Puna were $24.2 million, 47% lower than the same period in 2019 due
to a 61% decrease in the volume of silver ounces sold, partially offset by a 43% increase in the average realized silver price.
The decrease in silver ounces sold is due to normal lags associated with re-starting concentrate shipments upon the operational
restarts at Puna. Puna's revenue benefited from a positive fair value adjustment in the fourth quarter of 2020 of $2.8 million
on concentrate metal trade receivables, driven by higher silver prices at the end of the fourth quarter.
SSR Mining Inc. | MD&A Q4 2020 | 36 |
Production costs
Production costs increased by $80.4 million,
or 90%, to $169.6 million for the three months ended December 31, 2020, compared to $89.2 million in the comparative period
of 2019. The increase in production costs was mainly due to $79.9 million in production costs at Çöpler, which includes
$28.3 million of fair value adjustments on inventories acquired that were subsequently processed and sold. Further impacting production
costs were 31% and 27% higher costs at Marigold and Seabee, respectively, mainly due to higher gold sales volumes. These increases
were partially offset by 60% lower production costs at Puna, mainly due to lower silver sales volumes, partially offset by 24%
increase in the cost per silver ounce sold.
Depletion and depreciation
| Three months ended December 31, |
2020 |
2019 |
Change |
| Depletion and depreciation ($000s) |
$ |
54,692 |
|
$ |
29,511 |
|
85 |
% |
| Gold equivalent ounces sold |
194,862 |
|
114,268 |
|
71 |
% |
| Depletion and depreciation per gold equivalent ounce sold |
$ |
281 |
|
$ |
259 |
|
8 |
% |
Depletion and depreciation costs increased
by $25.2 million, or 85%, to $54.7 million for the three months ended December 31, 2020 compared to $29.5 million for the
comparative period of 2019. The increase in depreciation and depletion costs was mainly due to $25.2 million in depletion and depreciation
at Çöpler, which includes $6.9 million of depletion of the fair value adjustment on mineral properties acquired.
General and administrative expense
General and administrative expense for
the three months ended December 31, 2020 was $9.1 million compared to $4.9 million for the comparative period of 2019. General
and administrative expense increased mainly due to the Alacer Transaction.
Share-based compensation expense
Share-based compensation expense for the
three months ended December 31, 2020 was $6.5 million compared to $5.3 million for the comparative period of 2019. Share-based
compensation expenses increased primarily due to expenses related to the Replacement Units issued in connection with the Alacer
Transaction, offset partially by a decrease in cash-settled share-based compensation expense as a result of a smaller increase
in SSR Mining's common share price during the fourth quarter of 2020 compared to the comparative period of 2019.
Exploration, evaluation and reclamation expense
Exploration, evaluation and reclamation
expenses for the three months ended December 31, 2020 were $6.3 million compared to $5.4 million for the fourth quarter of
2019. The expenditures incurred during the fourth quarter of 2020 mainly related to greenfield exploration work at Çöpler
and Seabee. The expenditures incurred during the fourth quarter of 2019 mainly related to greenfield exploration work performed
at Trenton Canyon and Seabee.
Transaction and integration expenses
Transaction and integration expenses for
the three months ended December 31, 2020 were $2.3 million compared to nil for the comparative period of 2019. These costs
are associated with the Alacer Transaction.
SSR Mining Inc. | MD&A Q4 2020 | 37 |
Interest expense and other finance
costs
| Three months ended December 31, |
2020 |
2019 |
| Interest expense on debt |
$ |
5,616 |
|
$ |
5,839 |
|
| Accretion of reclamation and closure cost provision |
1,083 |
|
764 |
|
| Other |
876 |
|
942 |
|
| |
$ |
7,575 |
|
$ |
7,545 |
|
Interest expense and other finance costs
for the three months ended December 31, 2020 were $7.6 million compared to $7.5 million for the comparative period of 2019.
The increase in interest expense is due to interest on the term loan (the "Term Loan") with a syndicate of lenders (BNP
Paribas (Suisse) SA, ING Bank NV, Societe Generale Corporate & Investment Banking and UniCredit S.P.A.) assumed in the Alacer
transaction, offset by a decrease due to the Company's redemption of its remaining 2013 Notes during the first quarter of 2020.
Foreign exchange loss
Foreign exchange loss for the three months
ended December 31, 2020 was $3.0 million compared to $4.6 million for the comparative period of 2019. The Company's main foreign
exchange exposures are related to net monetary assets and liabilities denominated in ARS, CAD and TRY. During the three months
ended December 31, 2020 and 2019, the foreign exchange loss was mainly due to a weakening of the ARS against the USD and its
impact on ARS-denominated assets at Puna. The decrease in foreign exchange loss in the fourth quarter of 2020 as compared to the
comparative period of 2019 is due to a decrease in ARS-denominated assets at Puna.
Income tax expense
Income tax expense for the three months
ended December 31, 2020 was $13.0 million compared to $11.7 million for the comparative period of 2019. The tax expense in
the fourth quarter of 2020 was a result of profitable operations at all of the Company's mines, as well as gold and metal concentrate
sales activities in Canada, in addition to the impact of general and administrative expenses and transaction and integration expenses
incurred in Canada. Income tax expense for the fourth quarter of 2020 includes deferred tax recovery of $5.8 million related to
the impact of changes in foreign exchange rates on foreign currency denominated tax base principally at Çöpler.
The income tax expense for the three months
ended December 31, 2019 was a result of profitable operations at the Marigold and Seabee, as well as the gold and metal concentrate
sales activities in Canada, offset by general and administrative expenses in Canada.
Other comprehensive income
Other comprehensive income for the three
months ended December 31, 2020 was $13.2 million compared to $13.1 million for the comparative period of 2019. In the fourth
quarter of 2020, the Company recognized an unrealized gain on the effective portion of its derivatives, net of tax, of $3.0 million
compared to an unrealized gain, net of tax, of $0.6 million for the comparative period of 2019, mainly due to changes in diesel
and currency prices relative to its hedge contract prices, as well as the impact of additional hedges executed in the first quarter
of 2020 that extend through 2022. In addition, the Company recognized a gain, net of tax, of $8.9 million on marketable securities
compared to a gain, net of tax, of $12.5 million for the comparative period of 2019.
SSR Mining Inc. | MD&A Q4 2020 | 38 |
| 10. | LIQUIDITY AND CAPITAL RESOURCES |
The following table summarizes the
Company's cash flow activity:
| (figures expressed in $000s) |
Three months ended December 31, |
Year ended December 31, |
| |
2020 |
2019 |
2020 |
2019 |
| Cash generated by operating activities |
$ |
217,383 |
|
$ |
51,917 |
|
$ |
348,615 |
|
$ |
145,844 |
|
| Cash (used in) generated by investing activities |
(54,099) |
|
(22,303) |
|
180,790 |
|
(130,328) |
|
| Cash (used in) generated by financing activities |
(36,938) |
|
(3,536) |
|
(173,204) |
|
68,907 |
|
| Effect of foreign exchange rate changes on cash and cash equivalents |
720 |
|
3,090 |
|
789 |
|
12 |
|
| Increase in cash and cash equivalents |
127,066 |
|
29,168 |
|
356,990 |
|
84,435 |
|
| Cash and cash equivalents, beginning of period |
733,571 |
|
474,479 |
|
503,647 |
|
419,212 |
|
| Cash and cash equivalents, end of period |
$ |
860,637 |
|
$ |
503,647 |
|
$ |
860,637 |
|
$ |
503,647 |
|
Cash generated by operating activities
For the year ended December 31, 2020,
cash generated by operating activities was $348.6 million compared to cash generated by operating activities of $145.8 million
for the comparative period of 2019. The increase in cash generated by operating activities compared to the comparative period of
2019 is mainly due to the impact of gold sales at Çöpler and higher income from mine operations at Marigold. In addition,
cash generated by operating activities for the year ended December 31, 2019 was negatively impacted by an increase in concentrate
sales receivables related to Puna at the end of 2019.
In the fourth quarter of 2020, cash generated
by operating activities was $217.4 million compared to cash generated by operating activities of $51.9 million in the fourth quarter
of 2019. The increase in cash generated by operating activities compared to the comparative period of 2019 is mainly due to higher
income from mine operations at Çöpler, Marigold and Seabee.
Cash (used in) generated by investing activities
For the year ended December 31, 2020,
cash generated by investing activities was $180.8 million compared to cash used in investing activities of $130.3 million for the
year ended December 31, 2019. The increase in cash generated by investing activities compared to the comparative period of 2019
is mainly due to $270.4 million of cash and cash equivalents acquired in the Alacer Transaction in September 2020, the receipt
of proceeds on the sale of marketable securities of $97.1 million, driven by the divestment of the Company's equity position in
SilverCrest during the second quarter of 2020, offset partially by $29.6 million in purchases of marketable securities. The Company's
expenditures on mineral properties, plant and equipment increased by $33.6 million compared to the comparative period of 2019,
mainly due to a $58.5 million increase in the investment of plant and equipment at Çöpler, Marigold and Seabee and
a $5.9 million increase in underground mine development at Seabee, offset partially by a decrease in investment in mineral properties
by $22.6 million related to the purchase of the Trenton Canyon and Buffalo Valley properties in the second quarter of 2019, as
well as a $11.4 million decrease related to the completion of the Chinchillas mine build in 2019.
In the fourth quarter of 2020, cash used
in investing activities was $54.1 million compared to cash used in investing activities of $22.3 million in the fourth quarter
of 2019. The increase in cash used in investing activities compared to the comparative period of 2019 is mainly due to a $29.6
million increase in plant and equipment purchases, driven by planned capital spending at Çöpler and Marigold, as well
as $1.0 million more spent on underground mine development at Seabee due to planned increase in development rates.
SSR Mining Inc. | MD&A Q4 2020 | 39 |
| 10. | LIQUIDITY AND CAPITAL RESOURCES (continued) |
Cash (used in) generated by financing activities
For the year ended December 31, 2020,
cash used in financing activities was $173.2 million compared to cash generated by financing activities of $68.9 million for the
comparative period of 2019. For the year ended December 31, 2020, the Company redeemed its remaining outstanding 2013 Notes
for $115.5 million and paid principal and interest of $39.4 million, mainly related to its Term Loan. For the year ended December
31, 2019, the Company repurchased a portion of the 2013 Notes for $152.3 million and issued its 2.50% convertible senior notes
due in 2039 (the "2019 Notes") for net proceeds of $222.9 million and paid interest of $9.1 million on the 2019 Notes.
In the fourth quarter of 2020, cash used
in financing activities was $36.9 million compared to cash used in financing activities of $3.5 million for the fourth quarter
of 2019. The increase in cash used in financing activities is mainly due to a $18.1 million increase in repayments of principal
and interest related mainly to the Term Loan assumed in the Alacer Transaction.
Liquidity
Liquidity risk is the risk that the Company
will not be able to meet its obligations associated with financial liabilities as they fall due. The Company manages its liquidity
risk through a rigorous planning, budgeting and forecasting process, which is reviewed and updated on a regular basis, to help
determine the funding requirements to support its current operations, expansion and development plans, and by managing its capital
structure. The Company's objective is to ensure that there are sufficient committed financial resources to meet its business requirements
for a minimum of twelve months.
On a longer-term basis, the Company continues
to focus on capital allocation and its cost reduction strategy, while also implementing various optimization activities at its
operations to improve the cash generating capacity of each operation.
At December 31, 2020, the Company
had $860.6 million of cash and cash equivalents, an increase of $357.0 million from December 31, 2019, mainly due to $270.4
million of cash and cash equivalents acquired in the Alacer Transaction, as well as positive income from mine operations generated
at each of the Company's operations.
At December 31, 2020, the Company's
working capital position was $1,175.6 million, an increase of $510.1 million from $665.5 million at December 31, 2019.
At December 31, 2020, the Company
held $850.7 million of its cash and cash equivalents balance in USD. Additionally, $3.3 million of cash and cash equivalents was
held in ARS and $1.4 million was held in TRY. All cash is invested in short-term investments or high interest savings accounts
under the Company's investment policy with maturities of 90 days or less, providing the Company with sufficient liquidity to meet
its foreseeable corporate needs.
To supplement corporate liquidity, the
Company has a revolving credit facility (the "Credit Facility") available for reclamation bonding, working capital and
other general corporate purposes. of which it has utilized $0.7 million as at December 31, 2020 (2019 - $0.6 million).
In addition, the Company uses surety bonds
to support certain environmental bonding obligations. As at December 31, 2020, the Company had surety bonds totaling $117.5
million outstanding (2019 - $84.4 million).
The Company enters into contracts in the
normal course of business that give rise to commitments for future minimum payments. The following table summarizes the remaining
contractual maturities of the Company's financial liabilities, operating and capital commitments, shown in contractual undiscounted
cash flows:
SSR Mining Inc. | MD&A Q4 2020 | 40 |
| 10. | LIQUIDITY AND CAPITAL RESOURCES (continued) |
| |
Payments due by period (as at December 31, 2020) |
| |
Less than
one year |
1 - 3 years |
4-5 years |
After 5 years |
Total |
| Accounts payable and accrued liabilities |
$ |
123,534 |
|
$ |
- |
|
$ |
- |
|
$ |
- |
|
$ |
123,534 |
|
| Convertible notes (principal portion) |
- |
|
- |
|
- |
|
230,000 |
|
230,000 |
|
| Term Loan and other debt (principal portion) |
71,025 |
|
142,063 |
|
- |
|
- |
|
213,088 |
|
| Interest payments on debt |
12,840 |
|
17,585 |
|
11,500 |
|
2,875 |
|
44,800 |
|
| Lease liabilities |
12,452 |
|
21,376 |
|
19,522 |
|
133,049 |
|
186,399 |
|
| Derivative liabilities |
3,764 |
|
117 |
|
- |
|
- |
|
3,881 |
|
| Reclamation and closure costs |
1,840 |
|
13,248 |
|
2,064 |
|
122,290 |
|
139,442 |
|
| Operating expenditure commitments |
2,900 |
|
752 |
|
- |
|
- |
|
3,652 |
|
| Capital expenditure commitments |
20,077 |
|
- |
|
- |
|
- |
|
20,077 |
|
| Other |
696 |
|
330 |
|
327 |
|
- |
|
1,353 |
|
| Total contractual obligations |
$ |
249,128 |
|
$ |
195,471 |
|
$ |
33,413 |
|
$ |
488,214 |
|
$ |
966,226 |
|
The Company's working capital at December 31,
2020, together with future cash flows from operations, are expected to be sufficient to fund planned activities and commitments
over the next twelve months from the date of this MD&A.
Capital Resources
The Company's objectives when managing
capital are to:
| • | safeguard its ability to continue as a
going concern in order to develop and operate its current projects and pursue strategic growth initiatives; and |
| • | maintain a flexible capital structure which
lowers its cost of capital. |
In
assessing capital structure, the Company includes the components of shareholders’ equity, the 2019 Notes, the Term Loan and
the Credit Facility. In order to facilitate the management of capital requirements, the Company prepares annual budgets and continuously
monitors and reviews actual and forecasted cash flows. The annual budget is monitored and approved by the Company's Board of Directors.
To maintain or adjust the capital structure, the Company may, from time to time, issue new shares or debt, repay debt or dispose
of non-core assets. The Company expects its current capital resources will be sufficient to meet its business requirements for
a minimum of twelve months.
To maintain or adjust the capital structure,
the Company may, from time to time, issue new shares, issue new debt, repay debt or dispose of non-core assets. The Company expects
its current capital resources will be sufficient to carry out its exploration plans and support operations through the current
operating period.
Under the terms of the Term Loan, the Company
is required to comply with the following financial covenants:
| • | historic and forecast debt service cover
ratio greater than or equal to 1.20:1; |
| • | loan life cover ratio greater than or equal
to 1.30:1; and |
| • | minimum tail reserves as a percentage of
total reserves greater than or equal to 30%. |
As of December 31, 2020, the Company
was in compliance with its externally-imposed financial covenants in relation to the Term Loan and Credit Facility. The Company
does not have any financial covenants in relation to the 2019 Notes.
Outstanding share data
As at December 31, 2020, the Company had
219,607,048 common shares and 1,405,436 stock options outstanding which are exercisable into common shares at exercise prices ranging
between C$5.83 and C$29.09 per share.
The Company's authorized capital consists of
an unlimited number of common shares without par value. As at February 17, 2021,
the following common shares and options were outstanding:
SSR Mining Inc. | MD&A Q4 2020 | 41 |
| 10. | LIQUIDITY AND CAPITAL RESOURCES (continued) |
| |
Number of shares |
Exercise price |
Remaining life |
| |
|
CAD $ |
(years) |
| Capital stock |
219,830,596 |
|
|
|
| Stock options |
1,274,103 |
|
5.83 - 29.09 |
0.10 - 6.27 |
| Other share-based compensation awards |
1,357,301 |
|
|
0.12 - 8.87 |
| Fully diluted |
222,462,000 |
|
|
|
The Company is exposed to a variety of
financial risks as a result of its operations, including market risk (which includes price risk, currency risk and interest rate
risk), credit risk, liquidity risk and capital risk. The Company's overall risk management strategy seeks to reduce potential adverse
effects on its financial performance. Risk management is carried out under policies approved by the Company's Board of Directors.
The Company may, from time to time, use
foreign exchange contracts, commodity price contracts, equity hedges and interest rate swaps to manage its exposure to fluctuations
in foreign currency, metal and energy prices, marketable securities values and interest rates. The Company does not have a practice
of trading derivatives. The Company's use of derivatives is limited to specific programs to manage fluctuations in foreign exchange,
diesel prices, interest rates and marketable securities risks, which are subject to the oversight of its Board of Directors.
The risks associated with the Company's
financial instruments, and the policies on how the Company mitigates those risks are set out below. This is not intended to be
a comprehensive discussion of all risks. There were no significant changes to the Company's exposures to these risks or the management
of its exposures during the year ended December 31, 2020, except as noted below.
This is the risk that the fair values
of financial instruments will fluctuate due to changes in market prices. The significant market risks to which the Company is exposed
are price risk, currency risk and interest rate risk.
This is the risk that the fair values
or future cash flows of the Company's financial instruments will fluctuate because of changes in market prices. Income from mine
operations depends on the metal prices for gold, silver, lead and zinc, and also prices of input commodities such as diesel. These
prices are affected by numerous factors that are outside of the Company's control.
The Company has not hedged the price
of any metal as part of its overall corporate strategy.
The Company's concentrate metal sales
agreements are subject to pricing terms that settle within one to four months after delivery of concentrate. This adjustment period
represents the Company's exposure to commodity price risk on its trade receivables. A 10% increase or decrease in the silver price
as at December 31, 2020, with all other variables held constant, would have resulted in a $3.0 million increase or decrease
to the Company's after-tax net income, respectively.
As the Company does not have trade
receivables relating to gold sales, changes in gold prices do not impact the value of any financial instruments.
The costs relating to the Company's
production activities vary depending on market prices on consumables, including diesel fuel and electricity. The Company hedges
a portion of its future cash flows relating to diesel consumption through swap and option contracts within limits set under a risk
management policy approved by the Board of Directors to manage its exposure to fluctuations in diesel prices. In addition, due
to the ice road supply at Seabee, the Company purchases annual consumable supplies in advance at prices which are generally fixed
at the time of purchase, and not during period of use.
SSR Mining Inc. | MD&A Q4 2020 | 42 |
| 11. | FINANCIAL INSTRUMENTS (continued) |
| a) | Market Risk (continued) |
| (i) | Price Risk (continued) |
During the year ended December 31,
2020, in accordance with its risk management policy, the Company used swaps and options to hedge a portion of its diesel costs
at Marigold and Seabee and recognized an unrealized loss of $1.2 million in other comprehensive income ("OCI") and a
realized loss of $4.1 million in the consolidated statements of income (2019 - unrealized gain of $1.2 million in OCI).
Marigold
The
following table summarizes the financial information relating to the future anticipated diesel consumption at Marigold that the
Company has hedged as at December 31, 2020:
| |
2021 |
2022 |
| Gallons hedged (in thousands) |
10,440 |
|
1,380 |
|
| Portion of forecast diesel consumption hedged (%) |
89.2 |
|
12.7 |
|
| Floor price ($/gallon)(1) |
1.54 |
|
1.48 |
|
| Cap price ($/gallon)(1) |
1.91 |
|
1.80 |
|
(1)
Based on the U.S. New York Harbor Ultra-Low Sulfur Diesel Index.
As
at December 31, 2020, the spot price of diesel was $1.43 per gallon.
Seabee
The
following table summarizes the financial information relating to the future anticipated diesel consumption at Seabee that the Company
has hedged as at December 31, 2020:
| |
|
2021 |
| Litres hedged (in thousands) |
|
3,560 |
|
| Portion of forecast diesel consumption hedged (%) |
|
94.9 |
|
| Floor price ($/litre)(1) |
|
0.43 |
|
| Cap price ($/litre)(1) |
|
0.48 |
|
(1)
Based on the NYMEX Heating Oil Ultra-Low Sulphur Diesel Index.
As
at December 31, 2020, the spot price of diesel was $0.39 per litre.
As
at December 31, 2020, the fair value of the Company's derivative instruments relating to diesel hedges at Marigold and Seabee
was $2.0 million, $1.9 million and $0.1 million of which are included in accounts payable and accrued liabilities and other non-current
liabilities, respectively, in the consolidated statements of financial position (2019 - $0.3 million included in accounts payable
and accrued liabilities).
As
at December 31, 2020, the Company has not hedged future anticipated diesel consumption at Çöpler or Puna. If and
when it is determined to be favorable, the Company may execute additional diesel fuel hedges under its risk management policy.
Marketable Securities
The
Company holds certain investments in marketable securities which are measured at fair value, being the closing share price of each
equity investment at the balance sheet date. The Company is exposed to changes in share prices which would result in gains and
losses being recognized in OCI. A 10% change in prices as at December 31, 2020 would have resulted in a $2.3 million increase
or decrease in the Company's total comprehensive income for the year ended December 31, 2020.
The
Company did not hedge any securities in 2020 or 2019.
SSR Mining Inc. | MD&A Q4 2020 | 43 |
| 11. | FINANCIAL INSTRUMENTS (continued) |
| a) | Market Risk (continued) |
(ii) Currency
Risk
Currency risk is the risk that the
fair values or future cash flows of the Company's financial instruments will fluctuate because of changes in foreign exchange rates.
Exchange rate fluctuations affect the costs the Company incurs at its operations. Gold, silver, lead and zinc are sold in USD and
the Company's costs are principally in USD, TRY, CAD and ARS. The appreciation or depreciation of foreign currencies against the
USD can increase or decrease the cost of metal production and capital expenditures in USD terms. The Company is also exposed to
currency risk arising from cash, cash equivalents and restricted cash held in foreign currencies, marketable securities, accounts
receivable and other financial assets, trade and other payables, lease liabilities, other financial liabilities, and income and
other taxes receivable (payable) denominated in foreign currencies, Further, the Company is exposed to currency risk through non-monetary
assets and liabilities and tax bases of assets, liabilities and losses of entities whose taxable profit or tax loss are denominated
in foreign currencies. Changes in exchange rates give rise to temporary differences resulting in a deferred tax liability or asset
with the resulting deferred tax charged or credited to income tax expense, respectively.
Effective September 2, 2019, Argentina
introduced new Central Bank regulations which require export proceeds to be converted into ARS within five business days of such
proceeds entering the country. These provisions were intended to be temporary until December 31, 2019, however, the provisions
remained in effect as at December 31, 2020. While these provisions remain in effect, the Company is unable to hold funds in
Argentina in USD, which may increase its exposure to the ARS, depending on the overall cash position within the country, which
is currently minimal.
At December 31, 2020 the Company
was primarily exposed to currency risk through the following financial assets and liabilities, income and other tax receivables
(payables) and deferred income tax assets and liabilities denominated in foreign currencies:
| |
December 31, 2020 |
| |
TRY |
CAD |
ARS |
| Financial assets and liabilities |
|
|
|
| Cash and cash equivalents |
$ |
1,435 |
|
$ |
4,556 |
|
$ |
3,325 |
|
| Marketable securities |
— |
|
25,235 |
|
— |
|
| Accounts receivable and other financial assets(1) |
11,395 |
|
363 |
|
2,670 |
|
| Trade and other payables |
(33,904) |
|
(39,445) |
|
(8,576) |
|
| Lease liabilities(1) |
(6,389) |
|
(3,284) |
|
— |
|
| Other financial liabilities |
(3,195) |
|
(13,933) |
|
(3) |
|
| Total |
$ |
(30,658) |
|
$ |
(26,508) |
|
$ |
(2,584) |
|
| |
December 31, 2019 |
| |
TRY |
CAD |
ARS |
| Financial asset and liabilities |
|
|
|
| Cash and cash equivalents |
$ |
— |
|
$ |
4,786 |
|
$ |
146 |
|
| Marketable securities |
|
65,586 |
|
— |
|
|
Accounts receivable and other financial assets(1)
|
— |
|
— |
|
1,250 |
|
| Trade and other payables |
— |
|
(26,695) |
|
(13,411) |
|
| Lease liabilities(1) |
— |
|
(3,679) |
|
— |
|
| Other financial liabilities |
— |
|
— |
|
— |
|
| Total |
$ |
— |
|
$ |
39,998 |
|
$ |
(12,015) |
|
| (1) | Includes current and non-current portion. |
SSR Mining Inc. | MD&A Q4 2020 | 44 |
| 11. | FINANCIAL INSTRUMENTS (continued) |
| a) | Market Risk (continued) |
(ii) Currency
Risk (continued)
The Company assessed the impact of
a 10% change in the USD exchange rate relative to the CAD and a 25% change in the USD exchange rate relative to the TRY and ARS
as at December 31, 2020 on the Company's net income based on the above financial assets and liabilities. As at December 31,
2020, depreciation of the TRY, CAD, and ARS against the USD would have resulted in an increase (decrease) to the Company's total
comprehensive income as follows:
| Year ended December 31 |
|
2020 |
| Turkish lira |
|
$ |
2,453 |
|
| Canadian dollar |
|
1,935 |
|
| Argentine peso |
|
485 |
|
During the year ended December 31,
2020, in accordance with its risk management policy, the Company entered into CAD/USD foreign currency hedges to manage the foreign
currency exposure at Seabee and recognized an unrealized gain of $0.5 million in OCI and a realized loss of $0.4 million in the
consolidated statements of income (2019 - unrealized gain of $1.0 million in OCI).
As at December 31, 2020, the
Company had the following hedge positions outstanding:
| |
2021 |
2022 |
| Notional amount (in thousands of CAD) |
24,957 |
|
9,000 |
|
| Portion of forecast exposure hedged (%) |
33.9 |
|
11.9 |
|
| Floor level (CAD per 1 USD) |
1.32 |
|
1.35 |
|
| Cap level (CAD per 1 USD) |
1.38 |
|
1.42 |
|
As at December 31, 2020, the fair
value of derivative instruments related to the Company's foreign currency hedges was $1.2 million, $0.8 million and $0.5 million
of which are included in other current and non-current assets, respectively, in the consolidated statements of financial position
(2019 - $0.4 million included in other current assets).
The Company has not hedged its foreign
currency exposure to the TRY or ARS.
Interest rate risk is the risk that
the fair values or future cash flows of the Company's financial instruments will fluctuate because of changes in market interest
rates. The Company manages interest rate risk by maintaining an investment policy for short-term investments and cash held in banks,
which focuses on preservation of capital and liquidity. As at December 31, 2020, the Company is exposed to interest rate cash flow
risk arising from its cash and restricted cash in bank accounts that earn variable interest rates, and interest expense on variable
rate borrowings. The Company's variable rate borrowings are comprised of the Term Loan, which is subject to a variable interest
rate of LIBOR plus 3.50% to 3.70%, and the Credit Facility, which is subject to a variable interest rate of LIBOR plus 2.25% to
3.75%.
Future net cash flows from interest
income on cash, restricted cash, and interest expense on variable rate borrowings will be affected by interest rate fluctuations.
To mitigate exposures to interest rate risk, the Company may purchase short-term investments at market interest rates that result
in fixed yields to maturity.
The Company holds interest rate swaps
to limit exposure to the impact of the variable LIBOR interest rate volatility. As at December 31, 2020, approximately 37%
of the outstanding Term Loan balance is covered through interest rate swap contracts through the duration of the interest rate
hedge program, ending in December 2021. As at December 31, 2020, the fair value of the interest rate swaps was $1.9 million
included in accounts payable and accrued liabilities in the consolidated statements of financial position (2019 - nil).
SSR Mining Inc. | MD&A Q4 2020 | 45 |
| 11. | FINANCIAL INSTRUMENTS (continued) |
| a) | Market Risk (continued) |
(iii) Interest
Rate Risk (continued)
As at December 31, 2020, a 1.0% increase
or decrease in the LIBOR interest rate, assuming all other variables remained constant and assuming no effect from the interest
rate swap contract, would decrease or increase the Company's after-tax net income by $0.4 million.
As at December 31, 2020, the
weighted average interest rate earned on the Company's cash and cash equivalents was 0.16% (2019 - 1.8%). With other variables
unchanged, a 1.0% change in the annualized interest rate would impact the Company's after-tax net income by $4.0 million (2019
- $3.3 million).
As at December 31, 2020, the
Company is exposed to interest rate fair value risk on the 2019 Notes which is subject to a fixed interest rate. A change in interest
rates would impact the fair value of the 2019 Notes. However, as the 2019 Notes are measured at amortized cost, there would be
no impact on the Company's financial results.
b) Credit
Risk
Credit risk is the risk that the counterparty
to a financial instrument will cause a financial loss for the Company by failing to discharge its obligations under the terms of
the financial contract. The Company's credit risk is limited to the following instruments:
| (i) | Credit risk related to financial institutions and cash
deposits |
Credit risk related to financial institutions
and cash deposits is managed by diversifying cash and cash equivalents and restricted cash holdings among various financial institutions
and by investing those holdings in diverse investment types including short term investment grade securities and money market fund
holdings, including bankers’ acceptances, guaranteed investment contracts, corporate commercial paper, and United States
treasury bills and notes in accordance with the Company’s investment policy. Investment objectives are primarily directed
towards preservation of capital and liquidity. The investment policy provides limitations on concentrations of credit risk, credit
quality, and the duration of investments, as well as minimum rating requirements for banks and financial institutions that hold
the Company’s cash and cash equivalents and restricted cash.
| (ii) | Credit risk related to trade receivables |
The Company is exposed to credit risk through
its trade receivables on concentrate sales, which are principally with internationally-recognized counterparties. Payments of receivables
are scheduled, routine and received within a contractually agreed time frame. The Company manages this risk through provisional
payments of approximately 75% of the value of the concentrate shipped and through transacting with multiple counterparties.
| (iii) | Credit risk related to other financial assets and VAT receivables |
The Company's credit risk with respect
to other financial assets includes deferred consideration in connection with the sales of certain mineral properties. The Company
has security related to these payments in the event of default.
The Company is exposed to credit
risk through its value-added tax ("VAT") receivables and other receivables that are collectible from the governments
of Turkey and Argentina. With respect to VAT in Turkey, the balance is expected to be recoverable in full. With respect to VAT
in Argentina, the balance is expected to be recoverable in full; however, due to legislative rules and the complex collection process,
a portion of the asset is classified as non-current until government approval of the recovery claim is approved. Management monitors
its exposure to credit risk on a continual basis.
SSR Mining Inc. | MD&A Q4 2020 | 46 |
| 11. | FINANCIAL INSTRUMENTS (continued) |
| b) | Credit Risk (continued) |
| (iii) | Credit risk related to other financial assets and VAT
receivables (continued) |
The Company's maximum exposure
to credit risk as at December 31, 2020 and December 31, 2019 was as follows:
| |
December 31, 2020 |
December 31, 2019 |
| Cash and cash equivalents |
$ |
860,637 |
|
$ |
503,647 |
|
| Trade receivables |
38,456 |
|
54,164 |
|
| Value added tax receivable |
30,279 |
|
21,416 |
|
| Restricted cash |
35,288 |
|
2,339 |
|
| Other current and non-current financial assets |
16,219 |
|
15,625 |
|
| |
$ |
980,879 |
|
$ |
597,191 |
|
At December 31, 2020, no amounts
were held as collateral except those discussed above related to other financial assets.
| 12. | RISKS AND UNCERTAINTIES |
The mining industry involves many risks
which are inherent to the nature of the business, global economic trends and economic, environmental and social conditions in the
geographical areas of operation. As a result, the Company is subject to a number of risks and uncertainties, each of which could
have an adverse effect on its operating results, business prospects or financial position. The Company continuously assess and
evaluate these risks and seek to minimize them by implementing high operating standards and processes to identify, assess, report
and monitor risks across its organization.
For a comprehensive list of other known
risks and uncertainties affecting the business, please refer to the section entitled “Risk Factors” in the Company's
most recent Annual Information Form, which is available at www.sedar.com, and the Company's most recent Annual Report on Form 40-F,
which is available on the EDGAR section of the SEC website at www.sec.gov. Subsequent to the filing of the Annual Information Form
and Annual Report, SSR Mining completed the acquisition of Alacer on September 16, 2020. While many of the risks and uncertainties
in the Company's Annual Information Form and Annual Report also apply to Alacer’s business, additional material risks and
uncertainties specific to Alacer’s business are set out below under the heading “Risks associated with the Alacer Transaction”.
SSR Mining Inc. | MD&A Q4 2020 | 47 |
| 12. | RISKS AND UNCERTAINTIES (continued) |
Risks associated with the COVID-19 pandemic
The COVID-19 pandemic adversely impacted
the Company's operations, including production and operating income in the first half of 2020, particularly at Seabee and Puna
where operations were temporarily suspended on March 25, 2020 and March 20, 2020, respectively, before entering into phased restart
processes. Çöpler and Marigold continued to operate with limited impact from COVID-19, and the Company has implemented
numerous measures intended to protect its workforce, including ensuring physical distancing and providing additional protective
equipment, including, in respect of Çöpler, an Infectious Diseases Management Outbreak plan, which provides for, in
addition to physical distancing and protective equipment, screening, quarantine and treatment plans and logistics and supply chain
planning, among other things. While all the Company's mines are currently operating at expected levels, there is no guarantee that
its operations will not be the subject of new or additional suspensions or closures, in whole or in part, in the future.
The global responses to the COVID-19 pandemic
have led to significant restrictions on travel, temporary business closures, quarantines, stock market volatility, supplier and
vendor uncertainty and a general reduction in global consumer activity. The effects of the COVID-19 pandemic continue to evolve,
and governments may introduce new, or modify existing, laws, regulations, decrees or other orders that could impact the Company's
operations or affect its employees, suppliers, local communities, customers, and other stakeholders. In addition, there is the
risk that the responses of the relevant governments may be insufficient to contain the impact of the COVID-19 pandemic, which could
further impact the Company's ability to operate. Further, there is the risk that one or more of the Company's employees, contractors
or community members could contract COVID-19 or be directly affected by someone who contracts COVID-19 and is required to self-isolate.
This could impact the Company's workforce, its ability to operate at that location and the health of the surrounding community.
The Company has implemented what it believes to be the necessary protocols in each of its jurisdictions in which it operates in
order to adequately respond to developments relating to the COVID-19 pandemic, including to further protect the health and safety
of its workforce, their families and neighboring communities. However, with the uncertainties surrounding the continued development
of the COVID-19 pandemic and the resulting implications globally, there is no assurance that any protocols that have been or that
may be put in place will mitigate the risks or that they will not cause the Company to experience less favorable economic and/or
health and safety outcomes.
Finally, while the COVID-19 pandemic has
adversely impacted the Company's operations in the short term, it is difficult to predict the long term impact on the global economy,
which could in turn materially adversely affect its operations, financial results and/or liquidity position. These risks include,
but are not limited to, operational and supply chain delays and disruptions, labour shortages, social unrest, breach of material
contracts and customer agreements, increased insurance premiums and/or taxes, decreased demand or the inability to sell and deliver
precious metals, declines in the price of precious metals, delays in permitting or approvals, governmental disruptions, international
economic and political conditions, international or regional consumptive patterns, expectations on inflation or deflation, interest
rates, capital markets volatility, or other unknown but potentially significant impacts, including the possibility of a significant
protracted economic downturn, including a global recession. These factors may impact, among other things, the Company's operating
plans, production, liquidity and cash flows, valuation of its long-lived assets, the broader market and the trading price of SSR
Mining's common shares.
Given the uncertainty of the duration and
magnitude of the impact of the COVID-19 pandemic, the Company's future operations, including production and cash cost estimates,
are subject to a higher than normal degree of risk and uncertainty. It is unknown whether and how the Company's operations may
be affected if the COVID-19 pandemic persists for an extended period of time. Should the duration, spread or intensity of the COVID-19
pandemic further develop in 2021, SSR Mining's business, financial condition and results of operations could be more significantly
impacted.
SSR Mining Inc. | MD&A Q4 2020 | 48 |
| 13. | NON-GAAP FINANCIAL MEASURES |
The Company has included certain non-GAAP
performance measures throughout this document. These performance measures are employed by the Company to measure its operating
and economic performance internally and to assist in decision-making, as well as to provide key performance information to senior
management. The Company believes that, in addition to conventional measures prepared in accordance with GAAP, certain investors
and other stakeholders also use this information to evaluate its operating and financial performance; however, these non-GAAP performance
measures do not have any standardized meaning. Accordingly, these performance measures are intended to provide additional information
and should not be considered in isolation or as a substitute for measures of performance prepared in accordance with GAAP. These
non-GAAP measures should be read in conjunction with the Company's consolidated financial statements.
Non-GAAP Measure
- Cash Costs Per Ounce Sold
The Company uses cash costs per ounce of
precious metals sold, a non-GAAP financial measure, to monitor its operating performance internally, including operating cash costs.
The Company believes this measure provides investors and analysts with useful information about its underlying cash costs of operations
and the impact of by-product credits on its cost structure. The Company also believes it is a relevant metric used to understand
its operating profitability and ability to generate cash flow. When deriving the production costs associated with an ounce of precious
metal, the Company includes the by-product credits as it considers the cost to produce the gold or silver is reduced as a result
of the by-product sales incidental to the gold and silver production process, thereby allowing management and other stakeholders
to assess the net costs of gold and silver production. In calculating cash costs per ounce, the Company also excludes the impact
of specific items that are significant, but not reflective of its underlying operations, including the impact of measuring inventories
at fair value in connection with business combinations. When deriving the number of ounces of precious metal sold, the Company
considers the physical ounces available for sale after the treatment and refining process, commonly referred to as payable metal,
as this is what is sold to third parties. Cash costs per ounce metrics, net of by-product credits, are also used in the Company's
internal decision making processes.
The
following tables provide a reconciliation of cash costs per ounce sold to the consolidated financial statements:
| |
For the three months ended December 31, 2020 |
| |
Çöpler |
Marigold |
Seabee |
Puna |
Total |
| Production costs |
$ |
79,948 |
|
$ |
62,229 |
|
$ |
15,583 |
|
$ |
11,821 |
|
$ |
169,581 |
|
| By-product credits |
$ |
(1,158) |
|
$ |
(22) |
|
$ |
(33) |
|
$ |
(4,833) |
|
$ |
(6,046) |
|
| Treatment and refining charges |
$ |
— |
|
$ |
92 |
|
$ |
228 |
|
$ |
2,016 |
|
$ |
2,336 |
|
| Incremental COVID-19 related costs (1) |
$ |
(800) |
|
$ |
(398) |
|
$ |
(910) |
|
$ |
(475) |
|
$ |
(2,583) |
|
| Fair value adjustment on acquired inventories |
$ |
(28,261) |
|
$ |
— |
|
$ |
— |
|
$ |
— |
|
$ |
(28,261) |
|
| Cash costs |
$ |
49,729 |
|
$ |
61,901 |
|
$ |
14,868 |
|
$ |
8,529 |
|
$ |
135,027 |
|
| |
|
|
|
|
|
| Gold sold (oz) |
80,388 |
|
73,872 |
|
28,000 |
|
— |
|
182,260 |
|
| Silver sold (oz) |
— |
|
— |
|
— |
|
955,893 |
|
955,893 |
|
| Gold equivalent sold (oz) (3, 4) |
80,388 |
|
73,872 |
|
28,000 |
|
12,602 |
|
194,862 |
|
| |
|
|
|
|
|
| Cash cost per gold ounce sold |
$ |
619 |
|
$ |
838 |
|
$ |
531 |
|
NA |
NA |
| Cash cost per silver ounce sold |
NA |
NA |
NA |
$ |
8.92 |
|
NA |
| Cash cost per gold equivalent ounce sold |
$ |
619 |
|
$ |
838 |
|
$ |
531 |
|
$ |
677 |
|
$ |
693 |
|
SSR Mining Inc. | MD&A Q4 2020 | 49 |
| 13. | NON-GAAP FINANCIAL MEASURES (continued) |
| |
For the three months ended December 31, 2019 |
| |
Marigold |
Seabee |
Puna |
Total |
| Production costs |
$ |
47,473 |
|
$ |
12,282 |
|
$ |
29,424 |
|
$ |
89,179 |
|
| By-product credits |
$ |
(19) |
|
$ |
(24) |
|
$ |
(10,388) |
|
$ |
(10,431) |
|
| Treatment and refining charges |
$ |
62 |
|
$ |
46 |
|
$ |
2,916 |
|
$ |
3,024 |
|
| Cash costs |
$ |
47,516 |
|
$ |
12,304 |
|
$ |
21,952 |
|
$ |
81,772 |
|
| |
|
|
|
|
| Gold sold (oz) |
61,054 |
|
24,350 |
|
— |
|
85,404 |
|
| Silver sold (oz) |
— |
|
— |
|
2,466,481 |
|
2,466,481 |
|
| Gold equivalent sold (oz) (3, 4) |
61,054 |
|
24,350 |
|
28,864 |
|
114,268 |
|
| |
|
|
|
|
| Cash cost per gold ounce sold |
$ |
778 |
|
$ |
505 |
|
NA |
NA |
| Cash cost per silver ounce sold |
NA |
NA |
$ |
8.90 |
|
NA |
| Cash cost per gold equivalent ounce sold |
$ |
778 |
|
$ |
505 |
|
$ |
761 |
|
$ |
716 |
|
| |
For the year ended December 31, 2020 |
| |
Çöpler (2) |
Marigold |
Seabee |
Puna |
Total |
| Production costs |
$ |
120,618 |
|
$ |
196,409 |
|
$ |
41,308 |
|
$ |
60,317 |
|
$ |
418,652 |
|
| By-product credits |
$ |
(1,158) |
|
$ |
(53) |
|
$ |
(53) |
|
$ |
(16,018) |
|
$ |
(17,282) |
|
| Treatment and refining charges |
$ |
— |
|
$ |
214 |
|
$ |
298 |
|
$ |
6,601 |
|
$ |
7,113 |
|
| Incremental COVID-19 related costs (5) |
$ |
(1,014) |
|
$ |
(769) |
|
$ |
(1,189) |
|
$ |
(475) |
|
$ |
(3,447) |
|
| Fair value adjustment on acquired inventories |
$ |
(51,931) |
|
$ |
— |
|
$ |
— |
|
$ |
— |
|
$ |
(51,931) |
|
| Cash costs |
$ |
66,516 |
|
$ |
195,801 |
|
$ |
40,364 |
|
$ |
50,425 |
|
$ |
353,105 |
|
| |
|
|
|
|
|
| Gold sold (oz) |
108,283 |
|
229,892 |
|
75,600 |
|
— |
|
413,775 |
|
| Silver sold (oz) |
— |
|
— |
|
— |
|
4,411,087 |
|
4,411,087 |
|
| Gold equivalent sold (oz) (2, 3) |
108,283 |
|
229,892 |
|
75,600 |
|
51,696 |
|
465,471 |
|
| |
|
|
|
|
|
| Cash cost per gold ounce sold |
$ |
614 |
|
$ |
852 |
|
$ |
534 |
|
NA |
NA |
| Cash cost per silver ounce sold |
NA |
NA |
NA |
$ |
11.43 |
|
NA |
| Cash cost per gold equivalent ounce sold |
$ |
614 |
|
$ |
852 |
|
$ |
534 |
|
$ |
975 |
|
$ |
759 |
|
| |
For the year ended December 31, 2019 |
| |
Marigold |
Seabee |
Puna |
Total |
| Production costs |
$ |
183,782 |
|
$ |
48,470 |
|
$ |
97,558 |
|
$ |
329,810 |
|
| By-product credits |
$ |
(71) |
|
$ |
(50) |
|
$ |
(32,988) |
|
$ |
(33,109) |
|
| Treatment and refining charges |
$ |
259 |
|
$ |
127 |
|
$ |
10,199 |
|
$ |
10,585 |
|
| Cash costs |
$ |
183,970 |
|
$ |
48,547 |
|
$ |
74,769 |
|
$ |
307,286 |
|
| |
|
|
|
|
| Gold sold (oz) |
226,823 |
|
104,527 |
|
— |
|
331,350 |
|
| Silver sold (oz) |
— |
|
— |
|
7,204,312 |
|
7,204,312 |
|
| Gold equivalent sold (oz) (3, 4) |
226,823 |
|
104,527 |
|
84,033 |
|
415,383 |
|
| |
|
|
|
|
| Cash cost per gold ounce sold |
$ |
811 |
|
$ |
464 |
|
NA |
NA |
| Cash cost per silver ounce sold |
NA |
NA |
$ |
10.38 |
|
NA |
| Cash cost per gold equivalent ounce sold |
$ |
811 |
|
$ |
464 |
|
$ |
890 |
|
$ |
740 |
|
| (1) | COVID-19 related costs include direct, incremental costs associated with COVID-19. |
| (2) | The data presented in this column is for the period from September 16, 2020 to December 31, 2020,
the period for which the Company was entitled to all economic benefits of Çöpler following its acquisition of Alacer. |
| (3) | Gold equivalent ounces have been established using realized metal prices per ounce of precious
metal sold in the period and applied to the recovered metal content of the gold and silver sold by Çöpler, Marigold,
Seabee and Puna. The Company has not included lead and zinc as they are considered a by-product. |
| (4) | Gold equivalent ounces sold may not re-calculate based on amounts presented in this table due to
rounding. |
SSR Mining Inc. | MD&A Q4 2020 | 50 |
Non-GAAP Measure - AISC
Per Ounce Sold
AISC includes total production costs incurred
at the Company's mining operations, which forms the basis of its by-product cash costs. Additionally, the Company includes sustaining
capital expenditures, sustaining mine-site exploration and evaluation costs, reclamation cost accretion and amortization and general
and administrative expenses. This measure seeks to reflect the ongoing cost of gold and silver production from current operations;
therefore, expansionary capital and non-sustaining expenditures are excluded. Certain other cash expenditures, including tax payments
and financing costs are also excluded.
The Company believes that this measure
represents the total costs of producing gold and silver from current operations and provides the Company and other stakeholders
with additional information about its operating performance and ability to generate cash flows. It allows the Company to assess
its ability to support capital expenditures and to sustain future production from the generation of operating cash flows.
As described above, AISC includes total
production costs incurred at the Company's mining operations, which forms the basis of its cash costs and which are reconciled
to reported production costs in the tables above.
The following tables provide a reconciliation
of total AISC per ounce to the consolidated financial statements:
| |
For the three months ended December 31, 2020 |
| |
Çöpler |
Marigold |
Seabee |
Puna |
Corporate |
Total |
| Cash costs |
$ |
49,729 |
|
$ |
61,901 |
|
$ |
14,868 |
|
$ |
8,529 |
|
$ |
— |
|
$ |
135,027 |
|
| Sustaining capital expenditures |
$ |
9,724 |
|
$ |
15,321 |
|
$ |
7,059 |
|
$ |
4,882 |
|
$ |
— |
|
$ |
36,986 |
|
| Sustaining exploration and evaluation expense |
$ |
(150) |
|
$ |
939 |
|
$ |
— |
|
$ |
10 |
|
$ |
— |
|
$ |
799 |
|
| Reclamation cost accretion and amortization |
$ |
563 |
|
$ |
778 |
|
$ |
104 |
|
$ |
598 |
|
$ |
— |
|
$ |
2,043 |
|
| General and administrative expense and share-based compensation expense |
$ |
251 |
|
$ |
76 |
|
$ |
15 |
|
$ |
1,179 |
|
$ |
13,876 |
|
$ |
15,397 |
|
| Total AISC |
$ |
60,117 |
|
$ |
79,015 |
|
$ |
22,046 |
|
$ |
15,198 |
|
$ |
13,876 |
|
$ |
190,252 |
|
| |
|
|
|
|
|
|
| Gold sold (oz) |
80,388 |
|
73,872 |
|
28,000 |
|
— |
|
— |
|
182,260 |
|
| Silver sold (oz) |
— |
|
— |
|
— |
|
955,893 |
|
— |
|
955,893 |
|
| Gold equivalent sold (oz) (2, 3) |
80,388 |
|
73,872 |
|
28,000 |
|
12,602 |
|
— |
|
194,862 |
|
| |
|
|
|
|
|
|
| AISC per gold ounce sold |
$ |
748 |
|
$ |
1,070 |
|
$ |
787 |
|
NA |
NA |
NA |
| AISC per silver ounce sold |
NA |
NA |
NA |
$ |
15.90 |
|
NA |
NA |
| AISC per gold equivalent ounce sold |
$ |
748 |
|
$ |
1,070 |
|
$ |
787 |
|
$ |
1,206 |
|
NA |
$ |
976 |
|
SSR Mining Inc. | MD&A Q4 2020 | 51 |
| 13. | NON-GAAP FINANCIAL MEASURES (continued) |
| |
For the three months ended December 31, 2019 |
| |
Marigold |
Seabee |
Puna |
Corporate |
Total |
| Cash costs |
$ |
47,516 |
|
$ |
12,304 |
|
$ |
21,952 |
|
$ |
— |
|
$ |
81,772 |
|
| Sustaining capital expenditures |
$ |
19,884 |
|
$ |
5,946 |
|
$ |
4,699 |
|
$ |
— |
|
$ |
30,529 |
|
| Sustaining exploration and evaluation expense |
$ |
332 |
|
$ |
— |
|
$ |
492 |
|
$ |
— |
|
$ |
824 |
|
| Reclamation cost accretion and amortization |
$ |
449 |
|
$ |
35 |
|
$ |
433 |
|
$ |
— |
|
$ |
917 |
|
| General and administrative expense and share-based compensation expense |
$ |
— |
|
$ |
— |
|
$ |
— |
|
$ |
10,242 |
|
$ |
10,242 |
|
| Total AISC |
$ |
68,181 |
|
$ |
18,285 |
|
$ |
27,576 |
|
$ |
10,242 |
|
$ |
124,284 |
|
| |
|
|
|
|
|
| Gold sold (oz) |
61,054 |
|
24,350 |
|
— |
|
— |
|
85,404 |
|
| Silver sold (oz) |
— |
|
— |
|
2,466,481 |
|
— |
|
2,466,481 |
|
| Gold equivalent sold (oz) (2, 3) |
61,054 |
|
24,350 |
|
28,864 |
|
— |
|
114,268 |
|
| |
|
|
|
|
|
| AISC per gold ounce sold |
$ |
1,117 |
|
$ |
751 |
|
NA |
NA |
NA |
| AISC per silver ounce sold |
NA |
NA |
$ |
11.18 |
|
NA |
NA |
| AISC per gold equivalent ounce sold |
$ |
1,117 |
|
$ |
751 |
|
$ |
955 |
|
NA |
$ |
1,088 |
|
| |
For the year ended December 31, 2020 |
| |
Çöpler (1) |
Marigold |
Seabee |
Puna |
Corporate |
Total |
| Cash costs |
$ |
66,516 |
|
$ |
195,801 |
|
$ |
40,364 |
|
$ |
50,425 |
|
$ |
— |
|
$ |
353,106 |
|
| Sustaining capital expenditures |
$ |
12,893 |
|
$ |
78,362 |
|
$ |
30,325 |
|
$ |
12,527 |
|
$ |
— |
|
$ |
134,107 |
|
| Sustaining exploration and evaluation expense |
$ |
162 |
|
$ |
4,257 |
|
$ |
— |
|
$ |
204 |
|
$ |
— |
|
$ |
4,623 |
|
| Reclamation cost accretion and amortization |
$ |
649 |
|
$ |
2,149 |
|
$ |
209 |
|
$ |
2,452 |
|
$ |
— |
|
$ |
5,459 |
|
| General and administrative expense and share-based compensation expense |
$ |
251 |
|
$ |
435 |
|
$ |
127 |
|
$ |
1,520 |
|
$ |
30,158 |
|
$ |
32,491 |
|
| Total AISC |
$ |
80,471 |
|
$ |
281,004 |
|
$ |
71,025 |
|
$ |
67,128 |
|
$ |
30,158 |
|
$ |
529,786 |
|
| |
|
|
|
|
|
|
| Gold sold (oz) |
108,283 |
|
229,892 |
|
75,600 |
|
— |
|
— |
|
413,775 |
|
| Silver sold (oz) |
— |
|
— |
|
— |
|
4,411,087 |
|
— |
|
4,411,087 |
|
| Gold equivalent sold (oz) (2, 3) |
108,283 |
|
229,892 |
|
75,600 |
|
51,696 |
|
— |
|
465,471 |
|
| |
|
|
|
|
|
|
| AISC per gold ounce sold |
$ |
743 |
|
$ |
1,222 |
|
$ |
939 |
|
NA |
NA |
NA |
| AISC per silver ounce sold |
NA |
NA |
NA |
$ |
15.22 |
|
NA |
NA |
| AISC per gold equivalent ounce sold |
$ |
743 |
|
$ |
1,222 |
|
$ |
939 |
|
$ |
1,299 |
|
NA |
$ |
1,138 |
|
SSR Mining Inc. | MD&A Q4 2020 | 52 |
| 13. | NON-GAAP FINANCIAL MEASURES (continued) |
| |
For the year ended December 31, 2019 |
| |
Marigold |
Seabee |
Puna |
Corporate |
Total |
| Cash costs |
$ |
183,970 |
|
$ |
48,547 |
|
$ |
74,769 |
|
$ |
— |
|
$ |
307,286 |
|
| Sustaining capital expenditures |
$ |
45,666 |
|
$ |
33,558 |
|
$ |
23,087 |
|
$ |
— |
|
$ |
102,311 |
|
| Sustaining exploration and evaluation expense |
$ |
3,258 |
|
$ |
2,624 |
|
$ |
787 |
|
$ |
— |
|
$ |
6,669 |
|
| Reclamation cost accretion and amortization |
$ |
1,555 |
|
$ |
137 |
|
$ |
2,622 |
|
$ |
— |
|
$ |
4,314 |
|
| General and administrative expense and share-based compensation expense |
$ |
— |
|
$ |
— |
|
$ |
— |
|
$ |
30,929 |
|
$ |
30,929 |
|
| Total AISC |
$ |
234,449 |
|
$ |
84,866 |
|
$ |
101,265 |
|
$ |
30,929 |
|
$ |
451,509 |
|
| |
|
|
|
|
|
| Gold sold (oz) |
226,823 |
|
104,527 |
|
— |
|
— |
|
331,350 |
|
| Silver sold (oz) |
— |
|
— |
|
7,204,312 |
|
— |
|
7,204,312 |
|
| Gold equivalent sold (oz) (2, 3) |
226,823 |
|
104,527 |
|
84,033 |
|
— |
|
415,383 |
|
| |
|
|
|
|
|
| AISC per gold ounce sold |
$ |
1,034 |
|
$ |
812 |
|
NA |
NA |
NA |
| AISC per silver ounce sold |
NA |
NA |
$ |
14.06 |
|
NA |
NA |
| AISC per gold equivalent ounce sold |
$ |
1,034 |
|
$ |
812 |
|
$ |
1,205 |
|
NA |
$ |
1,087 |
|
| (1) | The data presented in this column is for the period from September 16, 2020 to December 31, 2020,
the period for which the Company was entitled to all economic benefits of Çöpler following its acquisition of Alacer. |
| (2) | Gold equivalent ounces have been established using realized metal prices per ounce of precious
metal sold in the period and applied to the recovered metal content of the gold and silver sold by Çöpler, Marigold,
Seabee and Puna. The Company has not included lead and zinc as they are considered a by-product. |
| (3) | Gold equivalent ounces sold may not re-calculate based on amounts presented in this table due to
rounding. |
Non-GAAP Measure - Adjusted Attributable
Net Income
Adjusted attributable net income and adjusted
attributable net income per share are used by management and investors to measure the Company's underlying operating performance.
Adjusted attributable net income is defined as net income adjusted to exclude the after-tax impact of specific items that are significant,
but not reflective of the Company's underlying operations, including the impact of measuring inventories and mineral properties
at fair value in connection with business combinations; impairment adjustments and reversals; foreign exchange gains (losses),
including those related to deferred tax balances; transaction and integration expenses; changes in tax rates and other non-recurring
items.
In prior periods, adjusted attributable
net income was also adjusted to exclude non-cash finance expense, net of non-cash finance income and any write-downs of inventories
to net realizable value. These items are no longer excluded as they are considered to occur from time to time in the normal course
of operations. In addition, in prior periods, adjustments to net income were not individually tax-effected. The Company's calculation
of adjusted attributable net income now tax effects each adjusting item within the "income tax impact related to above adjustments"
line item. The calculations of adjusted attributable net income and adjusted attributable net income per share for prior periods
have been conformed with the presentation in the current period.
SSR Mining Inc. | MD&A Q4 2020 | 53 |
| 13. | NON-GAAP FINANCIAL MEASURES (continued) |
The following table provides a reconciliation
of adjusted attributable net income to the consolidated financial statements:
| (in thousands of USD, unless otherwise noted) |
Three months ended December 31 |
Year ended December 31 |
| |
2020 |
2019 |
2020 |
2019 |
| Net income attributable to equity holders of SSR Mining |
$ |
89,039 |
|
$ |
19,479 |
|
$ |
133,494 |
|
$ |
57,315 |
|
| Adjustments: |
|
|
|
|
| Fair value adjustment on acquired assets |
28,111 |
|
— |
|
48,894 |
|
— |
|
| Care and maintenance expense |
1,896 |
|
— |
|
29,593 |
|
— |
|
| COVID-19 related costs (1) |
2,583 |
|
— |
|
3,447 |
|
— |
|
| Foreign exchange loss |
2,952 |
|
4,633 |
|
3,755 |
|
5,359 |
|
| Transaction and integration expense |
2,334 |
|
— |
|
20,813 |
|
— |
|
| Loss on redemption of convertible notes |
— |
|
— |
|
— |
|
5,423 |
|
| Other adjusting items (2) |
(5,327) |
|
1,390 |
|
(12,490) |
|
1,390 |
|
| Income tax impact related to above adjustments |
(6,606) |
|
(745) |
|
(22,465) |
|
(2,359) |
|
| Foreign exchange (gain) loss on deferred tax balances |
(2,665) |
|
1,854 |
|
15,860 |
|
21,321 |
|
| Inflationary impacts on tax balances |
(3,504) |
|
(2,894) |
|
(7,729) |
|
(9,691) |
|
| Adjusted net income attributable to equity holders of SSR Mining |
$ |
108,813 |
|
$ |
23,717 |
|
$ |
213,172 |
|
$ |
78,758 |
|
| |
|
|
|
|
| Weighted average shares outstanding ('000s) |
219,504 |
|
121,742 |
|
151,144 |
|
121,769 |
|
| Adjusted basic attributable income per share to equity holders of SSR Mining |
$ |
0.50 |
|
$ |
0.19 |
|
$ |
1.41 |
|
$ |
0.65 |
|
| (1) | COVID-19 related costs include direct, incremental costs associated with COVID-19 at all operations. |
| (2) | For the year ended December 31, 2020, Other adjusting items includes a gain of $6.2 million (December
31, 2019 - $nil) related to the sale of marketable securities and a gain of $4.5 million (December 31, 2019 - $nil) related to
the acquisition of mineral properties. |
SSR Mining Inc. | MD&A Q4 2020 | 54 |
| 13. | NON-GAAP FINANCIAL MEASURES (continued) |
Non-GAAP
Measure - Free Cash Flow
The Company uses free cash flow, a non-GAAP
financial measure, to supplement information in its consolidated financial statements. The Company believes that in addition to
conventional measures prepared in accordance with IFRS, certain investors and analysts use this information to evaluate the ability
of the Company to generate cash flow after capital investments and build the Company's cash resources. The Company calculates free
cash flow by deducting cash capital spending from cash generated by operating activities.
Free cash flow is reconciled to the amounts
included in the consolidated statements of cash flows as follows:
| (in thousands of USD, unless otherwise noted) |
Three months ended December 31 |
Year ended December 31 |
| |
2020 |
2019 |
2020 |
2019 |
| Cash generated by operating activities |
$ |
217,383 |
|
$ |
51,917 |
|
$ |
348,615 |
|
$ |
145,844 |
|
| Expenditures on mineral properties, plant and equipment |
(60,375) |
|
(25,029) |
|
(169,340) |
|
(135,768) |
|
| Free cash flow |
$ |
157,008 |
|
$ |
26,888 |
|
$ |
179,275 |
|
$ |
10,076 |
|
Non-GAAP Measure - Earnings
Before Interest, Taxes, Depreciation and Amortization ("EBITDA") and Adjusted EBITDA
EBITDA represents net income before interest,
taxes, depreciation, and amortization. EBITDA is an indicator of the Company's ability to generate liquidity by producing operating
cash flow to fund working capital needs, service debt obligations, and fund capital expenditures.
Adjusted EBITDA represents net income before
interest, taxes, depreciation, and amortization, adjusted to exclude the impact of specific items that are significant, but not
reflective of the Company's underlying operations, including the impact of measuring inventories at fair value in connection with
business combinations; impairment adjustments and reversals; foreign exchange gains (losses); transaction and integration expenses;
unrealized gains (losses) on derivatives; and other non-recurring items.
The following is a reconciliation of EBITDA
and adjusted EBITDA to the consolidated financial statements:
| (in thousands of USD, unless otherwise noted) |
Three months ended December 31 |
Year ended December 31 |
| |
2020 |
2019 |
2020 |
2019 |
| Net income |
$ |
97,654 |
|
$ |
19,479 |
|
$ |
140,468 |
|
$ |
55,757 |
|
| Depletion and depreciation |
54,742 |
|
31,321 |
|
126,429 |
|
108,247 |
|
| Interest and other finance income |
(636) |
|
(1,669) |
|
(6,545) |
|
(11,910) |
|
| Interest expense and other finance costs |
7,577 |
|
7,545 |
|
26,787 |
|
31,598 |
|
| Income tax expense |
13,048 |
|
11,669 |
|
40,853 |
|
30,372 |
|
| EBITDA |
$ |
172,385 |
|
$ |
68,345 |
|
$ |
327,992 |
|
$ |
214,064 |
|
| Fair value adjustment on acquired inventories |
28,261 |
|
— |
|
51,931 |
|
— |
|
| Care and maintenance expense |
1,896 |
|
— |
|
29,593 |
|
— |
|
| COVID-19 related costs (1) |
2,583 |
|
— |
|
3,447 |
|
— |
|
| Foreign exchange loss |
2,952 |
|
4,633 |
|
3,755 |
|
5,359 |
|
| Transaction and integration expense |
2,334 |
|
— |
|
20,813 |
|
— |
|
| Loss on redemption of convertible notes |
— |
|
— |
|
— |
|
5,423 |
|
| Other adjusting items |
(5,327) |
|
1,390 |
|
(12,490) |
|
1,390 |
|
| Adjusted EBITDA |
$ |
205,084 |
|
$ |
74,368 |
|
$ |
425,041 |
|
$ |
226,236 |
|
| (1) | COVID-19 related costs include direct, incremental costs associated with COVID-19 at all operations. |
| (2) | For the year ended December 31, 2020, Other adjusting items includes a gain of $6.2 million (December
31, 2019 - $nil) related to the sale of marketable securities and a gain of $4.5 million (December 31, 2019 - $nil) related to
the acquisition of mineral properties. |
SSR Mining Inc. | MD&A Q4 2020 | 55 |
| 13. | NON-GAAP FINANCIAL MEASURES (continued) |
Non-GAAP
Measure - Consolidated Cash
The Company uses consolidated cash, a non-GAAP
financial measure, to supplement information in its consolidated financial statements. Consolidated cash does not have any standardized
meaning prescribed under IFRS, and therefore it may not be comparable to similar measures employed by other companies. The Company
believes consolidated cash provides useful information to investors as it shows the underlying cash position on a consolidated
basis, especially as it is compared on a relative basis to the Company's debt position. The Company calculates consolidated cash
as cash and cash equivalents plus restricted cash, which is shown as a non-current asset in the consolidated statement of financial
position, and attributable cash held by joint ventures accounted for using the equity method.
The quantitative reconciliation from cash
and cash equivalents as shown in the consolidated statement of financial position to the non-GAAP measure of consolidated cash
is shown in the table below:
| (in thousands of USD, unless otherwise noted) |
December 31, 2020 |
December 31, 2019 |
| Cash and cash equivalents |
$ |
860,637 |
|
$ |
503,647 |
|
| Add: Restricted cash |
35,288 |
|
2,339 |
|
| Add: Attributable cash held by joint ventures accounted for using the equity method |
1,042 |
|
— |
|
| Consolidated Cash |
$ |
896,967 |
|
$ |
505,986 |
|
| 14. | CRITICAL ACCOUNTING POLICIES AND ESTIMATES |
Basis of preparation
and accounting policies
The Company's consolidated financial statements
have been prepared in accordance with IFRS as issued by the IASB. Note 2 of the Company's consolidated financial statements for
the year ended December 31, 2020 provides details of the significant accounting policies for significant or potentially significant
areas that have had an impact on the Company's financial statements or may have an impact in future periods. The impact of future
accounting changes is disclosed in note 2(q) to the Company's consolidated financial statements.
Critical accounting
estimates and judgments
The preparation of financial statements
in conformity with IFRS requires the use of judgments and/or estimates that affect the amounts reported and disclosed in the consolidated
financial statements and related notes. Critical accounting estimates represent estimates that are uncertain and for which changes
in those estimates could materially impact the consolidated financial statements. Areas of judgment and key sources of estimation
uncertainty that have the most significant effect are disclosed in note 3 of the Company's consolidated financial statements for
the year ended December 31, 2020.
| 15. | INTERNAL CONTROL OVER FINANCIAL REPORTING AND DISCLOSURE CONTROLS AND PROCEDURES |
Disclosure Controls
and Procedures
The Company's management, with the participation
of the Company's President and Chief Executive Officer and Chief Financial Officer, has evaluated the effectiveness of the Company's
disclosure controls and procedures. Based upon the results of that evaluation, the President and Chief Executive Officer and Chief
Financial Officer have concluded that, as of the end of the period covered by this MD&A, the disclosure controls and procedures
were effective to provide reasonable assurance that the information required to be disclosed by the Company in the reports that
are filed is recorded, processed, summarized and reported within the appropriate time periods and is accumulated and communicated
to management, including the President and Chief Executive Officer and Chief Financial Officer, as appropriate to allow timely
decisions regarding required disclosure.
SSR Mining Inc. | MD&A Q4 2020 | 56 |
| 15. | INTERNAL CONTROL OVER FINANCIAL REPORTING AND DISCLOSURE CONTROLS AND PROCEDURES (continued) |
Internal Control Over
Financial Reporting
The Company's management, with the
participation of the Company's President and Chief Executive Officer and Chief Financial Officer, is responsible for establishing
and maintaining adequate internal control over financial reporting. Under the supervision of the President and Chief Executive
Officer and Chief Financial Officer, the Company's internal control over financial reporting is a process designed to provide reasonable
assurance regarding the reliability of financial reporting and the preparation of financial statements for external purposes in
accordance with IFRS. The Company's internal control over financial reporting includes policies and procedures that:
| • | pertain to maintenance of records that
accurately and fairly reflect, in reasonable detail, the transactions and dispositions of assets; |
| • | provide reasonable assurance that transactions
are recorded as necessary to permit preparation of financial statements in accordance with IFRS and that receipts and expenditures
are made only in accordance with authorizations of management and the Board of Directors' and |
| • | provide reasonable assurance regarding
prevention or timely detection of unauthorized acquisition, use, or disposition of the Company's assets that could have a material
effect on the consolidated financial statements. |
Beginning in March 2020, all corporate
office staff and many site administrative personnel began working from home in response to the COVID-19 pandemic. This change required
certain processes and controls that were previously performed or documented manually to be completed and retained in electronic
form.
In conjunction with the acquisition
of Alacer on September 16, 2020, there are now two corporate offices, one in Denver, Colorado and one in Vancouver, British Columbia,
as well as new regional management in Turkey. In addition, the Company has a new management team, led by Rod Antal as President
& CEO.
The Company's management has assessed
the effectiveness of the Company's internal control over financial reporting as of December 31, 2020. In making this assessment,
management used the criteria established in Internal Control - Integrated Framework (2013) issued by the Committee of Sponsoring
Organizations of the Treadway Commission. Based on this evaluation, management concluded that the Company's internal control over
financial reporting was effective as of December 31, 2020.
Management has excluded Alacer, which
was acquired on September 16, 2020, from the assessment of the effectiveness of internal control over financial reporting as of
December 31, 2020. The assets and revenues of Alacer represent 67% and 24%, respectively, of the related consolidated financial
statement amounts as of and for the year ended December 31, 2020.
The effectiveness of the Company's
internal control over financial reporting, as of December 31, 2020, has been audited by PricewaterhouseCoopers LLP, an independent
registered public accounting firm, who also audited the consolidated financial statements as of and for the years ended December
31, 2020, and 2019, as stated in its report which accompanies the consolidated financial statements.
Limitations of Controls
and Procedures
The Company's management, including
the President and Chief Executive Officer and Chief Financial Officer, believes that any disclosure controls and procedures or
internal control over financial reporting, no matter how well conceived and operated can provide only reasonable, not absolute,
assurance that the objectives of the control system are met. Further, the design of a control system must reflect the fact that
there are resource constraints, and the benefits of controls must be considered relative to their costs. Because of the inherent
limitations in all control systems, they cannot provide absolute assurance that all control issues and instances of fraud, if any,
within the organization have been prevented or detected. These inherent limitations include the realities that judgments in decision-making
can be faulty, and that breakdowns can occur because of simple error or mistake. Additionally, controls can be circumvented by
the individual acts of some persons, by collusion of two or more people, or by unauthorized override of the control.
SSR Mining Inc. | MD&A Q4 2020 | 57 |
| 15. | INTERNAL CONTROL OVER FINANCIAL REPORTING AND DISCLOSURE CONTROLS AND PROCEDURES (continued) |
The design of any control system
also is based in part upon certain assumptions about the likelihood of future events, and there can be no assurance that any design
will succeed in achieving its stated goals under all potential future conditions. Accordingly, because of the inherent limitations
in a cost effective control system, misstatements due to error or fraud may occur and not be detected.
| 16. | CAUTIONARY NOTES REGARDING FORWARD-LOOKING STATEMENTS AND MINERAL RESERVES AND MINERAL
RESOURCES ESTIMATES |
Cautionary Note
Regarding Forward-Looking Statements
Except for statements of historical fact
relating to the Company, certain statements contained in this MD&A constitute forward-looking information, future oriented
financial information, or financial outlooks (collectively “forward-looking information”) within the meaning of Canadian
securities laws. Forward-looking information may be contained in this document and the Company’s other public filings. Forward-looking
information relates to statements concerning the Company’s outlook and anticipated events or results and in some cases, can
be identified by terminology such as “may”, “will”, “could”, “should”, “expect”,
“plan”, “anticipate”, “believe”, “intend”, “estimate”, “projects”,
“predict”, “potential”, “continue” or other similar expressions concerning matters that are
not historical facts.
Forward-looking statements in this MD&A
are based on certain key expectations and assumptions made by the Company. Although the Company believes that the expectations
and assumptions on which such forward-looking statements are based are reasonable, undue reliance should not be placed on the forward-looking
statements because the Company can give no assurance that they will prove to be correct. Forward-looking statements are subject
to various risks and uncertainties which could cause actual results and experience to differ materially from the anticipated results
or expectations expressed in this MD&A. The key risks and uncertainties include, but are not limited to: local and global political
and economic conditions; governmental and regulatory requirements and actions by governmental authorities, including changes in
government policy, government ownership requirements, changes in environmental, tax and other laws or regulations and the interpretation
thereof; developments with respect to COVID-19 pandemic, including the duration, severity and scope of the pandemic and potential
impacts on mining operations; and other risk factors detailed from time to time in the Company’s reports filed with the Canadian
securities regulatory authorities.
Forward-looking statements in this MD&A
include statements concerning, among other things: forecasts; outlook; timing of production; production, cost, operating and capital
expenditure guidance; the Company’s intention to return excess attributable free cash flow to shareholders; the timing and
implementation of the Company’s dividend policy; the implementation of any share buyback program; statements regarding plans
or expectations for the declaration of future dividends and the amount thereof; future cash costs and AISC per ounce of gold, silver
and other metals sold; the prices of gold, silver and other metals; Mineral Resources, Mineral Reserves, realization of Mineral
Reserves, and the existence or realization of Mineral Resource estimates; the Company’s ability to discover new areas of
mineralization; the timing and extent of capital investment at the Company’s operations; the timing and extent of capitalized
stripping at the Company’s operations; the timing of production and production levels and the results of the Company’s
exploration and development programs; current financial resources being sufficient to carry out plans, commitments and business
requirements for the next twelve months; movements in commodity prices not impacting the value of any financial instruments; estimated
production rates for gold, silver and other metals produced by the Company; the estimated cost of sustaining capital; availability
of sufficient financing; receipt of regulatory approvals; the timing of studies, announcements, and analysis; the timing of construction
and development of proposed mines and process facilities; ongoing or future development plans and capital replacement; estimates
of expected or anticipated economic returns from the Company’s mining projects, including future sales of metals, concentrate
or other products produced by the Company and the timing thereof; the Company’s plans and expectations for its properties
and operations; and all other timing, exploration, development, operational, financial, budgetary, economic, legal, social, environmental,
regulatory, and political matters that may influence or be influenced by future events or conditions.
SSR Mining Inc. | MD&A Q4 2020 | 58 |
| 16. | CAUTIONARY NOTES REGARDING FORWARD-LOOKING STATEMENTS AND MINERAL RESERVES AND MINERAL
RESOURCES ESTIMATES (continued) |
Such forward-looking information and statements
are based on a number of material factors and assumptions, including, but not limited in any manner to, those disclosed in any
other of the Company’s filings, and include: the inherent speculative nature of exploration results; the ability to explore;
communications with local stakeholders; maintaining community and governmental relations; status of negotiations of joint ventures;
weather conditions at the Company’s operations; commodity prices; the ultimate determination of and realization of Mineral
Reserves; existence or realization of Mineral Resources; the development approach; availability and receipt of required approvals,
titles, licenses and permits; sufficient working capital to develop and operate the mines and implement development plans; access
to adequate services and supplies; foreign currency exchange rates; interest rates; access to capital markets and associated cost
of funds; availability of a qualified work force; ability to negotiate, finalize, and execute relevant agreements; lack of social
opposition to the Company’s mines or facilities; lack of legal challenges with respect to the Company’s properties;
the timing and amount of future production; the ability to meet production, cost, and capital expenditure targets; timing and ability
to produce studies and analyses; capital and operating expenditures; economic conditions; availability of sufficient financing;
the ultimate ability to mine, process, and sell mineral products on economically favorable terms; and any and all other timing,
exploration, development, operational, financial, budgetary, economic, legal, social, geopolitical, regulatory and political factors
that may influence future events or conditions. While the Company considers these factors and assumptions to be reasonable based
on information currently available to the Company, they may prove to be incorrect.
The above list is not exhaustive of the
factors that may affect any of the Company’s forward-looking statements and information. You should not place undue reliance
on forward-looking information and statements. Forward-looking information and statements are only predictions based on the Company’s
current expectations and the Company’s projections about future events. Actual results may vary from such forward-looking
information for a variety of reasons including, but not limited to, risks and uncertainties disclosed in the Company’s filings
on the Company’s website at www.ssrmining.com, on SEDAR at www.sedar.com, on EDGAR at www.sec.gov and on the ASX at www.asx.com.au
and other unforeseen events or circumstances. Other than as required by law, the Company do not intend, and undertake no obligation
to update any forward-looking information to reflect, among other things, new information or future events.
Qualified Persons
Except as set out herein, the scientific
and technical information contained in this MD&A relating to Çöpler has been reviewed and approved by Robert L.
Clifford, SME Registered Member, and Dr. Cengiz Y. Demirci, AIPG (CPG), each of whom is a qualified person under NI 43-101. Mr.
Clifford is the Company's Director, Mine Planning and Dr. Demirci is the Company's Vice President, Exploration. The scientific
and technical information contained in this MD&A relating to Marigold has been reviewed and approved by Greg Gibson, , and
James N. Carver, each of whom is a SME Registered Member and a qualified person under NI 43-101. Mr. Gibson is the Company's General
Manager and Mr. Carver is the Company's Resource Development Manager, USA. The scientific and technical information contained in
this MD&A relating to Seabee has been reviewed and approved by Samuel Mah, P.Eng., and Jeffrey Kulas, P.Geo., each of whom
is a qualified person under NI 43-101. Mr. Mah is the Company's Director, Mine Planning, and Mr. Kulas is the Company's Resource
Development Manager, Canada. The scientific and technical information contained in this MD&A relating to Puna has been reviewed
and approved by Robert Gill, P.Eng., and Karthik Rathnam, MAusIMM (CP), each of whom is a qualified person under NI 43-101. Mr.
Gill is the Company's General Manager at Puna. Mr. Rathnam is the Company's Resource Manager, Corporate.
SSR Mining Inc. | MD&A Q4 2020 | 59 |
| 16. | CAUTIONARY NOTES REGARDING FORWARD-LOOKING STATEMENTS AND MINERAL RESERVES AND MINERAL
RESOURCES ESTIMATES (continued) |
Cautionary Note Regarding
Mineral Reserves and Mineral Resources Estimates
This MD&A includes Mineral Reserves
and Mineral Resources classification terms that comply with reporting standards in Canada and the Mineral Reserves and the Mineral
Resources estimates are made in accordance with NI 43-101. NI 43-101 is a rule developed by the Canadian Securities Administrators
that establishes standards for all public disclosure an issuer makes of scientific and technical information concerning mineral
projects. These standards differ significantly from the requirements of the SEC set out in SEC's rules that are applicable to domestic
United States reporting companies. Consequently, Mineral Reserves and Mineral Resources information included in this news release
is not comparable to similar information that would generally be disclosed by domestic U.S. reporting companies subject to the
reporting and disclosure requirements of the SEC. Accordingly, information concerning mineral deposits set forth herein may not
be comparable with information made public by companies that report in accordance with U.S. standards.
SSR Mining Inc. | MD&A Q4 2020 | 60 |
Exhibit 99.3
CONSENT OF INDEPENDENT REGISTERED PUBLIC ACCOUNTING
FIRM
We hereby consent to the incorporation by reference in the Registration
Statements on Form S-8
(File No. 333-219848), S-8 (File No. 333-185498), S-8 (File No. 333-196116), S-8 (File No.333-198092) and S-8 (File No.333-248813)
of SSR Mining Inc. of our report dated February 17, 2021 relating to the consolidated financial statements and the effectiveness
of internal control over financial reporting, which appears in Exhibit 99.3 to SSR Mining Inc.’s Current Report on Form 6-K
filed on February 17, 2021.
/s/ PricewaterhouseCoopers LLP
Chartered Professional Accountants
Vancouver, Canada
February 17, 2021
Exhibit 99.4
| |
|
News Release |
February 17, 2021
SSR MINING REPORTS FOURTH QUARTER AND
YEAR-END 2020 RESULTS
FOURTH QUARTER FREE CASH FLOW OF $157
MILLION AND
ADJUSTED ATTRIBUTABLE EPS OF $0.50
PER SHARE
DENVER, CO - SSR Mining Inc. (NASDAQ/TSX:
SSRM, ASX:SSR) (“SSR Mining” or "the Company”) reports consolidated financial results for the fourth quarter and
year ended December 31, 2020.
Rod Antal, President and CEO said, "We
exited 2020 with strong operational and financial momentum across all four of our operating assets. The fourth quarter represented
the first full quarter following the completion of the Alacer merger, and the results demonstrated the strength of the business
with 220,000 gold-equivalent ounces produced at $976 per ounce AISC and $157 million in free cash flow. Given our strong balance
sheet we declared our first quarterly dividend in line with our recently instituted capital allocation policy. Our peer leading
free cash flow will also provide us the opportunity to assess additional capital returns to shareholders in the form of supplemental
dividends and/or share buy-back programs in the future.
In 2021, we remain focused on execution
and delivery with the goal of demonstrating our organic ability to sustain 700,000 to 800,000 gold-equivalent ounces of production
for the next 5+ years. Our large brownfield growth and exploration pipeline will take center-stage this year as we advance projects
and provide clarity on their potential scale and timelines."
Fourth Quarter and Year-End
2020 Highlights:
(All figures are in U.S. dollars unless
otherwise noted)
| • | Closed
zero-premium merger with Alacer:
On September 16, 2020,
completed the transaction with Alacer to create a leading intermediate precious metals
producer with robust margins, strong free cash flow generation and long mine lives led
by a highly experienced leadership team with a track record of value creation. |
| • | Robust free cash flow:
Reported fourth quarter attributable net income of $89.0 million, or $0.41
per share, and adjusted attributable net income of $108.8 million, or $0.50 per share. Generated cash flows from operating
activities of $217.4 million and free cash flow of $157.0 million in the fourth quarter.(1) |
| • | Record fourth quarter
performance: Delivered fourth quarter production of 220,432
gold equivalent ounces at AISC of $976 per gold equivalent ounce, exiting the year with strong operational momentum.(1) |
| • | Enhanced
balance sheet and liquidity: Cash and cash
equivalents and consolidated cash balances at year-end increased to $860.6 million and $897.0 million, respectively, further strengthening
the Company's peer-leading balance sheet.(1) Cash and cash equivalents increased by $127.1 million during the fourth
quarter. |
| • | Inaugural
dividend announced: The Board declared the
first quarterly cash dividend of $0.05 per share. |
| • | Delivered
positive Çöpler District Master Plan studies: Released
an updated NI 43-101 technical report outlining two production scenarios which demonstrate the long-term value and the significant
organic growth potential of this world-class operation. |
| • | Discovered
C2 copper-gold porphyry target at Çöpler: Announced
positive results from four diamond drill holes below the Çöpler pit, with all holes
intersecting gold-rich copper porphyry mineralization. The C2 results are another example of the long-term potential of Çöpler. |
| • | Çöpler
contributes low-cost production: Delivered
gold production of 83,029 ounces in the fourth quarter and annual production of 326,908 ounces.(2) Reported AISC of
$748 per ounce in the fourth quarter, generating robust margins.(1) |
| • | Record production at
Marigold: Delivered gold production of 76,941 ounces for the
fourth quarter and annual production of 234,443 ounces, marking both quarterly and annual production records for the operation. |
| • | Marigold recognized
for operator safety: The Marigold team was awarded first place
by the Nevada Mining Association for operator safety for large metal operator in 2020. |
| • | Steady-state production
at Seabee: Produced 31,915 ounces of gold at AISC of $787 per
ounce in the fourth quarter as the mine returned to steady-state operations.(1) |
| • | Strong performance at
Puna: Produced 2.2 million ounces of silver at cash costs of
$8.92 per ounce in the fourth quarter.(1) AISC of $15.90 per ounce was impacted by sales well below production due to
lags as concentrate shipments resumed.(1) |
| • | Provided robust 2021
outlook: In 2021, the Company expects to produce, on a consolidated
basis, 720,000 to 800,000 gold-equivalent ounces at consolidated AISC of $1,050 to $1,110 per gold equivalent ounce.(1) |
| (1) | SSR Mining reports the non-GAAP financial measures of all-in sustaining costs ("AISC")
per ounce of gold, silver and gold equivalent sold, adjusted attributable net income, adjusted attributable net income per share,
free cash flow and consolidated cash to manage and evaluate the Company's operating performance. See “Non-GAAP Financial
Measures” in Section 13. |
| (2) | Includes full year 2020 production from Çöpler. SSR Mining is not entitled to the economic
benefits from Çöpler prior to acquisition. |
Çöpler,
Turkey
(amounts presented on 100%
basis)
| |
Three months ended December 31 |
Period from acquisition to December 31, 2020 |
Year ended December 31 |
| Operating Data |
2020 |
2020 (1) |
2020 (2) |
| Gold produced - oxide (oz) |
21,200 |
|
26,458 |
|
87,548 |
|
| Gold produced - sulfide (oz) |
61,830 |
|
76,158 |
|
239,360 |
|
| Total gold produced (oz) |
83,029 |
|
102,616 |
|
326,908 |
|
| Gold sold (oz) |
80,388 |
|
108,283 |
|
321,272 |
|
| |
|
|
|
| Ore mined - oxide (kt) |
1,354 |
|
1,501 |
|
2,823 |
|
| Ore mined - sulfide (kt) |
935 |
|
1,034 |
|
2,255 |
|
| Total material mined (kt) |
7,045 |
|
8,108 |
|
25,861 |
|
| Waste removed (kt) |
4,756 |
|
5,573 |
|
20,783 |
|
| Strip ratio |
2.1 |
|
2.2 |
|
4.1 |
|
| |
|
|
|
| Ore stacked - oxide (kt) |
1,292 |
|
1,413 |
|
2,841 |
|
| Gold grade stacked - oxide (g/t) |
1.20 |
|
1.20 |
|
1.13 |
|
| |
|
|
|
| Ore processed - sulfide (kt) |
584 |
|
669 |
|
2,158 |
|
| Gold grade processed - sulfide (g/t) |
3.61 |
|
3.62 |
|
3.74 |
|
| Gold recovery - sulfide (%) |
90.3 |
|
90.1 |
|
90.7 |
|
| |
|
|
|
| Average realized gold price ($/oz sold) |
$ |
1,876 |
|
$ |
1,887 |
$ |
1,763 |
| |
|
|
|
| Cash costs ($/oz gold sold) (3, 4) |
$ |
619 |
|
$ |
614 |
$ |
625 |
| AISC ($/oz gold sold) (3, 4) |
$ |
748 |
|
$ |
743 |
$ |
752 |
| |
|
|
|
| Financial Data ($000s) |
|
|
|
| Revenue |
$ |
151,970 |
|
$ |
205,536 |
|
N/A |
| Production costs |
$ |
79,948 |
|
$ |
120,618 |
|
N/A |
| Depletion and depreciation |
$ |
25,158 |
|
$ |
34,053 |
|
N/A |
| Income from mine operations |
$ |
46,864 |
|
$ |
50,865 |
|
N/A |
| Exploration and evaluation expenses |
$ |
2,605 |
|
$ |
3,558 |
|
N/A |
| Capital expenditures |
$ |
18,463 |
|
$ |
22,883 |
|
N/A |
| (1) | The data presented in this column is for the period from September 16, 2020 to December 31, 2020,
the period for which the Company was entitled to all economic benefits of Çöpler following the Company's acquisition
of Alacer. |
| (2) | The operating data presented in this column includes operating results for Çöpler for
the entire year ended December 31, 2020, including the period prior to the Company's acquisition of Alacer on September 16, 2020.
As the Company was not entitled to the economic benefits of Çöpler prior to the acquisition, financial data for the
periods prior to September 16, 2020 are not provided. |
| (3) | The Company reports the non-GAAP financial measures of cash costs and AISC per ounce of gold sold
to manage and evaluate operating performance at Çöpler. For further information, please refer to Non-GAAP Financial
Measures” in Section 13. |
| (4) | Cash costs and AISC per ounce of gold sold exclude the impact of any fair value adjustment on acquired
inventories as at the date of the Company's acquisition of Alacer. |
During the fourth quarter of 2020, Çöpler
produced 83,029 ounces of gold, which included 21,200 ounces of gold production from the Çöpler oxide plant and 61,830
ounces of gold production from the sulfide plant. Production was in line with guidance despite the impacts of COVID-19. The mine
plan was revised and other actions taken to mitigate the impacts of COVID-19.
From September 16, 2020, the date of the
Company's acquisition of Alacer, to December 31, 2020, Çöpler produced 102,616 ounces of gold, which included 26,458
ounces of gold production from the Çöpler oxide plant and 76,158 ounces of gold production from the sulfide plant.
For the year ended December 31, 2020, Çöpler
produced 326,908 ounces of gold, which included 87,548 ounces of gold production from the Çöpler oxide plant and 239,360
ounces of gold production from the sulfide plant. Production was in line with the revised mine plan that was adopted to diversify
ore sources and optimize production in light of the shortfall in mine operator numbers resulting from COVID-19.
For the three months and year ended December
31, 2020, oxide ore tonnes mined were 1.4 million and 2.8 million tonnes, respectively. The oxide ore mined grade was 1.16 g/t
and 1.06 g/t, respectively.
For the three months and year ended December
31, 2020, sulfide ore tonnes mined were 0.9 million and 2.3 million tonnes, respectively, in line with the revised mine plan.
For the three months and year ending December
31, 2020, the sulfide plant treated 0.6 million and 2.2 million tonnes of sulfide ore, respectively. The sulfide plant continued
to efficiently operate above design throughput. Plant gold recovery averaged approximately 91% for the year ended December 31,
2020. Recovery improvement projects continued in the fourth quarter of 2020, some of which continue into 2021.
Mine operator availability suffered in
2020 due to COVID-19 restrictions. The revised mine plan reduced the haulage of material to the tailings storage facility ("TSF"),
stockpiling this material for 2021, and allowed for available mining resources to be focused on the Manganese pit cutback. The
TSF is approximately 5 kilometers from the mine and is constructed from competent mine waste. Despite the reduced construction
rate in 2020 as a result of the impacts from COVID-19, the TSF is advancing ahead of operational requirements. A mining area was
also brought into production in the Main Pit to diversify ore sources, in part, as a risk management strategy should COVID-19 related
restrictions increase. Total mined tonnes for the fourth quarter and full year 2020, with the revised mine plan, were above the
original mine plan.
For the three months and year ended December
31, 2020, the total waste tonnes mined were 4.8 million and 20.8 million tonnes, respectively, in line with the revised mine plan.
The Çöpler District Master
Plan 2020 ("CDMP2020"), issued in November 2020, updated the operating parameters of the sulfide plant and includes the
results of optimization studies and programs, including the supplemental flotation circuit.
The
flotation circuit included in the recent amendment to the Çöpler Environmental Impact Assessment application and incorporated
into the CDMP2020 was approved for construction by the Board of Directors. The flotation circuit will treat a side stream from
the grinding circuit, with the concentrate reporting to autoclave feed and the tails to leaching. The flotation circuit is anticipated
to increase the gold and sulfur grades processed through the autoclaves (increasing autoclave and oxygen utilization), reduce unit
costs, and increase total sulfide plant throughput and gold production. Overall recovery declines modestly due to lower float tails
recovery. The currently-installed grinding mills have demonstrated significant latent capacity, sufficient to support an increase
in sulfide plant throughput capacity up to approximately 3 million tonnes per annum. The capital cost estimate for the flotation
circuit is approximately $18 million. At December 31, 2020, the detailed engineering designs for the flotation circuit were 89%
complete and the civil construction was 95% complete. The fabrication of the steel work is in progress, with tank delivery at 75%
and assembly at 55% completion. The flotation circuit commissioning is targeted for mid-year 2021.
Revenue
Revenue
for the fourth quarter of 2020 was $152.0 million as 80,388 ounces
of gold were sold at an average realized gold price of $1,876 per ounce.
Revenue
for the period from September 16, 2020, the date of the Company's acquisition of Alacer, to December 31, 2020, was $205.5
million as 108,283 ounces of gold were sold
at an average realized gold price of $1,887 per ounce.
Gold
ounces sold in the fourth quarter of 2020 were lower than production due to the timing of gold pours at year end. Gold ounces sold
from the date of acquisition to December 31, 2020 were higher than production due to the sale of finished goods inventory acquired
on the acquisition date.
Operating Costs
Cash
costs and AISC per ounce of gold sold are non-GAAP financial measures. Please see the discussion under "Non-GAAP Financial
Measures" in Section 13.
Unit
operating costs remained stable as a weaker local currency offset by the impacts associated with COVID-19. The impact of fair value
adjustments on acquired inventories and mineral interests are reflected in production costs and depletion and depreciation, respectively.
These impacts have been removed in the calculation of cash costs and AISC per ounce of gold sold (refer to Section 13).
In the fourth quarter
of 2020, cash costs per ounce of gold sold were $619. Royalty expense included in cash costs increased due to a combination of
higher rate and higher gold prices.
In
the fourth quarter of 2020, AISC per ounce of gold sold was $748, which was also affected by increased royalty expense.
Marigold, USA
| |
Three months ended December 31, |
Year ended December 31, |
| |
|
|
| Operating Data |
2020 |
2019 |
Change |
2020 |
2019 |
Change |
| Gold produced (oz) |
76,941 |
|
59,186 |
|
30 |
% |
234,443 |
|
220,227 |
|
6 |
% |
| Gold sold (oz) |
73,927 |
|
61,088 |
|
21 |
% |
230,043 |
|
226,957 |
|
1 |
% |
| |
|
|
|
|
|
|
| Total material mined (kt) |
22,699 |
|
18,457 |
|
23 |
% |
85,594 |
|
74,039 |
|
16 |
% |
| Waste removed (kt) |
15,946 |
|
11,736 |
|
36 |
% |
62,038 |
|
48,364 |
|
28 |
% |
| Total ore stacked (kt) |
6,753 |
|
6,721 |
|
- |
% |
23,556 |
|
25,676 |
|
(8) |
% |
| Gold stacked grade (g/t) |
0.48 |
|
0.36 |
|
33 |
% |
0.39 |
|
0.40 |
|
(3) |
% |
| Strip ratio |
2.4 |
|
1.7 |
|
41 |
% |
2.6 |
|
1.9 |
|
37 |
% |
| |
|
|
|
|
|
|
| Average realized gold price ($/oz sold) |
$ |
1,885 |
|
$ |
1,478 |
|
28 |
% |
$ |
1,783 |
|
$ |
1,391 |
|
28 |
% |
| |
|
|
|
|
|
|
| Cash costs ($/oz gold sold) (1) |
$ |
838 |
|
$ |
778 |
|
8 |
% |
$ |
852 |
|
$ |
811 |
|
5 |
% |
| AISC ($/oz gold sold) (1) |
$ |
1,070 |
|
$ |
1,117 |
|
(4) |
% |
$ |
1,222 |
|
$ |
1,034 |
|
18 |
% |
| |
|
|
|
|
|
|
| Financial Data ($000s) |
|
|
|
|
|
|
| Revenue |
$ |
139,183 |
|
$ |
90,198 |
|
54 |
% |
$ |
409,798 |
|
$ |
315,320 |
|
30 |
% |
| Production costs |
$ |
62,228 |
|
$ |
47,472 |
|
31 |
% |
$ |
196,409 |
|
$ |
183,782 |
|
7 |
% |
| Depletion and depreciation |
$ |
15,752 |
|
$ |
12,463 |
|
26 |
% |
$ |
47,844 |
|
$ |
52,291 |
|
(9) |
% |
| Income from mine operations |
$ |
61,203 |
|
$ |
30,263 |
|
102 |
% |
$ |
165,545 |
|
$ |
79,247 |
|
109 |
% |
| Exploration and evaluation expenses |
$ |
427 |
|
$ |
319 |
|
34 |
% |
$ |
2,462 |
|
$ |
936 |
|
163 |
% |
| Capital expenditures |
$ |
15,833 |
|
$ |
20,754 |
|
(24) |
% |
$ |
80,161 |
|
$ |
53,702 |
|
49 |
% |
| (1) | The Company reports the non-GAAP financial measures of cash costs and AISC per ounce of gold sold
to manage and evaluate operating performance at Marigold. For further information, please refer to “Non-GAAP Financial Measures”
in Section 13. |
Production
In the fourth quarter of 2020, 22.7 million
tonnes of material were mined, a 23% increase compared to the fourth quarter of 2019. For the year ended December 31, 2020, 85.6
million tonnes of material were mined, a 16% increase over the year ended December 31, 2019. These increases are attributable to
shorter haulage cycles coupled with increased fleet capacities in load, haul and drilling.
During the fourth quarter of 2020, 6.8
million tonnes of ore was stacked at a gold grade of 0.48 g/t. This compares to 6.7 million tonnes of ore stacked at a gold grade
of 0.36 g/t in the fourth quarter of 2019. The higher grades delivered in the fourth quarter of 2020 as compared to the fourth
quarter 2019 are associated with the planned mining of the higher-grade portions of Mackay 4 and Mackay 8. In the fourth quarter
of 2019, mining activities focused on the lower grade portions of Mackay 5 and stripping of Mackay 4.
For the year ended December 31, 2020, 23.6
million tonnes of ore was stacked at a gold grade of 0.39 g/t compared to 25.7 million tonnes of ore stacked at a gold grade of
0.40 g/t for the year ended December 31, 2019. The reduction in both ore tonnes stacked and gold grade are associated with the
transition from mining higher grade Mackay 5 ore in 2019 to the stripping and mining of Mackay Phases 4 and 8 in 2020.
During the fourth quarter of 2020, Marigold
produced a quarterly record 76,941 ounces of gold, an increase of 30% compared to the fourth quarter of 2019 and 15% higher than
the previous quarterly record. Production benefited from higher grades stacked at lower lifts on the heap leach pads. A decrease
in electrowinning cell inventory also contributed to ounces produced in the fourth quarter of 2020.
Annual production in 2020 of 234,443 ounces
was a record for the mine's 32-year history. This was 6% higher than the 220,227 ounces of gold for the year ended December 31,
2019. The increase was due to low stacking elevations throughout 2020 which contributed to faster leach times and a decrease in
electrowinning cell inventory during 2020.
Revenue
Revenue increased by 54% to $139.2 million
in the fourth quarter of 2020 compared to the fourth quarter of 2019, due to a 28% increase in the average realized gold price
and 21% more ounces sold.
Revenue increased by 30% for the year ended
December 31, 2020 compared to the year ended December 31, 2019, due to an increase of 28% in the average realized gold price.
Gold ounces sold in the fourth quarter
and for the year ended December 31, 2020 were lower than production due to the timing of gold pours at year end.
Operating Costs
Cash
costs and AISC per ounce of gold sold are non-GAAP financial measures. Please see the discussion under "Non-GAAP Financial
Measures" in Section 13.
Cash costs per ounce of gold sold for the
fourth quarter of 2020 was $838, an 8% increase compared to the fourth quarter of 2019, primarily due to an increase in per unit
royalty costs due to higher realized gold prices. Cash costs per ounce of gold sold for the full year 2020 were $852, a 5%
increase compared to the full year 2019 for the same reason.
In the fourth quarter of 2020, AISC per
ounce of gold sold was $1,070, a 4% decrease compared to the fourth quarter of 2019, due to lower capital expenditures per gold
ounce sold partially offset by higher cash costs. Capital spend was lower in the fourth quarter of 2020 primarily due to the purchase
of a hydraulic shovel in the fourth quarter of 2019 with no comparable purchase in 2020.
AISC per ounce of gold sold for the year
ended December 31, 2020 was $1,222, an 18% increase compared to the year ended December 31, 2019 due to higher cash costs and
an increase in capital expenditures per gold ounce sold. Capital expenditures were higher than the year ended December 31, 2019,
due to mobile mine equipment replacements, increased leach pad construction, dewatering construction costs and higher deferred
stripping.
Seabee, Canada
| |
Three months ended December 31, |
Year ended December 31, |
| Operating Data |
2020 |
2019 |
Change |
2020 |
2019 |
Change |
| Gold produced (oz) |
31,915 |
|
22,069 |
|
45 |
% |
81,686 |
|
112,137 |
|
(27) |
% |
| Gold sold (oz) |
28,013 |
|
24,362 |
|
15 |
% |
75,837 |
|
104,915 |
|
(28) |
% |
| |
|
|
|
|
|
|
| Total ore milled (t) |
99,487 |
|
87,394 |
|
14 |
% |
255,178 |
|
344,039 |
|
(26) |
% |
| Ore milled per day (t/day) |
1,081 |
|
950 |
|
14 |
% |
697 |
|
943 |
|
(26) |
% |
| Gold mill feed grade (g/t) |
9.85 |
|
7.89 |
|
25 |
% |
10.10 |
|
9.56 |
|
6 |
% |
| Gold recovery (%) |
98.4 |
|
97.9 |
|
1 |
% |
98.4 |
|
98.2 |
|
- |
% |
| |
|
|
|
|
|
|
| Average realized gold price ($/oz sold) |
$ |
1,877 |
|
$ |
1,484 |
|
26 |
% |
$ |
1,790 |
|
$ |
1,398 |
|
28 |
% |
| |
|
|
|
|
|
|
| Cash costs ($/oz sold) (1) |
$ |
531 |
|
$ |
505 |
|
5 |
% |
$ |
534 |
|
$ |
464 |
|
15 |
% |
| AISC ($/oz sold) (1) |
$ |
787 |
|
$ |
751 |
|
5 |
% |
$ |
939 |
|
$ |
812 |
|
16 |
% |
| |
|
|
|
|
|
|
| Financial Data ($000s) |
|
|
|
|
|
|
| Revenue |
$ |
52,498 |
|
$ |
36,142 |
|
45 |
% |
$ |
135,230 |
|
$ |
146,141 |
|
(7) |
% |
| Production costs |
$ |
15,583 |
|
$ |
12,283 |
|
27 |
% |
$ |
41,308 |
|
$ |
48,470 |
|
(15) |
% |
| Depletion and depreciation |
$ |
11,148 |
|
$ |
10,124 |
|
10 |
% |
$ |
28,233 |
|
$ |
36,368 |
|
(22) |
% |
| Income from mine operations |
$ |
25,767 |
|
$ |
13,735 |
|
88 |
% |
$ |
65,689 |
|
$ |
61,303 |
|
7 |
% |
| Exploration and evaluation expenses |
$ |
2,088 |
|
$ |
1,210 |
|
73 |
% |
$ |
6,108 |
|
$ |
8,770 |
|
(30) |
% |
| Capital expenditures |
$ |
8,201 |
|
$ |
5,946 |
|
38 |
% |
$ |
33,758 |
|
$ |
33,559 |
|
1 |
% |
| (1) | The Company reports the non-GAAP financial measures of cash
costs and AISC per ounce of gold sold to manage and evaluate operating performance at Seabee. For further information, please refer
to “Non-GAAP Financial Measures” in Section 13. |
Production
In
response to the COVID-19 pandemic, Seabee was voluntarily placed into temporary care and maintenance on March 25, 2020 as a precautionary
measure to protect the Company's employees, their families and communities. Through this period, employees maintained the mine
in a state of operational readiness.
In
June 2020, a phased restart of the operation commenced. The first phase focused on underground ventilation raises and capital development
within the mine while COVID-19-related protocols were assessed. Limited ore extraction was initiated at the end of June. In early
July, Seabee commenced the second phase, which involved increasing underground development rates and mine production while continuing
to monitor COVID-19 related protocols. In August, the third and final phase commenced, which involved a restart of milling operations
and ramp-up to full mine production with a complete workforce, while continuing to maintain effective COVID-19-related protocols.
The mine has operated at full capacity since completion of the final phase in August.
During
the fourth quarter of 2020, Seabee produced 31,915 ounces of gold, a 45% increase compared to the fourth quarter of 2019, due to
increases in tonnes and grade mined and milling of stockpiled ore. Mill feed grade was 9.85 g/t gold during the fourth quarter
of 2020, a 25% increase compared to the fourth quarter of 2019, due to the scheduled sequencing of the mine.
For
the year ended December 31, 2020, Seabee produced 81,686 ounces of gold, a 27% decrease compared to the year ended December 31,
2019, reflecting that the mill was shut down from March through August 2020, whereas the mill was fully operational in 2019.
Revenue
Revenue
increased by 45% in the fourth quarter of 2020 compared to the fourth quarter of 2019 due to a 15% increase in gold ounces sold
and a 26% increase in the average realized gold price.
Revenue
decreased by 7% for the year ended December 31, 2020 compared to the year ended December 31, 2019, due to a 28% decrease in gold
ounces sold, partially offset by a 28% increase in the average realized gold price. The decrease in gold ounces sold is due to
the temporary suspension of operations as a result of COVID-19.
Gold
ounces sold in the fourth quarter and for the year ended December 31, 2020 were lower than production due to the timing of shipments
of gold on carbon fines and the timing of gold pours at year end.
Operating
Costs
Cash
costs and AISC per ounce of gold sold are non-GAAP financial measures. Please see the discussion under "Non-GAAP Financial
Measures" in Section 13.
In
the fourth quarter of 2020, cash costs per ounce of gold sold were $531, a 5% increase compared to the fourth quarter of 2019,
due to higher general and administrative costs associated with the ramp up to full production.
In
the fourth quarter of 2020, AISC per ounce of gold sold was $787, a 5% increase compared to the fourth quarter of 2019, due to
higher cash costs. Capital expenditures in the fourth quarter of 2020 related mainly to the tailings expansion project. Full construction
activities at the tailings expansion project resumed in early August 2020.
For
the year ended December 31, 2020, cash costs per ounce of gold sold were $534, a 15% increase compared to the year ended December
31, 2019, due to higher unit mining and general and administrative costs, driven by the temporary suspension of operations for
all of the second quarter and beginning of the third quarter.
For
the year ended December 31, 2020, AISC per ounce of gold sold was $939, a 16% increase compared to the year ended December 31,
2019, due to higher cash costs.
Puna, Argentina
(amounts presented
on 100% basis)
| |
Three months ended December 31, |
Year ended December 31, |
| Operating Data |
2020 |
2019 |
Change |
2020 |
2019 |
Change |
| Silver produced ('000 oz) |
2,165 |
|
2,132 |
|
2 |
% |
5,581 |
|
7,674 |
|
(27) |
% |
| Silver sold ('000 oz) |
1,010 |
|
2,584 |
|
(61) |
% |
4,661 |
|
7,695 |
|
(39) |
% |
| Lead produced ('000 lb) (1) |
6,529 |
|
7,985 |
|
(18) |
% |
17,193 |
|
23,957 |
|
(28) |
% |
| Lead sold ('000 lb) (1) |
3,158 |
|
9,371 |
|
(66) |
% |
14,903 |
|
24,119 |
|
(38) |
% |
| Zinc produced ('000 lb) (1) |
2,932 |
|
3,007 |
|
(2) |
% |
6,988 |
|
8,392 |
|
(17) |
% |
| Zinc sold ('000 lb) (1) |
1,898 |
|
3,067 |
|
(38) |
% |
6,039 |
|
14,072 |
|
(57) |
% |
| |
|
|
|
|
|
|
| Total material mined (kt) |
2,750 |
|
3,244 |
|
(15) |
% |
5,696 |
|
12,282 |
|
(54) |
% |
| Waste removed (kt) |
2,440 |
|
2,725 |
|
(10) |
% |
4,879 |
|
10,839 |
|
(55) |
% |
| Strip ratio |
7.9 |
|
5.3 |
|
49 |
% |
6.0 |
|
7.5 |
|
(20) |
% |
| |
|
|
|
|
|
|
| Ore milled (kt) |
416 |
|
400 |
|
4 |
% |
1,118 |
|
1,394 |
|
(20) |
% |
| Silver mill feed grade (g/t) |
170 |
|
174 |
|
(2) |
% |
164 |
|
184 |
|
(11) |
% |
| Lead mill feed grade (%) |
0.78 |
|
0.99 |
|
(21) |
% |
0.77 |
|
0.89 |
|
(13) |
% |
| Zinc mill feed grade (%) |
0.52 |
|
0.63 |
|
(17) |
% |
0.51 |
|
0.54 |
|
(6) |
% |
| Silver recovery (%) |
95.2 |
|
95.1 |
|
- |
% |
94.6 |
|
93.2 |
|
2 |
% |
| Lead recovery (%) |
90.8 |
|
91.9 |
|
(1) |
% |
90.2 |
|
85.8 |
|
5 |
% |
| Zinc recovery (%) |
61.4 |
|
54.3 |
|
13 |
% |
55.5 |
|
49.2 |
|
13 |
% |
| |
|
|
|
|
|
|
| Average realized silver price ($/oz) |
$ |
24.78 |
|
$ |
17.32 |
|
43 |
% |
$ |
21.23 |
|
$ |
16.26 |
|
31 |
% |
| |
|
|
|
|
|
|
| Cash costs ($/oz silver sold) (2) |
$ |
8.92 |
|
$ |
8.90 |
|
- |
% |
$ |
11.43 |
|
$ |
10.38 |
|
10 |
% |
| AISC ($/oz silver sold) (2) |
$ |
15.90 |
|
$ |
11.18 |
|
42 |
% |
$ |
15.22 |
|
$ |
14.06 |
|
8 |
% |
| |
|
|
|
|
|
|
| Financial Data ($000s) |
|
|
|
|
|
|
| Revenue |
$ |
27,078 |
|
$ |
51,263 |
|
(47) |
% |
$ |
102,525 |
|
$ |
145,389 |
|
(29) |
% |
| Production costs |
$ |
11,822 |
|
$ |
29,424 |
|
(60) |
% |
$ |
60,317 |
|
$ |
97,558 |
|
(38) |
% |
| Depreciation and depletion |
$ |
2,634 |
|
$ |
6,924 |
|
(62) |
% |
$ |
15,665 |
|
$ |
17,498 |
|
(10) |
% |
| Income from mine operations |
$ |
12,622 |
|
$ |
14,915 |
|
(15) |
% |
$ |
26,543 |
|
$ |
30,333 |
|
(12) |
% |
| Exploration, evaluation and reclamation expense |
$ |
(2,337) |
|
$ |
492 |
|
(575) |
% |
$ |
(2,144) |
|
$ |
786 |
|
(373) |
% |
| Capital expenditures |
$ |
6,480 |
|
$ |
5,557 |
|
17 |
% |
$ |
17,690 |
|
$ |
33,819 |
|
(48) |
% |
| (1) | Data for lead production and sales relate only to lead in lead concentrate. Data for zinc production
and sales relate only to zinc in zinc concentrate. |
| (2) | The Company reports the non-GAAP financial measures of cash costs and AISC per ounce of silver
sold to manage and evaluate operating performance at Puna. For further information, please refer to “Non-GAAP Financial Measures”
in Section 13. |
Production
On
March 20, 2020, Puna temporarily suspended operations as a result of government-mandated restrictions due to the COVID-19 pandemic.
Subsequently, the Government of Argentina reinstated mining as an essential business activity. During the second quarter of 2020,
a phased restart complying with government regulations and guidelines was implemented with the recommencement of mining, hauling
and milling operations. During the third quarter of 2020, COVID-19 infection rates in the Province of Jujuy escalated, resulting
in further interruptions to operations. In September, operations were suspended in order to manage camp occupancy, conduct testing
and reduce the risk of transmission. Due to the significant ore stockpiles at Puna, milling operations were prioritized over mining
operations through restarts. As a result, tonnes mined in the third quarter of 2020 were impacted due to COVID-19 related interruptions.
Mining and milling activities were operating at expected levels by the beginning of October 2020.
During
the fourth quarter of 2020, Puna produced 2.2 million ounces of silver, a 2%
increase compared to the fourth quarter of 2019, due to higher tonnage milled at modestly
lower grades. Lead and zinc production decreased 18% and 2% respectively, due to lower base metal head grades with zinc benefiting
from a significant increase in recovery due to achieving finer ore grind. Ore milled was
0.4 million tonnes, a 4% increase compared to the fourth quarter of 2019 due
to an increase in throughput and shorter shutdowns for scheduled maintenance. Processed ore
contained an average silver grade of 170 g/t, a 2% decrease compared to the fourth
quarter of 2019, which was in-line with the mine plan. The mill averaged approximately
4,517 tonnes per day during the fourth quarter of 2020, demonstrating an improved performance on plant throughput and tailings
pumping system capacity achieved through continuous improvements.
For
the year ended December 31, 2020, Puna produced 5.6 million ounces of silver, a 27% decrease compared to the year ended December
31, 2019, due to the temporary suspension of operations in response to COVID-19 during the second and third quarters of 2020. Lead
and zinc production was similarly affected by the COVID-19 related shutdowns. Ore milled was 1.1 million tonnes, a 20% decrease
compared to the year ended December 31, 2019, also as a result of COVID-19 related shutdowns. Processed ore contained an average
silver grade of 164 g/t, an 11% decrease compared to the year ended December 31, 2019, but in-line with the mine plan.
Revenue
Revenue decreased by 47% in the fourth
quarter of 2020 compared to the fourth quarter of 2019, due to a 61% decrease in silver ounces sold, partially offset by a 43%
increase in the average realized silver price. Sales in the fourth quarter and for the year ended December 31, 2020 were significantly
below production due to the normal transport and refining cycles associated with ramp-up after the COVID-19 related shutdowns.
Revenue decreased by 29% for the year ended
December 31, 2020 compared to the year ended December 31, 2019, due to a 39% decrease in silver ounces sold as a result of the
COVID-19 operational shutdowns, partially offset by a 31% increase in the average realized silver price.
Operating Costs
Cash costs and AISC per ounce
of silver sold are non-GAAP financial measures. Please see the discussion under "Non-GAAP Financial Measures" in Section
13.
In the fourth quarter of 2020, cash costs
per ounce of silver sold were $8.92, consistent with the fourth quarter of 2019.
In the fourth quarter of 2020, AISC per
ounce of silver sold was $15.90, an increase of 42% compared to the fourth quarter of 2019. The increase in AISC was primarily
due to higher capital expenditures per silver ounce sold, driven by silver ounces sold well below production due to normal ramp-up
times for shipping and selling concentrates.
For the year ended December 31, 2020, cash
costs per ounce of silver sold were $11.43, an increase of 10% compared to the year ended December 31, 2019, primarily due to higher
mining unit costs, offset by lower processing and general and administrative unit costs as a result of higher average daily plant
throughput and the positive impact of the renegotiation of the natural gas contract. Mining costs were higher due to operating
inefficiencies through shutdown and start-up phases and an increase in maintenance work performed during the temporary suspensions.
For the year ended December 31, 2020, AISC
per ounce of silver sold was $15.22, an increase of 8% compared to the year ended December 31, 2019, due to higher cash costs per
ounce sold, offset partially by lower sustaining capital expenditures, mainly due to lower deferred stripping costs and the deferral
of capital projects due to impacts of COVID-19.
Exploration
and Development
The
Company holds a portfolio of prospective exploration tenures across Turkey, the USA, Canada, Mexico and Peru both near or adjacent
to the existing operations (near-mine) and greenfield standalone prospects. The Company continues exploring both near-mine and
greenfield prospects with a focus on the near-mine targets. Near-mine expansion projects can leverage existing mine infrastructure
and capability to generate lower cost, faster development opportunities.
Çöpler
District Exploration
The
Company takes a disciplined approach to exploration at the Çöpler District, optimizing the historical exploration database,
remapping and reinterpreting data, and judiciously drill testing new targets.
A
primary focus in the Çöpler District is to fast-track exploration of oxide ore to take advantage of spare oxide plant
capacity.
The
Çöpler Saddle prospect and the Ardich and Çakmaktepe deposits represent the priorities as near-mine development
projects with potential to add to the Company’s production profile within the next two to three years.
Çöpler (80%
owned)
The
operating mine is the center for district exploration activities, with established infrastructure for treating both oxide and sulfide
gold ores.
Commencing
in 2017, a Çöpler in-pit exploration program successfully provided additional oxide ore to the processing facilities.
The in-pit exploration program is ongoing, targeting both oxide and sulfide ore. Recently, the in-pit exploration program identified
the possibility of a copper-gold porphyry system below the Main pit. Designated C2, drill testing of the target commenced at the
end of the second quarter of 2020 and continued through the third quarter. Initial drill results are encouraging and are described
in detail below.
C2 Porphyry Copper-Gold
(80% owned)
The
C2 target lies directly below the Main pit of the Çöpler mine. In 2020, four diamond drill holes were completed along
a line of approximately 730 meters, with all holes intersecting gold-rich copper porphyry mineralization. Chalcopyrite is visible
in the drill core with mineralization starting at or close to the bottom of the currently defined Çöpler Main pit.
Some
of the newly discovered porphyry intrusive has been exposed in parts of the lower benches. The porphyry has well-developed stockwork
and sheeted sulfide-quartz veins. Where exposed in the pit benches, these veins are locally overprinted by thicker quartz-sericite-sulfide
veins. The copper mineralization is predominantly chalcopyrite formed as disseminations in the matrix and as thin veins associated
with quartz accompanied with rare molybdenite mineralization. There is elevated arsenic in some zones, but this does not seem to
be directly correlated to the copper mineralization. The gold mineralization is not visible.
In
2020, the Company drilled eleven diamond core holes totaling 5,379 meters, with results of the first four holes announced in a
news release dated November 25, 2020.
Significant
results were returned from the initial four holes:
| • | CDD955 returned
0.74% CuEq(1) over 241.5 meters from 37 meters, and 0.42% CuEq(1) over 166.2 meters from 287.5 meters. |
| • | CDD935 returned
0.86% CuEq(1) over 108.6 meters from 103.1 meters. |
| • | CDD940 returned
0.71% CuEq(1) over 81.5 meters from 271.2 meters. |
| • | CDD947 returned
1.14% CuEq(1) over 49.6 meters from 156.9 meters,1.20% CuEq(1) over 18.4 meters from 237.8 meters, and 0.30%
CuEq(1) over 127.7 meters from 303.3 meters. |
| (1) | Copper equivalent calculated as CuEq = [Cu ppm + ((Au ppm*Au
price(g) / Cu price(g)) /10,000)]. Based upon metal prices of $1,750/oz gold and $3.00/pound copper with recovery assumed to be
100% as no metallurgical test work has been completed. CuEq will change proportionally to the metal’s relative recoveries
once metallurgical test work is complete. Intervals reported are sections with more than 0.2%CuEq (and a minimum 0.1%Cu) and less
than of 5 meters contiguous dilution. |
Metallurgical
test work commenced at a contract laboratory in Canada on C2 diamond drill core samples. Preliminary indications from the metallurgical
flotation test work is encouraging. The Company is currently drilling with three diamond drill rigs and plans to increase the number
of rigs to nine in the first quarter of 2021.
Ardich Gold Deposit
(80% owned)
The
Ardich gold deposit is six kilometers northeast of the Çöpler processing facilities and is accessible by the nearby
haul road to Çakmaktepe. The deposit mostly forms a tabular flat-lying gold-rich oxide and sulfide zone at the contact between
an overlying assemblage of ultramafic rocks and underlying clastic and limestone rock types. The deposit is predominantly oxide
mineralization.
A
total of 175 drill holes were included in the maiden Ardich Mineral Resource estimate announced November 22, 2019. Since the cut-off
date for the November 2019 Mineral Resource, data has been obtained for an additional 129 drill holes for a total of 304 drill
holes. Based on the additional drill data, the Company provided an updated Ardich Mineral Resource estimate on November 30, 2020
within the CDMP2020, a summary of which is provided in the table below .
The
CDMP20 includes an alternative PEA case including the development of Ardich.
Drilling
continues at Ardich as the Mineral Resource remains open for expansion. Subsequent to the November 2020 Mineral Resource estimate
published in the Technical Report which included drilling data up to February 2020, a total of 147 additional diamond drill holes
totaling 35,147 meters have been drilled in the Ardich project. Development work including additional technical studies and permitting
also continues.
| Mineral Resource Estimate for the Ardich Deposit (as at the Effective Date) |
| Material Type |
Resource Category Material |
Tonnes (kt) |
Au (g/t) |
Contained Gold (koz) |
| Oxide (LS+HS) |
Measured |
4,707 |
1.63 |
246 |
| Indicated |
12,817 |
1.62 |
666 |
| Measured + Indicated |
17,524 |
1.62 |
912 |
| Inferred |
4,713 |
1.62 |
246 |
| Sulfide |
Measured |
695 |
2.56 |
57 |
| Indicated |
2,231 |
3.71 |
266 |
| Measured + Indicated |
2,926 |
3.43 |
323 |
| Inferred |
782 |
4.24 |
107 |
| Total |
Measured |
5,402 |
1.75 |
303 |
| Indicated |
15,048 |
1.93 |
932 |
| Measured + Indicated |
20,451 |
1.88 |
1,235 |
| Inferred |
5,495 |
1.99 |
352 |
| (1) | Mineral Resources for Adrich have an effective date of 27 November 2020 and have been prepared
in accordance with National Instrument 43-101 - Standards of Disclosure for Mineral Projects (“NI 43-101”). The Mineral
Resources estimate for Ardich has been prepared by Sharron Sylvester, BSc (Geol), RPGeo AIG (10125), employed by OreWin Pty Ltd
as Technical Director - Geology, a qualified person as defined under NI 43-101. All key assumptions, parameters and methods used
to estimate Mineral Resources for Ardich and the data verification procedures followed are set out in the CDMP 2020. |
| (2) | Mineral Resources that are not Mineral Reserves have not demonstrated economic viability. |
| (3) | Due to the uncertainty that may be attached to Inferred Mineral Resources, it cannot be assumed
that all or any part of an Inferred Mineral Resource will be upgraded to an Indicated or Measured Mineral Resource as a result
of continued exploration. |
| (4) | Mineral Resources are shown on a 100% basis. More than 96% of the Mineral Resources are located
on the SSR Mining owned 80% ground, with the remainder of the mineralization within the 50%/50% ownership boundary. |
| (5) | Low-sulfur (LS) oxide is defined as material with <1% total sulfur, high-sulfur (HS) oxide is
material with total sulfur >1% and <2%, and sulfide material has ≥2% total sulfur. |
| (6) | All Mineral Resources in the CDMP 2020 were assessed for reasonable prospects for eventual economic
extraction by reporting only material that fell within conceptual pit shells based on metal prices of $1,750/oz for gold. The following
parameters were used: metallurgical recoveries in oxide 40.0%-73.0%, and in sulfide 82.9%; Au cut-off grades in oxide 0.30-0.55
g/t Au, and in sulfide 0.77 g/t Au, (there are no credits for Ag or Cu in the cut-off grade calculations); allowances have been
made for royalty payable. |
| (7) | Reported Mineral Resources contain no allowances for unplanned dilution, or mining recovery. Tonnage
and grade measurements are in metric units. Contained gold is reported in troy ounces. |
| (8) | Tonnages are rounded to the nearest thousand tonnes; grades are rounded to two decimal places.
As a result, totals may not match. |
Çöpler Saddle
(80% owned)
The
Saddle prospect borders the western flank of Çöpler as a two kilometer long north-south shear zone passing through
West pit.
Çakmaktepe Mine
(50% owned)
Çakmaktepe
lies five kilometers east of the Çöpler processing infrastructure. In 2019, Phase 1 was mined. Exploration is investigating
continuity to Ardich, which is immediately adjacent to the northeast of Çakmaktepe.
The Mavialtin Porphyry
Belt (50% owned by SSR Mining)
The
Mavialtin Porphyry Belt contains at least four gold-copper porphyry type exploration targets over a seven by 20 kilometer area
from Çakmaktepe in the north to the deposit at Mavidere in the south. In February 2020, positive drill results were announced
for Mavidere, Findiklidere, and Aslantepe. The mineralization is close to surface and appears to be low in deleterious elements.
The
exploration strategy for Mavialtin is two-fold:
| • | Expand the known areas of mineralization,
while concurrently making new discoveries, to economically justify a stand-alone mine; and/or |
| • | Define a Mavialtin Complex where various
smaller deposits could be processed through a central facility. |
Mavialtin’s developmental potential
and optionality are supported by:
| • | Proximity to existing Çöpler
operations/infrastructure; |
| • | Near-surface nature of the mineralization; |
| • | Length of the mineralized intercepts which
indicate the potential for volume; and |
| • | Some high-grade intercepts. |
Based
on the results announced in February 2020, additional mapping and geochemistry, the Company drilled five diamond core holes totaling
2,122 meters in Findiklidere and drilled three diamond core holes totaling 1,384 meters in Saridere Prospects between July 2020
and October 2020.

Copper Hill Copper Exploration
Prospect (50% owned)
In
April 2020, the Company announced encouraging drill results from the Copper Hill exploration prospect in the Black Sea region (northeast
Turkey). The intercepts were high grade, close to surface and appear to be very low in contaminates. The drilling pattern was constrained
to areas previously permitted for drilling. Additional diamond drilling planned in 2020, to test the extension of the mineralization,
was deferred due to COVID-19 related issues and is now planned for the 2021 summer drill season.
Marigold Exploration
An
important focus of the 2020 exploration program was to identify new Mineral Resources on 11,740 hectares of adjoining mineral tenures
that were acquired between 2015 and 2019.
At
Valmy, there are three historic open pits mined by previous owners between 2002 and 2005, which produced approximately 196,000
ounces of gold. The Company has been expanding Mineral Resources around these pits since acquisition in 2015.
At
Trenton Canyon, there is a historical Mineral Resource area and three mined pits developed by previous owners between 1996 and
2005, which produced approximately 290,000 ounces of gold. Since acquisition in 2019, the Company has been conducting exploration
to confirm the historic drill database validity and expand known mineralization areas. The main objective is to define an open-pit
oxide gold Mineral Resource amenable to heap leach processing.

At
Buffalo Valley, predecessor companies mined a small open pit, which produced approximately 50,000 ounces of gold between 1987 and
1990. Following acquisition in mid-2019, the Company has focused on verifying historical information and assessing the potential
for oxide gold Mineral Resources.
A
focus for the Company is to increase gold production at Marigold by defining Mineral Resources to support additional stand-alone
heap leach facilities in the North Peak area. In 2020, Marigold tested areas south of the currently producing Mackay Pit including
Valmy, Crossfire, East Basalt, Section 6 and Trenton Canyon. As a result of land acquisitions, the Company is exploring the opportunity
for a larger pit concept, encompassing East Basalt, Antler, Battle Cry and Section 6, which the Company refers to as New Millennium.
In total, 15,185 meters of reverse circulation drilling in 48 holes and 1,055 meters of core drilling in 1 hole were completed
in the fourth quarter of 2020. During 2020, a total of 72,788 meters were completed in 208 drill holes.
The
Company completed 17.6 kilometers of seismic geophysical survey in two lines; one east-west transect, crossing just south of the
Basalt and Antler open pits, and a north-south line the length of the Marigold deposits and onto the Trenton Canyon ground. Once
compiled, the Company expects to validate the interpretation with the current core drilling results that have identified the favorable
Comus Formation. This work aims to establish a method of mapping the 3D structure of the main rock assemblages beneath the entire
property to identify targets with potential for higher-grade sulfide mineralization.
In
the fourth quarter of 2020, a soil sampling program was initiated at the Trenton Canyon property. A total of 14.5 square kilometers
of coverage is planned, with samples collected in a 61 meter staggered grid pattern for 3,854 total samples. In the fourth quarter
of 2020, the Company completed approximately 1.5 square kilometers, collecting 395 samples. This program is expected to be completed
in the first quarter of 2021, weather permitting. The soil survey covers an area of ground east of the Trenton Canyon mine extending
to the tenement boundary where there is no historic surface geochemical coverage. Anomalous gold and pathfinder concentrations
in soil strongly correlate to known mineral centers at Trenton Canyon, and anomalies identified by the new survey will be evaluated
for future exploration campaigns.
For
2021, the Company is planning 71,450 meters of reverse circulation and core drilling for Mineral Resource and Mineral Reserve conversion
and additions at Mackay, Valmy, New Millennium, Trenton Canyon, and Buffalo Valley.
Canada Exploration
The
Company controls two separate claim groupings in Saskatchewan, Canada: Seabee and the Amisk project, which is 140 kilometers southeast
of Seabee.
Seabee
The
Seabee mineral interests comprise 100%-owned mineral tenures that are referred to as Seabee claims and an 80% owned joint venture
interest on the contiguous Fisher property. Through late 2020 and early 2021, Seabee exercised its option to acquire 80% of the
Fisher property and establish a joint venture, with Seabee being the operator, to advance exploration and development. Exploration
activities in 2020, particularly at Fisher and other Seabee brownfield targets, were impacted as the mine shut down and then reduced
ancillary activities due to COVID-19.
At
Santoy, recent exploration success on Gap Hanging Wall ("Gap HW") encouraged the Company to establish underground access
to the zone on the 46 level, which is 450 meters below surface. Gap HW has excellent potential to provide additional ore feed and
is approximately 220 meters in the 8A mining area's hanging wall. Sheeted quartz veins in siliceous intrusive rock host gold mineralization
at Gap HW, and the metallurgy is similar to other ores from Santoy.
The
first excavation in the Gap HW was completed in the fourth quarter of 2020. A total of 12,470 tonnes of mineralized material was
removed, with results reconciling closely to the Company’s block model estimates in this part of the orebody. In addition,
the excavation provided the Company with geotechnical, structural and grade continuity determinations critical for mine design.
A mobile drill rig is currently drilling tightly spaced holes into the foot wall and hanging wall of the current excavation to
further determine grade continuity across the entire width of the zone and enhance future block model estimates, development drives
and stope design initiatives. This program is intended to confirm structural interpretation, continuity and grades as part of the
technical work to convert Mineral Resources to Mineral Reserves.
The
focus of drilling efforts for the fourth quarter of 2020 remained on infill and extension drilling of the Gap HW, as well as exploring
the prospective Santoy Hanging Wall (Santoy HW) target. During the fourth quarter of 2020, the Company drilled 9,606 meters underground
and an additional 3,887 meters from surface for a combined total of 13,493 meters. During 2020, the Company completed 39,855 meters
of drilling underground and 9,638 meters from surface for a total of 49,493 meters.
In
the first quarter of 2020, brownfield exploration drilling approximately 1 kilometer south of the Santoy Mine Complex encountered
high-grade gold mineralization at the Joker target. The sheeted quartz veins are hosted in the same siliceous intrusive rocks as
the Gap HW deposit and represent an encouraging new target to be followed-up in 2021.
The
Fisher property is contiguous to Seabee claims and, in May 2020, the Company reported encouraging drill results from gold prospects
at Mac North, Yin and Abel Lake. In the fourth quarter of 2020, the Company completed a 3,500 meter drill program at the Mac North
target and was successful in expanding the zone down-plunge and along strike, encountering wider visible gold-bearing zones than
previous drilling. In total, the Company drilled 37 holes for 12,976 meters at Fisher in 2020. These targets will be further explored
in 2021.
Amisk
The
Amisk property is 39,882 hectares and hosts an Indicated Mineral Resource estimate. Proterozoic volcano-sedimentary rock assemblages,
prospective for both base metal massive sulfide deposits and orogenic gold deposits, underlie the area. The Company’s plan
for this property is to investigate its potential for lode gold mineralization on the claim's western portion. The summer field
program comprised detailed mapping and prospecting of the numerous gold showings on the property.
2021 Outlook
For the full year 2021, the Company expects
to produce, on a consolidated basis, 720,000 to 800,000 gold equivalent ounces from its four operating mines at consolidated AISC
of $1,050 to $1,110 per gold equivalent ounce.
| Operating
Guidance (100%) (1) |
|
Çöpler
(2) |
Marigold |
Seabee
|
Puna |
Other |
Consolidated |
| Gold Production |
koz |
310 - 340 |
235 - 265 |
95 - 105 |
- |
- |
640 - 710 |
| Silver Production |
Moz |
- |
- |
- |
6.0 - 7.0 |
- |
6.0 - 7.0 |
| Gold Equivalent Production |
koz |
310 - 340 |
235 - 265 |
95 - 105 |
80 - 90 |
- |
720 - 800 |
| Cash Cost per Ounce (3) |
$/oz |
550 - 600 |
810 - 860 |
525 - 575 |
10.00 - 11.50 |
- |
660 - 715 |
|
Sustaining Capital
Expenditures (4) |
$M |
52 |
53 |
11 |
19 |
- |
135 |
| Capitalized Stripping / Capitalized Development |
$M |
9 |
47 |
19 |
13 |
- |
88 |
| Sustaining Exploration Expenditures |
$M |
2 |
7 |
1 |
1 |
- |
11 |
| General & Administrative (5) |
$M |
- |
- |
- |
- |
30 - 35 |
30 - 35 |
| Share Based Compensation (5) |
$M |
- |
- |
- |
- |
15 - 20 |
15 - 20 |
| All-In Sustaining Cost per Ounce (3) |
$/oz |
760 - 810 |
1,250 - 1,290 |
860 - 910 |
16.00 - 17.50 |
- |
1,050 - 1,110 |
| Growth Capital Expenditures |
$M |
26 |
- |
7 |
- |
- |
33 |
| Growth Exploration and Development Expenditures(6) |
$M |
31 |
11 |
7 |
- |
5 |
54 |
| Total Growth Capital |
$M |
57 |
11 |
14 |
- |
5 |
87 |
| (1) | Figures may not add due to rounding |
| (2) | Figures are reported on a 100% basis. Çöpler is 80% owned by SSR Mining. |
| (3) | SSR Mining reports the non-GAAP financial measures of cash costs and AISC per ounce of gold and
silver sold to manage and evaluate operating performance at Çöpler, Marigold, Seabee and Puna. Refer to Section 13
"Non-GAAP Financial Measures". |
| (4) | Excludes sustaining exploration expenditures. Includes $9.5 million oxygen plant lease payment
at Çöpler. |
| (5) | General and administrative expenses exclude share-based compensation, which is reported separately. |
| (6) | Growth exploration and development expenditures are shown on a 100% basis, of which SSR Mining
attributable amount totals $46 million. |
| (7) | All figures in U.S. dollars, unless otherwise noted. Gold equivalent figures for 2021 operating
guidance are based on a gold-to-silver ratio of 76:1. Cash costs and capital expenditures guidance is based on an oil price of
$45 per barrel and an exchange rate of 1.30 Canadian dollars to one U.S. dollar and 7.5 Turkish lira to one U.S. dollar. |
2021 Priority Operational
and Development Catalysts
Çöpler:
| • | Flotation circuit construction, with expected
ramp-up beginning mid-year 2021 |
| • | Ardich exploration and concurrent development
towards first production in 2023 |
| • | C2 Porphyry copper-gold exploration and
advancement, focusing on an expandable development plan |
Marigold:
| • | Ongoing cost reduction and continuous improvement
initiatives |
| • | Oxide exploration targeting higher grades
and conversion at Mackay, Valmy, New Millennium, Trenton Canyon and Buffalo Valley |
| • | Sulfide exploration and evaluation |
Seabee:
| • | Increase mining rates to exploit latent
mill capacity |
| • | Gap Hanging Wall Mineral Resource conversion
|
| • | Seabee and Fisher exploration and resource
development |
Puna:
| • | Continue steady state production with focus
on increasing productivity |
| • | Achieve and sustain mill throughput rates
above 4,000 tonnes per day |
| • | Implement and integrate owner-operated
ore transport fleet |
Free cash flow generation in 2021 is expected
to be approximately 75% weighted to the second half of the year due to the timing of the ramp-up and commissioning of the flotation
circuit at Çöpler, timing of capital expenditures across all sites, working capital seasonality at Seabee, and tax
and royalty payments that are paid in the first half of the year.
Capital Returns
The Company's capital allocation strategy
is to balance continuing investment in high-return growth, maintaining peer leading financial strength, and providing sustainable
capital returns to shareholders.
In recognition of SSR Mining's position
as a leading and sustainable free cash flow generator in the intermediate gold sector, it is the Company's intention to return
excess attributable free cash flow to shareholders through a two-tiered capital return structure. While a recurring quarterly dividend
is expected to be the primary method of capital return, the Company will periodically evaluate supplementing this dividend from
excess attributable free cash flow in the form of incremental dividends and/or share buyback programs.
On
February 17, 2021, the Company’s Board of Directors approved its inaugural quarterly dividend payment of $0.05 per common
share to be paid on March 31, 2021 to shareholders of record on March 5, 2021. The dividend was designated as an “eligible
dividend” for Canadian federal and provincial income tax purposes. Dividends paid to shareholders who are non-residents of
Canada will be subject to Canadian non-resident withholding taxes.
Financial and Operating
Highlights
A summary of the Company's consolidated
financial and operating results for the three months and year ended December 31, 2020 and 2019 are presented below:
| (in thousands of US dollars, except per share data) |
Three months ended December 31, |
Year ended December 31, |
| |
2020 |
2019 |
2020 |
2019 |
| Financial Results |
|
|
|
|
| Revenue |
$ |
370,729 |
|
$ |
177,603 |
|
$ |
853,089 |
|
$ |
606,850 |
|
| Income from mine operations |
$ |
146,456 |
|
$ |
58,913 |
|
$ |
308,642 |
|
$ |
170,883 |
|
| Gross margin (2) |
40 |
% |
33 |
% |
36 |
% |
28 |
% |
| Operating income |
$ |
120,332 |
|
$ |
43,228 |
|
$ |
202,713 |
|
$ |
122,338 |
|
| Net income |
$ |
97,654 |
|
$ |
19,479 |
|
$ |
140,468 |
|
$ |
55,757 |
|
| Net income attributable to equity holders of SSR Mining |
$ |
89,039 |
|
$ |
19,479 |
|
$ |
133,494 |
|
$ |
57,315 |
|
| Basic attributable net income per share |
$ |
0.41 |
|
$ |
0.16 |
|
$ |
0.88 |
|
$ |
0.47 |
|
| Adjusted attributable net income (1) |
$ |
108,813 |
|
$ |
23,717 |
|
$ |
213,172 |
|
$ |
78,758 |
|
| Adjusted basic attributable net income per share (1) |
$ |
0.50 |
|
$ |
0.19 |
|
$ |
1.41 |
|
$ |
0.65 |
|
| |
|
|
|
|
| Cash generated by operating activities |
$ |
217,383 |
|
$ |
51,917 |
|
$ |
348,615 |
|
$ |
145,844 |
|
| Cash (used in) generated by investing activities |
$ |
(54,099) |
|
$ |
(22,303) |
|
$ |
180,790 |
|
$ |
(130,328) |
|
| Cash (used in) generated by financing activities |
$ |
(36,938) |
|
$ |
(3,536) |
|
$ |
(173,204) |
|
$ |
68,907 |
|
| |
|
|
|
|
| Operating Results |
|
|
|
|
| Gold produced (oz) |
191,885 |
|
81,255 |
|
418,744 |
|
332,364 |
|
| Gold sold (oz) |
182,328 |
|
85,404 |
|
414,163 |
|
331,350 |
|
| Silver produced ('000 oz) |
2,165 |
|
2,132 |
|
5,581 |
|
7,674 |
|
| Silver sold ('000 oz) |
1,010 |
|
2,584 |
|
4,661 |
|
7,695 |
|
| Lead produced ('000 lb) (4) |
6,529 |
|
7,985 |
|
17,193 |
|
23,957 |
|
| Lead sold ('000 lb) (4) |
3,158 |
|
9,371 |
|
14,903 |
|
24,119 |
|
| Zinc produced ('000 lb) (4) |
2,932 |
|
3,007 |
|
6,988 |
|
8,392 |
|
| Zinc sold ('000 lb) (4) |
1,898 |
|
3,067 |
|
6,039 |
|
14,072 |
|
| |
|
|
|
|
| Gold equivalent produced (oz) (5) |
220,432 |
|
106,205 |
|
484,153 |
|
421,828 |
|
| Gold equivalent sold (oz) (5) |
194,862 |
|
114,268 |
|
465,471 |
|
415,383 |
|
| |
|
|
|
|
| Average realized gold price ($/oz sold) |
$ |
1,880 |
|
$ |
1,480 |
|
$ |
1,812 |
|
$ |
1,394 |
|
| Average realized silver price ($/oz sold) |
$ |
24.78 |
|
$ |
17.32 |
|
$ |
21.23 |
|
$ |
16.26 |
|
| |
|
|
|
|
| Cash cost per gold equivalent ounce sold (1, 5) |
$ |
693 |
|
$ |
716 |
|
$ |
759 |
|
$ |
740 |
|
| AISC per gold equivalent ounce sold (1, 5) |
$ |
976 |
|
$ |
1,088 |
|
$ |
1,138 |
|
$ |
1,087 |
|
| |
|
|
|
|
| Financial Position |
December 31, 2020 |
December 31, 2019 |
| Cash and cash equivalents |
$ |
860,637 |
|
$ |
503,647 |
|
| Current assets |
$ |
1,424,522 |
|
$ |
899,662 |
|
| Total assets |
$ |
5,244,986 |
|
$ |
1,750,107 |
|
| Current liabilities |
$ |
248,933 |
|
$ |
234,171 |
|
| Total liabilities |
$ |
1,305,083 |
|
$ |
616,153 |
|
| Working capital (3) |
$ |
1,175,589 |
|
$ |
665,491 |
|
| (1) | The Company reports non-GAAP financial measures including adjusted attributable net income, adjusted
basic attributable net income per share, cash costs and AISC per ounce sold to manage and evaluate its operating performance at
its mines. See "Non-GAAP Financial Measures" in Section 13. |
| (2) | Gross margin is defined as income from mine operations divided by revenue. |
| (3) | Working capital is defined as current assets less current liabilities. |
| (4) | Data for lead production and sales relate only to lead in lead concentrate. Data for zinc production
and sales relate only to zinc in zinc concentrate. |
| (5) | Gold equivalent ounces have been established using the average realized metal prices per ounce
of precious metals sold in the period and applied to the recovered silver metal content produced by the mines. Zinc and lead production
are not included in gold equivalent ounces produced. |
Management Discussion
& Analysis and Conference Call
This news release should be read in conjunction
with our audited Consolidated Financial Statements and our MD&A as filed with the Canadian Securities Administrators and available
at www.sedar.com or our website at www.ssrmining.com.
| • | Conference call and webcast: Wednesday, February 17, 2021, at 5:00
pm EST. |
| Toll-free in U.S. and Canada: |
+1 (800) 319-4610 |
| All other callers: |
+1 (416) 915-3239 |
| Webcast: |
http://ir.ssrmining.com/investors/events |
| • | The conference call will be archived and
available on our website. Audio replay will be available for two weeks by calling: |
| Toll-free in U.S. and Canada: |
+1 (855) 669-9658, replay code 6092 |
| All other callers: |
+1 (412) 317-0088, replay code 6092 |
About SSR Mining
SSR Mining Inc. is a leading, free cash
flow focused intermediate gold company with four producing assets located in the USA, Turkey, Canada, and Argentina, combined with
a global pipeline of high-quality development and exploration assets in the USA, Turkey, Mexico, Peru, and Canada. In 2020, the
four operating assets produced approximately 711,000 gold-equivalent ounces. SSR Mining is listed under the ticker symbol SSRM
on the NASDAQ and the TSX, and SSR on the ASX.
SOURCE: SSR Mining Inc.
SSR Mining Contacts:
F. Edward Farid, Executive Vice President,
Chief Corporate Development Officer
Brian Martin, Director, Corporate Development & Investor
Relations
SSR Mining Inc.
E-Mail: invest@ssrmining.com
Phone: +1 (888) 338-0046 or +1 (604) 689-3846
To receive SSR Mining’s news
releases by e-mail, please register using the SSR Mining website at www.ssrmining.com.
Cautionary Note Regarding Forward-Looking
Statements
Except
for statements of historical fact relating to the Company, certain statements contained in this press release constitute forward-looking
information, future oriented financial information, or financial outlooks (collectively “forward-looking information”)
within the meaning of Canadian securities laws. Forward-looking information may be contained in this document and the Company’s
other public filings. Forward-looking information relates to statements concerning the Company’s outlook and anticipated
events or results and in some cases, can be identified by terminology such as “may”, “will”, “could”,
“should”, “expect”, “plan”, “anticipate”, “believe”, “intend”,
“estimate”, “projects”, “predict”, “potential”, “continue” or other
similar expressions concerning matters that are not historical facts.
Forward-looking information and statements
in this press release are based on certain key expectations and assumptions made by the Company. Although the Company believes
that the expectations and assumptions on which such forward-looking information and statements are based are reasonable, undue
reliance should not be placed on the forward-looking information and statements because the Company can give no assurance that
they will prove to be correct. Forward-looking information and statements are subject to various risks and uncertainties which
could cause actual results and experience to differ materially from the anticipated results or expectations expressed in this press
release. The key risks and uncertainties include, but are not limited to: local and global political and economic conditions; governmental
and regulatory requirements and actions by governmental authorities, including changes in government policy, government ownership
requirements, changes in environmental, tax and other laws or regulations and the interpretation thereof; developments with respect
to the coronavirus disease 2019 (“COVID-19”) pandemic, including the duration, severity and scope of the pandemic and
potential impacts on mining operations; and other risk factors detailed from time to time in the Company’s reports filed
with the Canadian securities regulatory authorities.
Forward-looking information and statements
in this press release include statements concerning, among other things: forecasts; outlook; timing of production; production,
cost, operating and capital expenditure guidance; the Company’s intention to return excess attributable free cash flow to
shareholders; the timing and implementation of the Company’s dividend policy; the granting of any supplemental dividends
or the implementation of any share buyback program or other supplements to the base dividend; statements regarding plans or expectations
for the declaration of future dividends and the amount thereof; future cash costs and AISC per payable ounce of gold, silver and
other metals sold; the prices of gold, silver and other metals; Mineral Resources, Mineral Reserves, realization of Mineral Reserves,
and the existence or realization of Mineral Resource estimates; the Company’s ability to discover new areas of mineralization;
the timing and extent of capital investment at the Company’s operations; the timing and extent of capitalized stripping at
the Company’s operations; the timing of production and production levels and the results of the Company’s exploration
and development programs; current financial resources being sufficient to carry out plans, commitments and business requirements
for the next twelve months; movements in commodity prices not impacting the value of any financial instruments; estimated production
rates for gold, silver and other metals produced by the Company; the estimated cost of sustaining capital; availability of sufficient
financing; receipt of regulatory approvals; the timing of studies, announcements, and analysis; the timing of construction and
development of proposed mines and process facilities; ongoing or future development plans and capital replacement; estimates of
expected or anticipated economic returns from the Company’s mining projects, including future sales of metals, concentrate
or other products produced by the Company and the timing thereof; the Company’s plans and expectations for its properties
and operations; and all other timing, exploration, development, operational, financial, budgetary, economic, legal, social, environmental,
regulatory, and political matters that may influence or be influenced by future events or conditions.
Such forward-looking information and
statements are based on a number of material factors and assumptions, including, but not limited in any manner to, those disclosed
in any other of the Company’s filings, and include: the inherent speculative nature of exploration results; the ability to
explore; communications with local stakeholders; maintaining community and governmental relations; status of negotiations and completion
of transactions, including joint ventures; weather conditions at the Company’s operations; commodity prices; the ultimate
determination of and realization of Mineral Reserves; existence or realization of Mineral Resources; the development approach;
availability and receipt of required approvals, titles, licenses and permits; sufficient working capital to develop and operate
the mines and implement development plans; access to adequate services and supplies; foreign currency exchange rates; interest
rates; access to capital markets and associated cost of funds; availability of a qualified work force; ability to negotiate, finalize,
and execute relevant agreements; lack of social opposition to the Company’s mines or facilities; lack of legal challenges
with respect to the Company’s properties; the timing and amount of future production; the ability to meet production, cost,
and capital expenditure targets; timing and ability to produce studies and analyses; capital and operating expenditures; economic
conditions; availability of sufficient financing; the ultimate ability to mine, process, and sell mineral products on economically
favorable terms; and any and all other timing, exploration, development, operational, financial, budgetary, economic, legal, social,
geopolitical, regulatory and political factors that may influence future events or conditions. While the Company consider these
factors and assumptions to be reasonable based on information currently available to the Company, they may prove to be incorrect.
The above list is not exhaustive of the
factors that may affect any of the Company’s forward-looking statements and information. You should not place undue reliance
on forward-looking information and statements. Forward-looking information and statements are only predictions based on the Company’s
current expectations and the Company’s projections about future events. Actual results may vary from such forward-looking
information for a variety of reasons including, but not limited to, risks and uncertainties disclosed in the Company’s filings
on the Company’s website at www.ssrmining.com, on SEDAR at www.sedar.com, on EDGAR at www.sec.gov and on the ASX at www.asx.com.au
and other unforeseen events or circumstances. Other than as required by law, the Company does not intend, and undertake no obligation
to update any forward-looking information to reflect, among other things, new information or future events.
All references to “$” in
this press release are to U.S. dollars unless otherwise stated.
Qualified Persons
Except as otherwise set out herein, the
scientific and technical information contained in this press release relating to Çöpler has been reviewed and approved
by Robert L. Clifford and Dr. Cengiz Y. Demirci, AIPG (CPG) each of whom is a qualified person under NI 43-101. Mr. Clifford is
the Director, Open Pit Mine Planning and Dr. Demirci is the Vice President, Exploration. The scientific and technical information
contained in this press release relating to Marigold has been reviewed and approved by Greg Gibson and James N. Carver, each of
whom is a SME Registered Member and a qualified person under NI 43-101. Mr. Gibson is the General Manager and Mr. Carver is the
Resource Development Manager at Marigold. The scientific and technical information contained in this press release relating Seabee
has been reviewed and approved by Samuel Mah, P.Eng., and Jeffrey Kulas, P. Geo., each of whom is a qualified person under NI 43-101.
Mr. Mah is the Director, Underground Mine Planning, and Mr. Kulas is the Resource Development Manager, Canada. The scientific and
technical information contained in this press release relating to Puna has been reviewed and approved by Robert Gill, P.Eng., and
Karthik Rathnam, MAusIMM (CP), each of whom is a qualified person under NI 43-101. Mr. Gill is the Company's General Manager at
Puna. Mr. Rathnam is the Company's Resource Manager, Corporate.
Cautionary Note to U.S. Investors
This press release includes Mineral Reserves
and Mineral Resources classification terms that comply with reporting standards in Canada and the Mineral Reserves and the Mineral
Resources estimates are made in accordance with NI 43-101 - Standards of Disclosure for Mineral Projects (“NI 43-101”).
NI 43-101 is a rule developed by the Canadian Securities Administrators that establishes standards for all public disclosure an
issuer makes of scientific and technical information concerning mineral projects. These standards differ significantly from the
requirements of the SEC set out in the SEC rules that are applicable to domestic United States reporting companies. Consequently,
Mineral Reserves and Mineral Resources information included in this press release is not comparable to similar information that
would generally be disclosed by domestic U.S. reporting companies subject to the reporting and disclosure requirements of the SEC.
Accordingly, information concerning mineral deposits set forth herein may not be comparable with information made public by companies
that report in accordance with U.S. standards.
Cautionary Note Regarding Non-GAAP
Measures
This press release includes certain terms
or performance measures commonly used in the mining industry that are not defined under International Financial Reporting Standards
(“IFRS"), including free cash flow, cash costs and AISC per payable ounce of gold and silver sold, realized metal prices,
earnings before interest, taxes, depreciation and amortization (“EBITDA”), adjusted attributable net income, adjusted
basic attributable earnings per share, consolidated cash and consolidated net cash. Non-GAAP measures do not have any standardized
meaning prescribed under IFRS and, therefore, they may not be comparable to similar measures employed by other companies. The Company
believe that, in addition to conventional measures prepared in accordance with IFRS, certain investors use this information to
evaluate the Company’s performance. The data presented is intended to provide additional information and should not be considered
in isolation or as a substitute for measures of performance prepared in accordance with IFRS. Readers should refer to the endnotes
in this press release for further information regarding how the Company calculates certain of these measures. Readers should also
refer to the Company’s management's discussion and analysis, available under the Company’s corporate profile at www.sedar.com
or on the Company’s website at www.ssrmining.com, under the heading “Non-GAAP Financial Measures” for a more
detailed discussion of how the Company calculates such measures and a reconciliation of certain measures to GAAP terms.
This regulatory filing also includes additional resources:
ex994.pdf
SSR Mining (NASDAQ:SSRM)
Historical Stock Chart
From Apr 2024 to May 2024

SSR Mining (NASDAQ:SSRM)
Historical Stock Chart
From May 2023 to May 2024
