UNITED STATES
SECURITIES AND EXCHANGE COMMISSION
Washington, D.C. 20549
Report Of Foreign Private Issuer
Pursuant To Rule 13a-16 Or 15d-16 Of
The Securities Exchange Act Of 1934
For the month of November, 2023
Commission File Number: 333-
Zenvia Inc.
(Exact name of registrant as specified in its charter)
Avenida Paulista, 2300, 18th Floor, Suites 182 and 184
São Paulo, São Paulo, 01310-300
Brazil
(Address of Principal Executive Offices)
Indicate by check mark whether the registrant files or will file annual reports under cover of Form 20-F or Form 40-F:
Form 20-F ____X____ Form 40-F ________
Indicate by check mark if the registrant is submitting the Form 6-K in paper as permitted by Regulation S-T Rule 101(b)(1):
Yes ________ No ____X____
Indicate by check mark if the registrant is submitting the Form 6-K in paper as permitted by Regulation S-T Rule 101(b)(7):
Yes ________ No ____X____
Q3 ’ 2 3 E a r n i n g s P r e s e n t a t i o n

LEGAL DISCLAIMER This document contains forward-looking statements within the meaning of Section 27A of the Securities Act of 1933, and Section 21E of the Securities Exchange Act of 1934, each as amended, including, in particular, statements about the Company’s plans, strategies and prospects and estimates of industry growth or prospects. These statements identify prospective information and may include words such as “believe,” “may,” “will,” “aim,” “estimate,” “continue,” “anticipate,” “intend,” “expect,” “forecast,” “plan,” “predict,” “project,” “potential,” “aspiration,” “objectives,” “should,” “purpose,” “belief,” “should,” “expects, “target” and similar, or variations of, or the negative of such words and expressions, although not all forward-looking statements contain these identifying words. All statements other than statements of historical fact contained in this presentation may be forward-looking statements. The Company has based these forward-looking statements on its estimates and assumptions of its financial results and its current expectations and projections about future events and financial trends that it believes may affect its financial condition, results of operations, business strategy, short-term and longterm business operations and objectives, and financial needs as of the date of this presentation. These forward-looking statements are conditioned upon and also involve a number of known and unknown risks, uncertainties, and other factors that could cause actual results, performance or events to differ materially from those anticipated by these forward-looking statements. Such risks, uncertainties, and other factors may be beyond the Company’s control and may pose a risk to the Company’s operating and financial condition. In addition, the Company operates in a very competitive and rapidly changing environment. New risks emerge from time to time. It is not possible for the Company’s management to predict all risks, nor can the Company assess the impact of all factors on its business or the extent to which any factor, or combination of factors, may cause actual results to differ materially from those contained in any forward-looking statements that the Company may make. Accordingly, you should not rely upon forward-looking statements as predictions of future events. Risks that contribute to the uncertain nature of the forward-looking statements include, among others, risks associated with the Company’s ability to innovate and respond to technological advances, changing market needs and customer demands, such as the use of and demand for SMS text message service and cloud-based platform communications; the Company’s ability to successfully acquire new businesses as customers, acquire customers in new industry verticals and appropriately manage its international expansion; the Company’s failure to enhance its brand recognition or maintain a positive public image; the inherent risks related to the CPaaS market, such as the interruption, failure or breach of its computer or information technology systems, resulting in the degradation of the quality or a decline in the use of the products and services offered; general economic, political and business conditions in Brazil, including as a result of the impacts of the COVID-19 pandemic, and their impact on the Company’s business, notably with respect to inflation and interest rates and their impact on the discretionary spending of businesses; the Company’s ability to face challenges in the expansion of its operations and its offerings into new market segments and/or new geographic regions within and outside of Brazil; the impact of substantial and increasing competition in the Company’s market, innovation by its competitors, and its ability to compete effectively; the Company’s compliance with applicable regulatory and legislative developments and regulations and legislation that currently apply or become applicable to its business as it continues to grow; the Company’s ability to attract and retain qualified personnel while controlling its personnel related expenses; the dependence of the Company’s business on its relationship with service providers as well with certain cloud infrastructure providers; the Company’s ability to maintain, protect and enhance its brand and intellectual property; the Company’s ability to maintain its classification as an emerging growth company under the JOBS Act; health crises, including due to pandemics such as the COVID-19 pandemic and government measures taken in response thereto; other factors that may affect the Company’s financial condition, liquidity and results of operations; and other known and unknown risks, all of which are difficult to predict and many of which are beyond the Company’s control. The Company has provided additional information in its reports on file with the Securities and Exchange Commission concerning factors that could cause actual results to differ materially from those contained in this presentation and encourages you to review these factors. The statements contained in this presentation are based on the Company’s current beliefs and expectations and speak only as of the date of this presentation. The Company disclaims any intention or obligation to update or revise any forward-looking statements, whether as a result of new information, future events and/or otherwise, except to the extent required by law. To supplement the financial measures presented in this press release and related conference call, presentation, or webcast in accordance with GAAP, the Company also presents the following non-GAAP measures of financial performance: NonGAAP Gross Profit, Non-GAAP Operating Profit (Loss), EBITDA and Adjusted EBITDA. A non-GAAP financial measure is generally defined as one that purports to measure financial performance but excludes or includes amounts that would not be so adjusted in the most comparable GAAP measure. Non-GAAP financial measures do not have standardized meanings and may not be directly comparable to similarly-titled measures adopted by other companies. These non-GAAP financial measures are used by our management for decision-making purposes and to assess our financial and operating performance, generate future operating plans and make strategic decisions regarding the allocation of capital. We also believe that the disclosure of our Non-GAAP Gross Profit, Non-GAAP Operating Profit (Loss), EBITDA and Adjusted EBITDA provides useful supplemental information to investors and financial analysts and other interested parties in their review of our operating performance. Potential investors should not rely on information not recognized under IFRS as a substitute for the IFRS measures of earnings, cash flows or profit (loss) in making an investment decision. There are significant limitations associated with the use of non-GAAP financial measures. Further, these measures may differ from the non-GAAP information, even where similarly titled, used by other companies and therefore should not be used to compare the Company’s performance to that of other companies. Certain market and/or industry data used in this presentation were obtained from internal estimates and studies, where appropriate, as well as from market research and publicly available information. Such information may include data obtained from sources believed to be reliable. However, the Company disclaims the accuracy and completeness of such information, which is not guaranteed. Internal estimates and studies, which the Company believes to be reliable, have not been independently verified. The Company cannot assure recipients of this presentation that such data is accurate or complete. Recipients of this presentation are not to construe the contents of this summary as legal, tax or investment advice and recipients should consult their own advisors in this regard. This presentation has been prepared solely for informational purposes. Neither the information contained in this presentation, nor any further information made available by the Company or any of its affiliates or employees, directors, representatives, officers, agents or advisers in connection with this presentation will form the basis of or be construed as a contract or any other legal obligatio
OPENING REMARKS Cassio Bobsin, CEO
KEY FINANCIAL HIGHLIGHTS
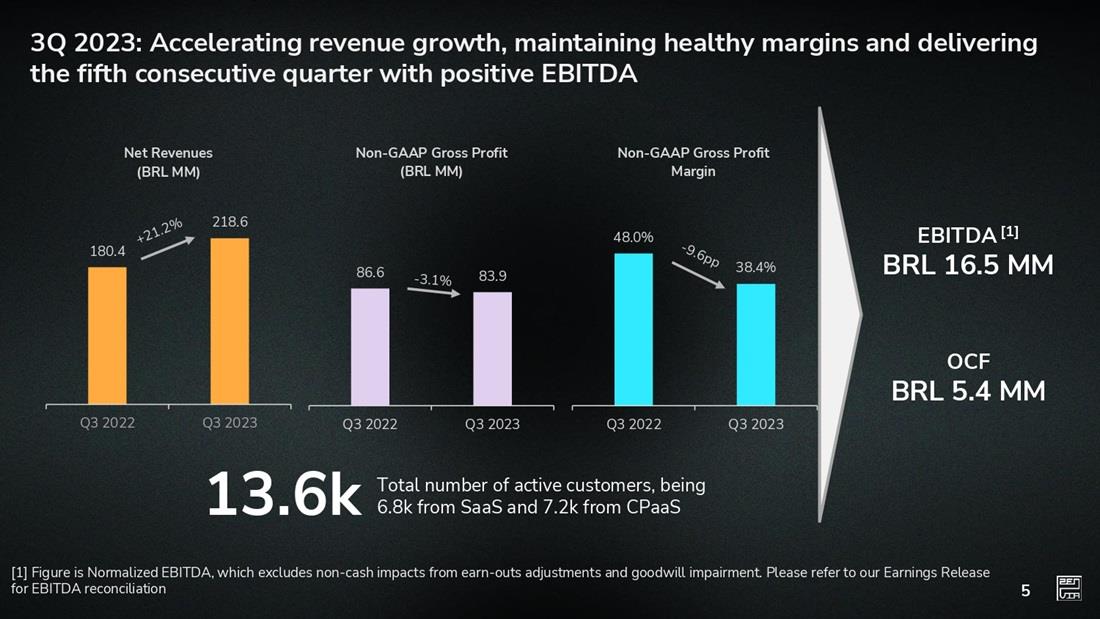
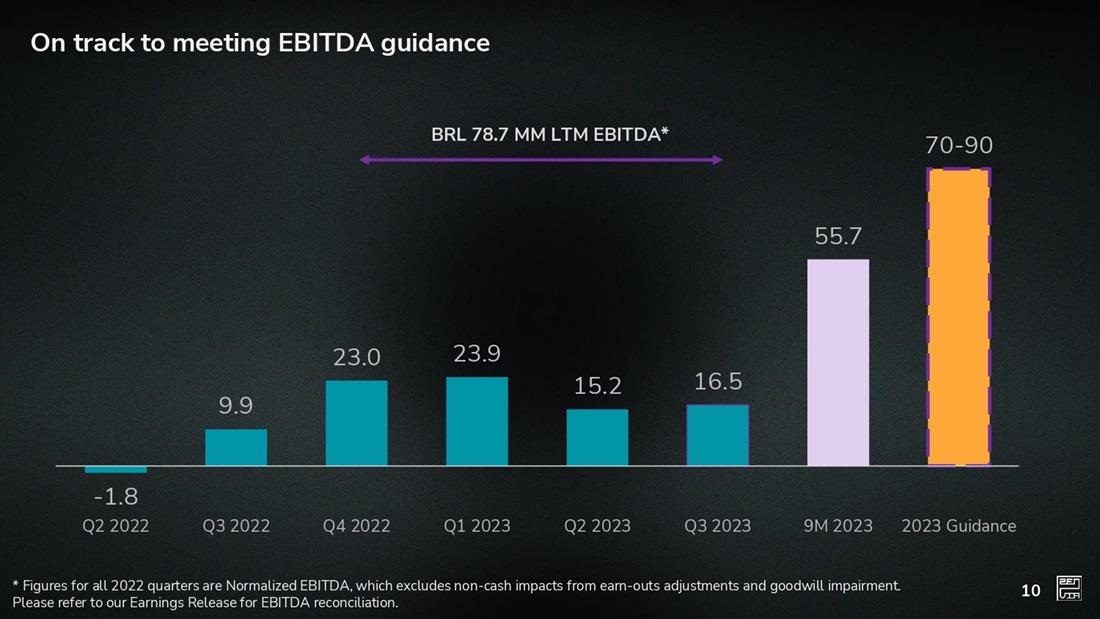
3Q 2023: Accelerating revenue growth, maintaining healthy margins and delivering the fifth consecutive quarter with positive EBITDA Total number of active customers, being 13.6k 6.8k from SaaS and 7.2k from CPaaS [1] Figure is Normalized EBITDA, which excludes non-cash impacts from earn-outs adjustments and goodwill impairment. Please refer to our Earnings Release for EBITDA reconciliation
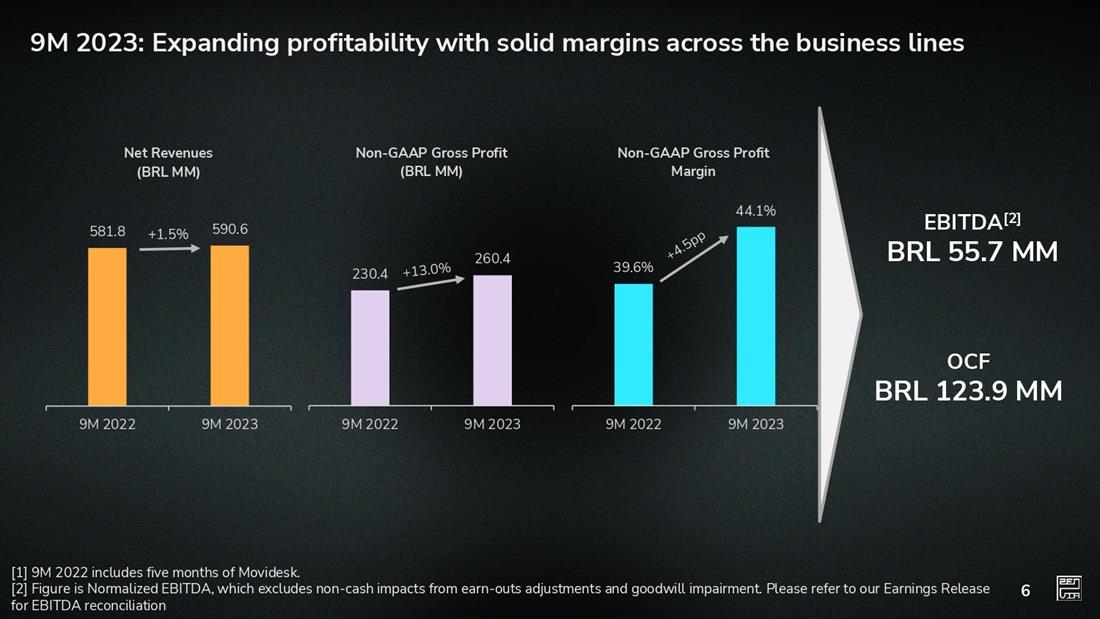
9M 2023: Expanding profitability with solid margins across the business lines Net Revenues (BRL MM) 39.6% 44.1% 9M 2022 9M 2023 Non-GAAP Gross Profit Margin EBITDA[2] BRL 55.7 MM OCF BRL 123.9 MM [1] 9M 2022 includes five months of Movidesk. [2] Figure is Normalized EBITDA, which excludes non-cash impacts from earn-outs adjustments and goodwill impairment. Please refer to our Earnings Release for EBITDA reconciliation
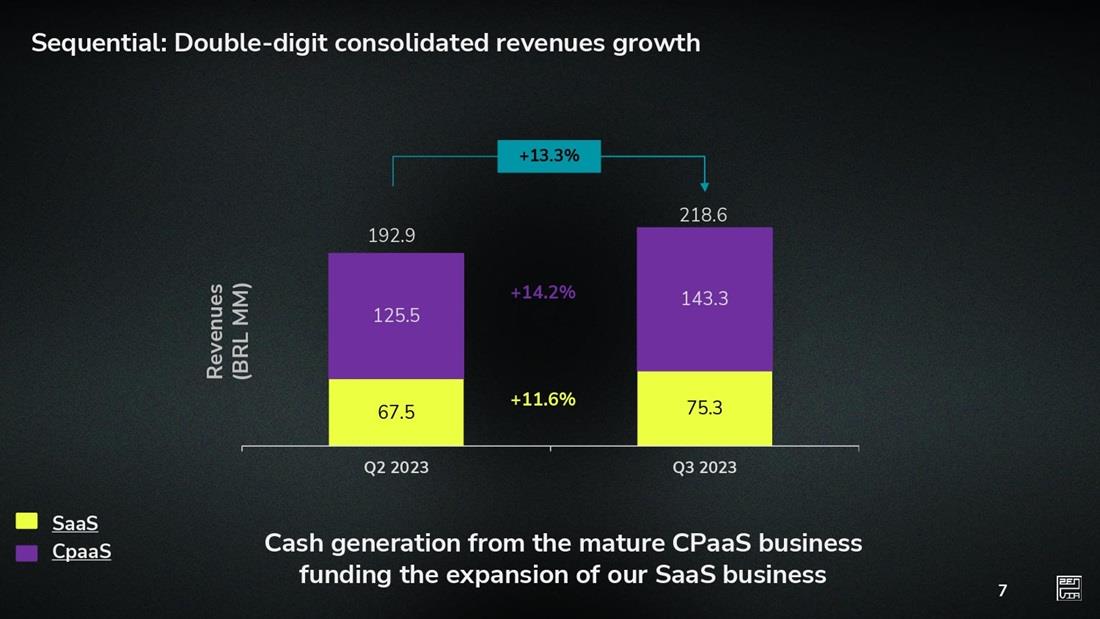
Sequential: Double-digit consolidated revenues growth Revenues (BRL MM) +13.3% CpaaS SaaS Cash generation from the mature CPaaS business funding the expansion of our SaaS business
SaaS expanding contribution to profitability Revenue Mix Non-GAAP Gross Profit Mix 66% 34% CpaaS SaaS Q3 2023 in SaaS ARR (September 2023) BRL 233MM in SaaS NRE (Q3 2023) 102%
3Q 2023: Accelerating revenue growth, maintaining healthy margins and delivering the fifth consecutive quarter with positive EBITDA Total number of active customers, being 13.6k 6.8k from SaaS and 7.2k from CPaaS [1] Figure is Normalized EBITDA, which excludes non-cash impacts from earn-outs adjustments and goodwill impairment. Please refer to our Earnings Release for EBITDA reconciliation
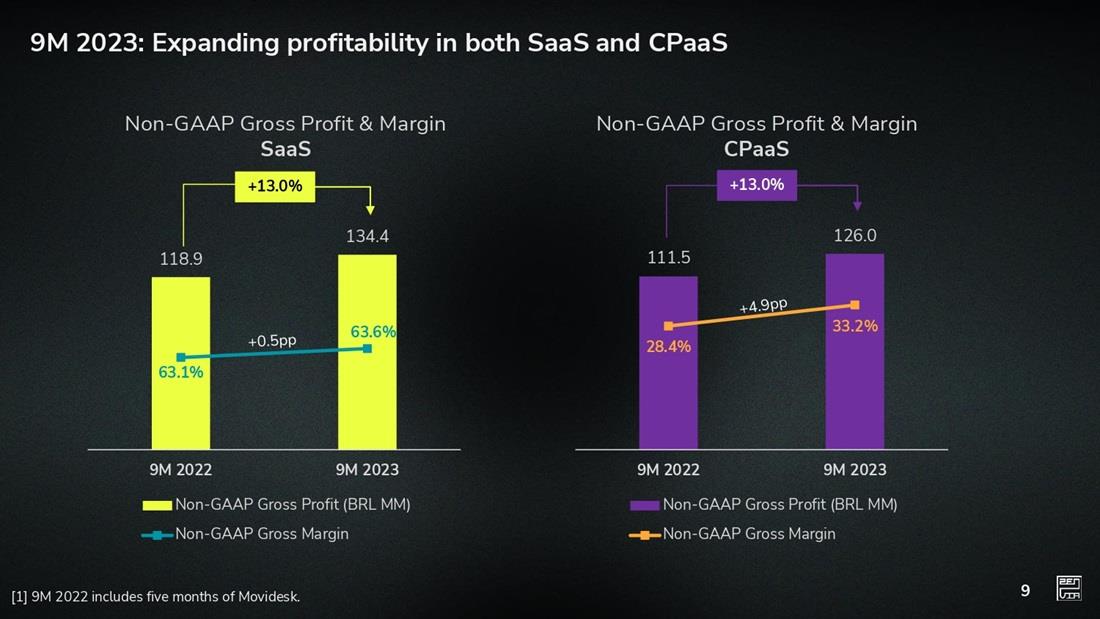
9M 2023: Expanding profitability with solid margins across the business lines Net Revenues (BRL MM) 39.6% 44.1% 9M 2022 9M 2023 Non-GAAP Gross Profit Margin 6 [1] 9M 2022 includes five months of Movidesk. [2] Figure is Normalized EBITDA, which excludes non-cash impacts from earn-outs adjustments and goodwill impairment. Please refer to our Earnings Release for EBITDA reconciliation +1.5% EBITDA[2] BRL 55.7 MM OCF BRL 123.9 MM
Higher EBITDA leading to OCF more than doubling YoY 9M 2023 9M 2022 Normalized EBITDA 55.7 0.4 Working Capital 109.5 103.8 Capex (41.2) (41.3) Non-GAAP Operating Cash Flow (OCF) 123.9 63.0 Financial (71.4) (54.3) Net funding (53.5) (29.1) Interest + Leasing (17.9) (25.2) Acquisitions (EOs) (35.1) (452.1) Exchange rate change on cash and cash equivalents (1.1) (17.7) Cash Balance Variation 16.3 (461.1) * Please refer to our Earnings Release for OCF reconciliation
2023 Guidance 830 870 490 500 340 370 42% 45% -2.0pp +1.0pp $70mn $90mn SaaS ˜63% CPaaS ˜26% YoY Growth 9 -15% * Normalized EBITDA, excluding non-cash impacts from earn-outs adjustments
/company/zenvia -inc/ /Zenvia.Inc @Zenvia_ @Zenvia | @ZenviaLatam /CanalZenvia
SIGNATURES
Pursuant to the requirements of the Securities Exchange Act of 1934, the registrant has duly caused this report to be signed on its behalf by the undersigned, thereto duly authorized.
Date: November 17, 2023
| |
By: |
/s/ Cassio Bobsin |
|
Name: Cassio Bobsin |
|
Title: Chief Executive Officer |