Canadian General Investments: Investment Update - Unaudited
04 August 2023 - 5:03AM

Canadian General Investments, Limited (CGI) (TSX: CGI) (LSE:
CGI) reports on an unaudited basis that its net asset value per
share (NAV) at July 31, 2023 was $58.05, resulting in year-to-date
and 12-month NAV returns, with dividends reinvested, of 21.4% and
19.2%, respectively. These compare with the 8.4% and 8.2% returns
of the benchmark S&P/TSX Composite Index on a total return
basis for the same periods.
The Company employs a leveraging strategy, by
way of bank borrowing, with the intent to enhance returns to common
shareholders. As at July 31, 2023, the leverage represented 14.5%
of CGI’s net assets, down from 14.9% at the end of 2022 and up from
14.0% at July 31, 2022.
The closing price for CGI’s common shares at July
31, 2023 was $36.40, resulting in year-to-date and 12-month share
price returns, with dividends reinvested, of 13.3% and 12.8%,
respectively.
The sector weightings of CGI’s investment
portfolio at market as of July 31, 2023 were as follows:
|
Information Technology |
22.7 |
% |
|
Industrials |
21.7 |
% |
|
Materials |
16.8 |
% |
|
Energy |
10.8 |
% |
|
Consumer Discretionary |
10.8 |
% |
|
Financials |
9.7 |
% |
|
Real Estate |
4.3 |
% |
|
Communication Services |
1.8 |
% |
|
Cash & Cash Equivalents |
0.7 |
% |
|
Health Care |
0.7 |
% |
| |
|
|
The top ten investments which comprised 41.7% of the investment
portfolio at market as of July 31, 2023 were as follows:
|
NVIDIA Corporation |
6.8 |
% |
|
First Quantum Minerals Ltd. |
5.1 |
% |
|
Canadian Pacific Kansas City Limited |
4.5 |
% |
|
TFI International Inc. |
4.3 |
% |
|
West Fraser Timber Co. Ltd. |
4.1 |
% |
|
Franco-Nevada Corporation |
4.0 |
% |
|
Apple Inc. |
3.9 |
% |
|
WSP Global Inc. |
3.1 |
% |
|
The Descartes Systems Group Inc. |
3.0 |
% |
|
Mastercard Incorporated |
2.9 |
% |
|
|
|
|
FOR FURTHER INFORMATION PLEASE CONTACT: Jonathan
A. Morgan President & CEO Phone: (416) 366-2931 Fax: (416)
366-2729 e-mail: cgifund@mmainvestments.com website:
www.canadiangeneralinvestments.ca
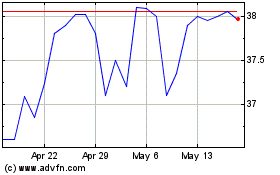
Canadian General Investm... (TSX:CGI)
Historical Stock Chart
From Dec 2024 to Jan 2025

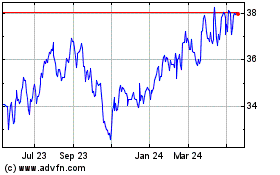
Canadian General Investm... (TSX:CGI)
Historical Stock Chart
From Jan 2024 to Jan 2025
