THIS DOCUMENT IS NOT INTENDED FOR DISSEMINATION OR DISTRIBUTION IN THE UNITED
STATES.


Questor Technology Inc. ("Questor" or the "Company") (TSX VENTURE:QST) announced
today its financial and operating results for the first quarter of 2013. The
Company reported a profit of $417,084 ($0.017per basic share) for the three
months ended March 31, 2013 compared to a profit of $487,438 ($0.020 per basic
share) for the same three-month period of the prior year.


The decrease in profit was due primarily to lower revenues arising out of
differences in the volume and mix of incinerator sales and utilization of the
fleet of rental incinerators in each quarter, offset in part by the stronger
margins achieved in the current quarter. Net foreign exchange gains recorded in
the first quarter of 2013 compared to foreign exchanges losses in the
comparative period of 2012, lower research and development expenditures and
lower income tax expense also contributed in reducing the impact of the lower
revenues on operating results.


FINANCIAL HIGHLIGHTS SUMMARY

(Stated in Canadian dollars except per share amounts)

                                                                  Increase
For the three months ended March 31         2013          2012   (decrease)
----------------------------------------------------------------------------

Revenue                                1,719,577     2,230,875    (511,298)
Gross profit(1)                          890,441     1,053,700    (163,259)
EBITDA(1)                                656,220       727,329     (71,109)
Profit and total comprehensive
 income                                  417,084       487,438     (70,354)
Cost of sales as a percent of
 revenue(1)                                 48.2%         52.8%      (4.6%)

Cash generated from operations
 before movements in non-cash
 working capital(1)                      662,405       774,985    (112,580)


                                       March 31,  December 31,    Increase
As at                                       2013          2012   (decrease)
----------------------------------------------------------------------------
Total assets                          10,439,573     9,798,449     641,124
Non-current liabilities                  280,034       250,065      29,969

Shares outstanding(2)
 Basic                                25,007,370    24,869,255     138,115
 Diluted                              25,225,542    25,144,794      80,748
Earnings per share - Basic                 0.017         0.020      (0.003)
Earnings per share - Diluted               0.017         0.019      (0.002)
----------------------------------------------------------------------------
(1) Non-IFRS financial measure. Please see discussion in the Non-IFRS
    Financial Measures section of the Company's Management's Discussion and
    Analysis for the three months ended March 31, 2013.
(2) Weighted average.


"Although our revenues are lower this quarter in comparison to the previous year
quarter, this is not a reflection of the expected performance for this year. We
have confirmed orders for incinerator sales of $4.0 million to date of which
only $1.2 million was recognized in first quarter 2013. We have taken
significant steps this first quarter of 2013, setting the stage for a very
active second quarter and balance of the year," said Audrey Mascarenhas,
President and Chief Executive Officer. "We completed the construction of units
that we had intended for our rental fleet, but are instead being sold to
customers to meet their timing requirements in Q2. We moved forward on several
joint venture arrangements for the construction of our units in Europe which
will prove to be a strategic location to also serve the Russian and Middle East
markets. Questor has appointed a Vice President Business Development which has
resulted in a series of productive meetings and discussions with both our US and
Canadian clients. We are supporting our clients in their quest for social
license to operate with our technology solution addressing community flaring
concerns that have attracted significant public attention."


"As the impact of the new emission standards in the United States becomes more
well understood, interest in our incineration technology has continued to grow.
In addition, regulation in Europe is becoming increasingly focused on emissions
and some countries have begun to disallow open flaring, thereby creating
opportunities for Questor.


As we move through 2013 we expect to see substantial growth in the sale and
rental of our units as the marketplace recognizes the operational, environmental
and economic benefits Questor's clean air solutions offer. Our focus will be on
increasing our operating capacity to meet this demand." concluded Ms.
Mascarenhas.


Shareholders are invited to attend the Company's Annual General Meeting to be
held on Tuesday, June 4, 2013 at 3:00 p.m. MDT in Questor's Boardroom at 1121
940 - 6th Avenue S.W., Calgary, Alberta. In addition to the formal business
items, management will be presenting an overview of Questor's results for the
financial year ended December 31, 2012 and first quarter ended March 31, 2013
and discussing the Company's strategic initiatives for 2013.


Questor's unaudited condensed financial statements and notes thereto and
management's discussion and analysis for the three months ended March 31, 2013
will be available shortly on the Company's website at www.questortech.com and
through SEDAR at www.sedar.com.


ABOUT QUESTOR TECHNOLOGY INC.

Questor is an international environmental oilfield service company founded in
late 1994 and headquartered in Calgary, Alberta, Canada with a field office
located in Grande Prairie, Alberta. The Company is focused on clean air
technologies with activities in Canada, the United States, Europe and Asia.
Questor designs and manufactures high efficiency waste gas incinerators for sale
or for use on a rental basis and also provides combustion-related oilfield
services. The Company's proprietary incinerator technology destroys noxious or
toxic hydrocarbon gases which ensures regulatory compliance, environmental
protection, public confidence and reduced operating costs for customers. Questor
is recognized for its particular expertise in the combustion of sour gas (H2S).
While the Company's current customer base operates primarily in the oil and gas
industry, this technology is applicable to other industries such as landfills,
water and sewage treatment, tire recycling and agriculture.


Questor trades on the TSX Venture Exchange under the symbol "QST".

Certain information in this news release constitutes forward-looking statements.
When used in this news release, the words "may", "would", "could", "will",
"intend", "plan", "anticipate", "believe", "seek", "propose", "estimate",
"expect", and similar expressions, as they relate to the Company, are intended
to identify forward-looking statements. In particular, this news release
contains forward-looking statements with respect to, among other things,
business objectives, expected growth, results of operations, performance,
business projects and opportunities and financial results. These statements
involve known and unknown risks, uncertainties and other factors that may cause
actual results or events to differ materially from those anticipated in such
forward-looking statements. Such statements reflect the Company's current views
with respect to future events based on certain material factors and assumptions
and are subject to certain risks and uncertainties, including without
limitation, changes in market, competition, governmental or regulatory
developments, general economic conditions and other factors set out in the
Company's public disclosure documents. Many factors could cause the Company's
actual results, performance or achievements to vary from those described in this
news release, including without limitation those listed above. These factors
should not be construed as exhaustive. Should one or more of these risks or
uncertainties materialize, or should assumptions underlying forward-looking
statements prove incorrect, actual results may vary materially from those
described in this news release and such forward-looking statements included in,
or incorporated by reference in this news release, should not be unduly relied
upon. Such statements speak only as of the date of this news release. The
Company does not intend, and does not assume any obligation, to update these
forward-looking statements. The forward-looking statements contained in this
news release are expressly qualified by this cautionary statement.


----------------------------------------------------------------------------
QUESTOR TECHNOLOGY INC.
CONDENSED STATEMENTS OF FINANCIAL POSITION
Stated in Canadian dollars
Unaudited

                                                     March 31    December 31
As at                                                    2013           2012
----------------------------------------------------------------------------

ASSETS
Current assets
 Cash and cash equivalents                        $ 4,827,269    $ 4,405,624
 Trade and other receivables                        2,318,471      2,304,478
 Inventories                                        1,136,229        670,959
 Prepaid expenses and deposits                         66,212         88,378
 Current tax assets                                    48,182         25,158
----------------------------------------------------------------------------
 Total current assets                               8,396,363      7,494,597
----------------------------------------------------------------------------

Non-current assets
 Property and equipment                             2,035,192      2,295,529
 Intangible assets                                      8,018          8,323
----------------------------------------------------------------------------
 Total non-current assets                           2,043,210      2,303,852
----------------------------------------------------------------------------

Total assets                                     $ 10,439,573    $ 9,798,449
----------------------------------------------------------------------------
----------------------------------------------------------------------------

LIABILITIES AND EQUITY
Current liabilities
 Trade payables, accrued liabilities and
  provisions                                        $ 919,535      $ 894,206
 Deferred revenue and deposits                         50,905          2,205
 Current tax liabilities                              273,153        171,907
----------------------------------------------------------------------------
 Total current liabilities                          1,243,593      1,068,318
----------------------------------------------------------------------------

Non-current liabilities
 Deferred tax liabilities                             104,375         97,319
 Lease inducement                                     175,659        152,746
----------------------------------------------------------------------------
 Total non-current liabilities                        280,034        250,065
----------------------------------------------------------------------------
Total liabilities                                   1,523,627      1,318,383
----------------------------------------------------------------------------

Capital and reserves
 Issued capital                                     5,521,001      5,521,001
 Reserves                                             695,630        676,834
 Retained earnings                                  2,699,315      2,282,231
----------------------------------------------------------------------------
 Total equity                                       8,915,946      8,480,066
----------------------------------------------------------------------------

Total liabilities and equity                     $ 10,439,573    $ 9,798,449
----------------------------------------------------------------------------
----------------------------------------------------------------------------
See accompanying notes to the unaudited condensed financial statements.


----------------------------------------------------------------------------
QUESTOR TECHNOLOGY INC.
CONDENSED STATEMENTS OF COMPREHENSIVE INCOME (LOSS)
Stated in Canadian dollars except per share data
Unaudited

For the three months ended March 31                     2013           2012
----------------------------------------------------------------------------

Revenue                                          $ 1,719,577    $ 2,230,875
Cost of sales                                       (829,136)    (1,177,175)
----------------------------------------------------------------------------

Gross profit                                         890,441      1,053,700

Administration expenses                             (353,550)      (353,444)
Net foreign exchange gains (losses)                   44,997        (34,413)
Depreciation of property and equipment               (10,740)       (10,322)
Amortization of intangible assets                       (305)          (305)
Write-off of property and equipment                        -         (2,768)
Other income                                           4,675          4,705
----------------------------------------------------------------------------

Profit before tax                                    575,518        657,153
Income tax expense                                  (158,434)      (169,715)
----------------------------------------------------------------------------

Profit and total comprehensive income              $ 417,084      $ 487,438
----------------------------------------------------------------------------
----------------------------------------------------------------------------

Earnings per share

 Basic                                               $ 0.017        $ 0.020
 Diluted                                             $ 0.017        $ 0.019
----------------------------------------------------------------------------


----------------------------------------------------------------------------
QUESTOR TECHNOLOGY INC.
CONDENSED STATEMENTS OF CHANGES IN EQUITY
Stated in Canadian dollars
Unaudited

                            Issued                    Retained
                           capital      Reserves      earnings  Total equity
----------------------------------------------------------------------------

 Balance at January 1,
  2013                 $ 5,521,001     $ 676,834   $ 2,282,231   $ 8,480,066
 Profit and total
  comprehensive income           -             -       417,084       417,084
 Recognition of share-
  based payments                 -        18,796             -        18,796
 Issue of ordinary
  shares under
  employee share
  option plan                    -             -             -             -
----------------------------------------------------------------------------

 Balance at March 31,
  2013                 $ 5,521,001     $ 695,630   $ 2,699,315   $ 8,915,946
----------------------------------------------------------------------------
----------------------------------------------------------------------------

 Balance at January 1,
  2012                 $ 5,458,215     $ 622,226   $ 1,241,875   $ 7,322,316
 Profit and total
  comprehensive income           -             -       487,438       487,438
 Recognition of share-
  based payments                 -         9,281             -         9,281
 Issue of ordinary
  shares under
  employee share
  option plan                    -             -             -             -
----------------------------------------------------------------------------

 Balance at March 31,
  2012                 $ 5,458,215     $ 631,507   $ 1,729,313   $ 7,819,035
----------------------------------------------------------------------------
----------------------------------------------------------------------------


----------------------------------------------------------------------------
QUESTOR TECHNOLOGY INC.
CONDENSED STATEMENTS OF CASH FLOWS
Stated in Canadian dollars
Unaudited

For the three months ended March 31                      2013          2012
----------------------------------------------------------------------------

Cash flows from operating activities
 Profit and total comprehensive income              $ 417,084     $ 487,438
 Adjustments for:
  Income tax expense                                  158,434       169,715
  Write-off of property and equipment                       -         2,768
  Depreciation of property and equipment               80,397        69,871
  Amortization of intangible assets                       305           305
  Net unrealized foreign exchange (gains) losses      (12,611)       35,607
  Expense recognized in respect of equity-settled
   share-based payments                                18,796         9,281
----------------------------------------------------------------------------
                                                      662,405       774,985
 Movements in non-cash working capital               (156,651)    1,414,553
----------------------------------------------------------------------------
 Cash generated from operations                       505,754     2,189,538
 Income taxes paid                                          -      (280,061)
----------------------------------------------------------------------------
Net cash generated from operating activities          505,754     1,909,477
----------------------------------------------------------------------------

Cash flows used in investing activities
 Payments for property and equipment                  (90,355)     (152,502)
----------------------------------------------------------------------------
Net cash used in investing activities                 (90,355)     (152,502)
----------------------------------------------------------------------------

----------------------------------------------------------------------------
Cash flows from financing activities                        -             -
----------------------------------------------------------------------------

Net increase in cash                                  415,399     1,756,975
Cash at beginning of the period                     4,405,624     2,166,301
Effects of exchange rate changes on the balance of
 cash held in foreign currencies                        6,246       (31,522)
----------------------------------------------------------------------------
Cash at end of the period                         $ 4,827,269   $ 3,891,754
----------------------------------------------------------------------------
----------------------------------------------------------------------------


FOR FURTHER INFORMATION PLEASE CONTACT:
Questor Technology Inc.
Audrey Mascarenhas
President and Chief Executive Officer
(403) 571-1530
(403) 571-1539 (FAX)
amascarenhas@questortech.com
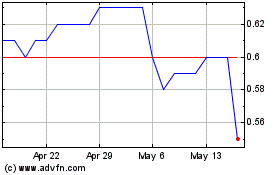
Questor Technology (TSXV:QST)
Historical Stock Chart
From Apr 2024 to May 2024

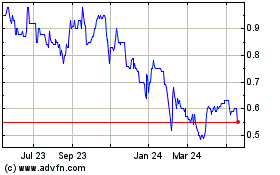
Questor Technology (TSXV:QST)
Historical Stock Chart
From May 2023 to May 2024
