0001823584
false
0001823584
2023-07-14
2023-07-14
0001823584
us-gaap:CommonClassAMember
2023-07-14
2023-07-14
0001823584
AENT:RedeemableWarrantsExercisableForSharesOfClassCommonStockAtExercisePriceOf11.50PerShareMember
2023-07-14
2023-07-14
iso4217:USD
xbrli:shares
iso4217:USD
xbrli:shares
UNITED STATES
SECURITIES AND EXCHANGE COMMISSION
WASHINGTON, D.C. 20549
FORM 8-K
CURRENT REPORT
PURSUANT TO SECTION 13 OR 15(d) OF THE
SECURITIES EXCHANGE ACT OF 1934
Date of Report (Date of earliest event reported):
July 14, 2023
| ALLIANCE ENTERTAINMENT HOLDING CORPORATION |
| (Exact Name of Registrant as Specified in its Charter) |
| Delaware |
|
001-40014 |
|
85-2373325 |
| (State or Other Jurisdiction |
|
(Commission |
|
(IRS Employer |
| of Incorporation) |
|
File Number) |
|
Identification No.) |
8201 Peters Road, Suite
1000
Plantation, FL, 33324
(Address of Principal Executive Offices) (Zip Code)
(954) 255-4000
(Registrant’s Telephone Number, Including
Area Code)
Not Applicable
(Former Name or Former Address, if Changed Since
Last Report)
Check the appropriate box below if the Form 8-K
filing is intended to simultaneously satisfy the filing obligation of the registrant under any of the following provisions:
| ¨ | Written communications pursuant
to Rule 425 under the Securities Act (17 CFR 230.425) |
| ¨ | Soliciting material pursuant to
Rule 14a-12 under the Exchange Act (17 CFR 240.14a-12) |
| ¨ | Pre-commencement communications
pursuant to Rule 14d-2(b) under the Exchange Act (17 CFR 240.14d-2(b)) |
| ¨ | Pre-commencement communications
pursuant to Rule 13e-4(c) under the Exchange Act (17 CFR 240.13e 4(c)) |
Securities registered pursuant to Section 12(b)
of the Act:
| Title of each class |
|
Trading
Symbol(s) |
|
Name of each exchange on
which registered |
| Class A common stock, par value $0.0001 per share |
|
AENT |
|
The Nasdaq Stock Market LLC |
| Redeemable warrants, exercisable for shares of Class A common stock at an exercise price of $11.50 per share |
|
AENTW |
|
The Nasdaq Stock Market LLC |
Indicate by check mark whether the registrant
is an emerging growth company as defined in Rule 405 of the Securities Act of 1933 (§230.405 of this chapter) or Rule 12b-2 of the
Securities Exchange Act of 1934 (§240.12b-2 of this chapter).
Emerging growth company x
If an emerging growth company, indicate by check
mark if the registrant has elected not to use the extended transition period for complying with any new or revised financial accounting
standards provided pursuant to Section 13(a) of the Exchange Act.
| Item 7.01. |
Regulation FD Disclosure. |
An updated version of an investor
presentation of Alliance Entertainment Holding Corporation, a Delaware corporation (the “Company”), is attached as Exhibit
99.1 to this Current Report on Form 8-K. The presentation will be accessible online through the Investor Relations section of the Company’s
website, located at ir.aent.com, under the heading “Latest Presentation.” The information on the Company’s website is
not a part of this Current Report on Form 8-K.
The information set forth
in this Item 7.01, including the exhibit attached hereto, shall not be deemed to be filed for purposes of Section 18 of the Exchange Act,
or otherwise be subject to the liabilities of that section, nor shall they be deemed to be incorporated by reference in any filing under
the Securities Act or the Exchange Act.
Forward-Looking Statements
This
Current Report on Form 8-K includes certain statements that are not historical facts but are forward-looking statements for purposes of
the safe harbor provisions under the United States Private Securities Litigation Reform Act of 1995. These statements are based on various
assumptions, whether or not identified in this Current Report on Form 8-K, and on the current expectations of the Company’s management
and are not predictions of actual performance. Actual events and circumstances are difficult or impossible to predict and will differ
from assumptions. These forward-looking statements are subject to a number of risks and uncertainties, including those factors discussed
in the Company’s Annual Report on Form 10-K filed with the Securities and Exchange Commission (“SEC”) on March 30, 2023
under the heading “Risk Factors,” the Company’s Registration Statement on Form S-1 filed with the SEC on April 10, 2023
under the heading “Risk Factors,” and other documents of the Company filed, or to be filed, with the SEC, which are accessible
through the Investor Relations section of the Company’s website at ir.aent.com. If the risks materialize or assumptions prove incorrect,
actual results could differ materially from the results implied by these forward-looking statements. The Company disclaims any obligation
to update any forward-looking statements.
| Item 9.01. |
Financial Statements and Exhibits. |
SIGNATURE
Pursuant to the
requirements of the Securities Exchange Act of 1934, the registrant has duly caused this report to be signed on its behalf by the undersigned
hereunto duly authorized.
| Dated: July 14, 2023 |
ALLIANCE ENTERTAINMENT HOLDING CORPORATION |
| |
|
| |
By: |
/s/ John Kutch |
| |
|
Name: John Kutch
Title: Chief Financial Officer |
Exhibit 99.1
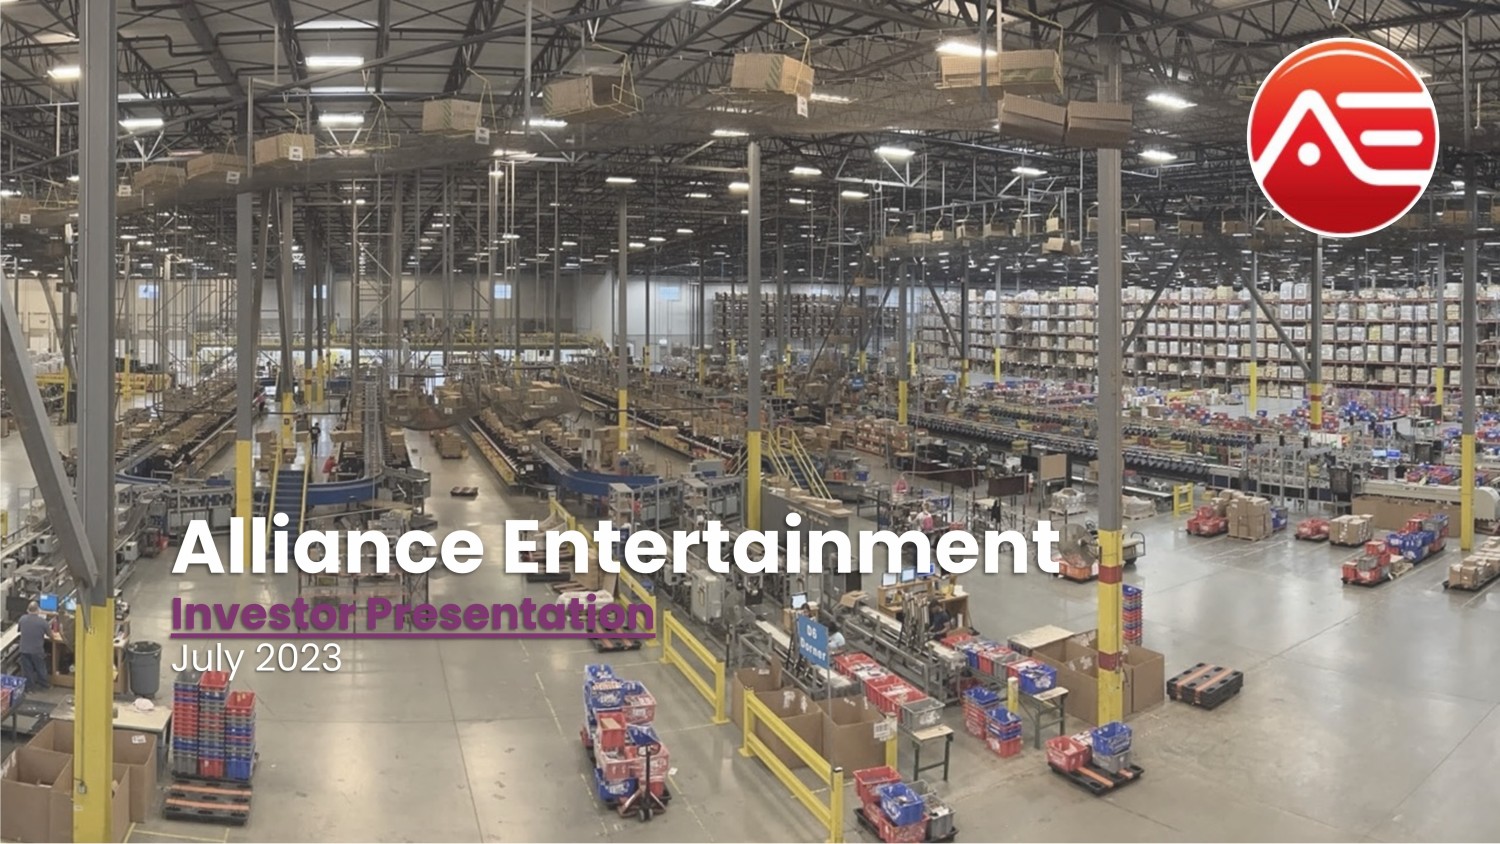
Alliance Entertainment Investor Presentation July 2023

Legal Disclaimer 2 This presentation (together with oral statements made in connection herewith, this “Presentation”) is for informational purposes only . This Presentation shall not constitute an offer to sell, or the solicitation of an offer to buy, any securities, nor shall there be any sale of securities in any states or jurisdictions in which such offer, solicitation or sale would be unlawful . No representations or warranties, express or implied are given in, or in respect of, this Presentation . Although all information and opinions expressed in this Presentation, including industry and market data obtained from third - party industry publications and sources as well as from research reports prepared for other purposes, were obtained from sources believed to be reliable and are included in good faith, Alliance Entertainment Holding Corporation (“Alliance”) has not independently verified the information obtained from these sources and cannot assure you of the information’s accuracy or completeness . This information is subject to change . Some data are also based on the good faith estimates of Alliance, which are derived from their respective views of internal sources as well as the independent sources described above . Nothing herein should be construed as legal, financial, tax or other advice . You should consult your own advisers concerning any legal, financial, tax or other considerations concerning the opportunity described herein . The general explanations included in this Presentation cannot address, and are not intended to address, your specific investment objectives, financial situations or financial needs . Nothing contained herein shall be deemed a recommendation to any party to enter into any transaction or take any course of action . Forward Looking Statements Certain statements included in this Presentation that are not historical facts are forward - looking statements for purposes of the safe harbor provisions under the United States Private Securities Litigation Reform Act of 1995 . Forward - looking statements generally are accompanied by words such as “believe,” “may,” “will,” “estimate,” “continue,” “anticipate,” “intend,” “expect,” “should,” “would,” “plan,” “predict,” “potential,” “seem,” “seek,” “future,” “outlook,” and similar expressions that predict or indicate future events or trends or that are not statements of historical matters . These forward - looking statements include, but are not limited to, statements regarding estimates and forecasts of other financial and performance metrics and projections of market opportunity . These statements are based on various assumptions, whether identified in this Presentation, and on the current expectations of Alliance’s management and are not predictions of actual performance . These forward - looking statements are provided for illustrative purposes only and are not intended to serve as and must not be relied on by an investor as, a guarantee, an assurance, a prediction, or a definitive statement of fact or probability . Actual events and circumstances are difficult or impossible to predict and will differ from assumptions . Many actual events and circumstances are beyond the control of Alliance . These forward - looking statements are subject to a number of risks and uncertainties, including changes in domestic and foreign business, market, financial, political, and legal conditions ; failure to realize the anticipated benefits of the recently completed business combination ; risks related to the rollout of Alliance’s business and the timing of expected business milestones ; the effects of competition on Alliance’s future business ; risks and failure by Alliance to meet the covenant requirements of its revolving credit facility, our ability to issue equity or equity - linked securities or obtain debt financing in the future, and the potential negative effect on the price and liquidity of Alliance’s securities and those factors discussed in Alliance’s Annual Report on Form 10 - K for the year ended December 31 , 2022 and in other fillings with the SEC under the heading “Risk Factors” . Additional risks related to Alliance’s business in particular include, but are not limited to competition, the ability of Alliance to grow and manage growth profitably, the ability of Alliance to maintain relationships with customers and suppliers and retain key employees ; changes in the applicable laws or regulations ; the possibility that Alliance may be adversely affected by other economic, business, a material weakness in Alliance’s internal control over financial reporting, and/or competitive factors ; the impact of the global COVID - 19 pandemic . There may be additional risks and uncertainties that Alliance does not presently know or currently believes are immaterial that could cause actual results to differ from those contained in the forward - looking statements . Such risk factors also include, among others, future growth expectations and acquisitions ; specific economic conditions in the United States ; changes in laws and regulations ; potential liability from future litigation ; the diversion of management time on acquisitions and integration related issues ; modifications or adjustments to Alliance’s financial statements as a result of applicable securities laws ; and general economic conditions . Most of these factors are outside Alliance’s control and are difficult to predict .

Legal Disclaimer - Continued 3 Non - GAAP Financial Measures In addition to financial measures prepared in accordance with United States generally accepted accounting principles (“GAAP”) . s ome of the financial information and data contained in this Presentation, such as Adjusted EBITDA, EBITDA - CapEx and EV/EBITDA, has not been prepared in accordanc e with GAAP. Alliance believes these non - GAAP measures of financial results provide useful informant to management and investors regarding certain financial an d business trends relating to Alliance’s financial condition and results of operations. Alliance’s management uses these non - GAAP measures for trend analyses, for purposes of determining management incentive compensation, and for budgeting and planning purposes. Alliance believes that the use of these non - GAAP financial measures provides an additional tool for investors to use in evaluati ng operating results and trends in and in comparing Alliance’s financial measures with other similar companies, many of which present similar non - GAAP financial me asures to investors. Management does not consider these non - GAAP measures in isolation or as an alternative to financial measures determined in accor dance with GAAP. The principal limitation of these non - GAAP financial measures is that they exclude significant expenses and income that are required by GAAP to be recorded in Alliance’s financial statements. In addition, they are subject to inherent limitations as they reflect the exercise of judgme nts by management about which expense and income are excluded or included in determining these non - GAAP financial measures. Accordingly, our Adjusted EBITDA may not be comparable to similarly titled measures of other companies, including companies in our industry, because other companies may calculate Adjusted EBITD A i n a different manner than we calculate this measure. In order to compensate for these limitations, management presents non - GAAP financial measures in connec tion with GAAP results. In evaluating Adjusted EBITDA and EBITDA, you should be aware that in the future we may or may not incur expenses similar to som e o f the adjustments we have reported. Our presentation of Adjusted EBITDA and EBITDA does not imply that our future results will be unaffected by these adj ustments or any unusual or non - recurring items. You should review Alliance’s audited financial statements, which have been included in the Annual Report on Form 10 - K for the year ended December 31, 2022 . Trademarks This Presentation contains trademarks, service marks, trade names, and copyrights of Alliance, and other companies, which are th e property of their respective owners. The use or display of third parties’ trademarks, service marks, trade name or products in this Presentation is not in ten ded to, and does not imply, a relationship with Alliance, or an endorsement of sponsorship by or of Alliance. Solely for convenience, the trademarks, servi ce marks and trade names referred to in this Presentation may appear with the ®, TM or SM symbols, but such references are not intended to indicate, in any way, that Al liance will not assert, to the fullest extent under applicable law, their rights or the right of the applicable licensor to these trademarks, service marks and trad e n ames. The information contained herein is as of July 14, 2023, and does not reflect any subsequent events.

Corporate Overview Alliance Entertainment is a premier distributor of music, movies, video games and consumer electronics 4 • Alliance Entertainment was initially capitalized with less than $200,000 and is now a worldwide distributor and retailer of physical exclusive and non - exclusive media of the biggest brands in the entertainment business without raising equity from outside investors • Trusted supplier for Walmart and a trusted omni channel supplier to Amazon, Best Buy, Costco, Target, Kohl’s, BJ’s, Meijer, and Barnes & Noble. • Trusted distributor for Disney, Paramount, Sony, Warner, Universal, Microsoft, Nintendo, Activision, Electronic Arts, Mattel, Hasbro, Funko, and others. • Alliance Entertainment has grown to over $1.4 billion in annual revenue (FYE 6/30/22) and employs over 1,000 team members, ships to over 35,000 storefronts and distributes over 425,000 in stock SKUs to the largest retailers in the world • Continued growth and acquisitions to expand selection and gain market share, enter new markets and continue diversification while maintaining fiscal responsibility • Exclusive Physical Distributor of Music and Video through our Amped (Music) and Distribution Solutions (Video) divisions with a growing $200M of our $1.2B annual revenue in exclusive distribution or licensing future physical media content to grow market share. “Our vision is simple: be the best in class with service, selection and technology. By being the leader, that will create more growth and opportunities for our vendors, customers, and Alliance.”

Direct - to - Consumer (DTC) & eCommerce Alliance is a leading Direct - to - Consumer (DTC) and eCommerce provider for the entertainment industry We are the gateway between brands and retailers 5

Growth History 2013 Music & Video Distribution • Super D acquires Alliance Entertainment becoming the largest music and video distributor • The first major step in consolidating the 3 main packaged media categories. Super D rebrands to Alliance Entertainment post acquisition 2016 Music & VMI • AN Connect Acquisition • Walmart & Best Buy accounts added • Vendor Managed Inventory system and software systems acquired, providing Alliance with a critical addition to its service offering 2018 Gaming • Mecca Acquisition • Microsoft, Sony, and Nintendo suppliers added • Alliance enters the gaming space, expanding its already diverse physical media product offering 2018 Video Exclusive Distribution • Distribution Solutions Acquisition • Walmart, Amazon, Target, and Best Buy Video Movie Supplier Numbers added • 20 exclusive video distribution studios acquired 2020 Gaming • COKeM Acquisition • Walmart, Best Buy, Target, GameStop, Kohls, and Costco accounts added • Alliances adds the leading gaming distributor with significant store and DTC sales 2022 Toys & Collectibles • Think 3Fold Acquisition • Walmart expansion • Alliance adds collectible toys with 4 feet of shelf space in 3,900 Walmart stores 2023 Public Listing • Alliance consummates merger with Adara Acquisition Corp. to become a publicly traded company • Reports highest physical vinyl album sales for record store day event • Amped distribution celebrates 10 years of business with impressive wins at the 2023 Grammy Œ and Billboard Œ charts dominance • New Home Entertainment Licensing Agreement with The Walt Disney Company 6

SERVICE Product and eCommerce distribution and inventory solutions TECHNOLOGY State - of - the art systems and facilities SELECTION One of the largest physical media and entertainment product distributors Alliance provides traditional retailers with world class eCommerce abilities, leveling the playing field Alliance has specialized in providing superior: 7

MERCHANDISING SERVICES & IN - STORE OPERATIONS INVENTORY & PRODUCT PLACEMENT OMNI - CHANNEL STRATEGY SUPPORT AUTOMATED DTC PROCESS INVENTORY & CATEGORY MANAGEMENT SYSTEMS Alliance provides efficient, Omni - Channel expansion solutions for retailers eCommerce & DTC Vendor Managed Inventory Alliance provides a full, enterprise - level infrastructure and drop ships orders directly to consumers on behalf of its customers . The entire ordering, confirmation and invoicing process is automated . The functionality allows customers to focus on sales while Alliance performs all stocking, warehousing and shipping functions . END - TO - END ECOMMERCE SOLUTION Alliance is a leader in vendor managed inventory solutions providing solutions tailored to customers to support their inventory needs . These value - add services provide a highly technical, critical business function for partners . Service 8

Alliance consolidates and distributes a vast portfolio of entertainment products, while its proprietary database powers retailers’ online music and gaming offerings Gaming Products DVD & Blu - Ray CD Consumer Products Currently over 425,000 SKUs in stock Selection Vinyl Retro Arcades 9

AutoStore Automated Storage & Retrieval System Alliance completed installing an AutoStore Automated Storage & Retrieval System for its Shepherdsville warehouse as of January 2023 . This system has improved Alliance’s warehouse operations, allowing the Company to achieve increased levels of speed, reliability, capacity, and precision, resulting in significant cost savings. With a 22,200 sqft. footprint and 52,325 total bins, the AutoStore system can hold up to 66 lbs. of product per bin. Each bin allows for up to 8 unique SKUs. Working in combination with current pallet picking and case picking out of the warehouse’s mezzanine, the AutoStore system has a pick rate of 2,000 lines per hour across 7 picking ports. Increased Storage Capacity 24/7 Access Improved Energy Efficiency Significant Cost Savings Alliance is investing in enhancements to its automated handling equipment capable of reducing shipping times, streamlining order processing, and improving overall warehouse management . Technology Click Icon Below For Video 10 Installing Of AutoStore in KY Sortation of Vinyl on 1 of 6 sorters Manufacture on Demand MOD

Shakopee, MN 220K Sqft Facility Shepherdsville, KY 873K Sqft Facility Distribution Center • Shepherdsville, KY • Shakopee, MN • Dallas, TX • Los Angeles, CA • Charlotte, NC Offices • Bentonville, AR • Itasca, IL • Irvine, CA • Sacramento, CA • EI Segundo, CA • Minneapolis, MN • Shepherdsville, KY • Sunrise, FL Strategically Located Operations Through its highly skilled workforce and tech enabled facilities, Alliance has established a strong fulfillment and distribution infrastructure that allows Alliance to achieve industry leading speed and accuracy metrics. Click Icons for Videos 11

FY19 FY20 FY21 FY22 9 Months Ended 03-31-2023 2 FY19 FY20 FY21 FY22 9 Months Ended 03-31-2023 $(21) REVENUE ($ in millions, Fiscal Year Ended 6/30) ADJUSTED EBITDA ($ in millions, Fiscal Year Ended 6/30) $747 $776 $1,324 $1,417 $25 $33 $69 $60 ADJUSTED EBITDA MARGIN 3.3% 4.2% 5.2% 4.2% Financial Summary REVENUES $1.4 BILLION FY 2022 Alliance has grown revenues by expanding its customer base and product offering, and through several successful acquisitions. STRONG EBITDA PROFILE $60+ MILLION ADJUSTED EBITDA FY 2022 Alliance has driven margin expansion since inception through effective cost control measures and successful acquisition integrations. MATURE REVENUE BASE FORTUNE 100 CUSTOMERS Alliance has developed years - long relationships as the gateway between the world’s biggest brands in the entertainment business, including Microsoft, Sony Pictures, The Walt Disney Studios, Universal Music Group and Warner Bros., and a strong customer base that includes Fortune 100 retailers such as Amazon, Best Buy, Costco, Target and Walmart. LEADER IN THE SPACE INTERNATIONAL FOOTPRINT Alliance is a premier international distributor of music, movies, video games and consumer electronics, ships to over 35,000 storefronts and distributes over 425,000 in stock SKUs across North America to the largest retailers in the world. 1. A reconciliation of Adjusted EBITDA to GAAP Net Income is provided on Exhibit 1. 2. Adjusted EBITDA for the 9 months ended March 31, 2023, includes excessive transportation costs, markdowns and other arcade related costs of $35.1M outlined on slide 18. 1 12 - 2.3% $912

9 Months Ended Fiscal Year 03 - 31 - 2023 06 - 30 - 2022 06 - 30 - 2021 06 - 30 - 2020 06 - 30 - 2019 Revenue $911,590 $1,417,377 $1,323,567 $775,596 $746,529 YoY Revenue Growth % 7.1% 70.7% 3.9% Cost of Goods Sold 837,897 1,234,995 1,140,885 656,485 637,970 Gross Profit $73,691 $182,382 $182,682 $119,111 $108,559 Gross Profit % 8.1% 12.9% 13.8% 15.4% 14.5% Operating Expenses: Distribution and Fulfilment Expense 50,153 64,260 56,885 35,877 37,121 Selling, General and Administrative 44,559 58,110 57,249 50,007 46,929 Total Operating Expenses 94,712 122,370 114,134 85,884 84,050 10.4% 8.6% 8.6% 11.1% 11.3% Non - Operating Expenses: Depreciation 1,803 3,097 5,623 7,124 6,232 Amortization 3,042 5,162 5,772 8,660 7,851 Interest Expense 9,105 4,056 2,938 3,524 6,850 IC - DISC Commissions 2,833 9,907 5,394 8,182 7,050 Income Taxes (Benefits) (11,380) 9,423 10,791 376 2,415 Gain/Loss on Disposal of PPE (3) - 87 - - Mergers & Acquisition Fees 4,355 (251) 3,509 - 4 Total Non - Operating Expenses 9,755 31,394 34,370 27,866 30,402 1.1% 2.2% 2.6% 3.6% 4.1% Adjusted EBITDA $(21,019) $60,018 $68,564 $32,909 $24,541 Adjusted EBITDA % - 2.3% 4.2% 5.2% 4.2% 3.3% Adjusted EBITDA for the nine months ended March 31, 2023, includes the following costs: Excessive International Transportation Costs (Units Sold) 8,241 Excessive International Transportation Costs (On Hand) 7,100 Markdown for Arcades Sold 12,156 Incremental Storage Fees Arcades 3,950 Consumer Products Inventory Reserve 3,700 Total $35,147 13 Income Statement ($ in 000’s) 1. A reconciliation of Adjusted EBITDA to GAAP Net Income is provided on Exhibit 1. 1

Unaudited As of 03 - 31 - 2023 Audited As of 06 - 30 - 2022 Audited As of 06 - 30 - 2021 ASSETS Cash and Equivalents. 1,034 1,469 4,028 Accounts Receivable - Trade 79,445 98,699 111,332 Inventory 163,057 249,439 141,661 Other Current Assets 7,852 9,373 8,763 Net PP&E & Operating Lease Right - OF - Use Assets 18,759 11,644 18,988 Net Intangible Assets 24,754 18,764 23,927 Net Goodwill 87,151 79,903 79,903 Total Other Assets 6,174 3,748 361 Total Assets $388,225 $473,039 $388,963 LIABILITIES Accounts Payable & Accrued Expenses 159,585 209,760 227,887 Line of Credit 127,343 135,968 53,580 Other Current Liabilities 6,616 4,871 10,719 Non - Current Liabilities 10,722 13,512 16,475 Total Liabilities 304,266 364,111 308,661 EQUITY 83,959 108,928 80,302 Total Liabilities and Equity $388,225 $473,039 $388,963 ($ in 000’s) Balance Sheet 14

Sales by Configuration 15 (In Thousands) Sales by Configuration 9 Months Ended 03 - 31 - 2023 Fiscal Year Ended 06 - 30 - 2022 Fiscal Year Ended 06 - 30 - 2021 Fiscal Year Ended 06 - 30 - 2020 Gaming $333,046 36.5% $557,658 39.3% $497,817 37.6% $108,735 14.0% Vinyl $241,518 26.5% $329,202 23.2% $288,326 21.8% $158,633 20.5% DVD/Blu - ray/UltraHD $ 145,900 16.1% $272,921 19.3% $300,522 22.7% $283,371 36.5% CD $91,476 10.0% $151,583 10.7% $148,263 11.2% $164,728 21.2% Collectibles & Consumer Products $64,872 7.1% $57,980 4.1% $40,729 3.1% $17,591 2.3% Freight $16,501 1.8% $21,682 1.5% $22,260 1.7% $19,138 2.5% Exclusive Distribution Fees $11,900 1.3% $17,874 1.3% $17,460 1.3% $17,430 2.2% Digital Delivery $6,378 0.7% $8,476 0.6% $8,191 0.6% $5,967 0.8% Grand Total $911,590 100.0% $1,417,377 100.0% $1,323,567 100.0% $775,596 100.0% $- $50,000 $100,000 $150,000 $200,000 $250,000 $300,000 $350,000 $400,000 $450,000 $500,000 $550,000 $600,000 9 Months Ended 03-31-2023 Fiscal Year Ended 06-30-2022 Fiscal Year Ended 06-30-2021 Fiscal Year Ended 03-30-2020 In Thousands Gaming Vinyl DVD/Blu-ray/UltraHD CD Collectibles & Consumer Products Freight Exclusive Distribution Fees Digital Delivery The Global Brand Licensing Market is projected to grow from USD 274.9 billion in 2022 to USD 385.4 billion by 2027 at a CAGR value of 4.1% from 2022 to 2027. The global vinyl records market size is estimated to grow by USD 663.77 million from 2022 to 2027, according to Technavio.
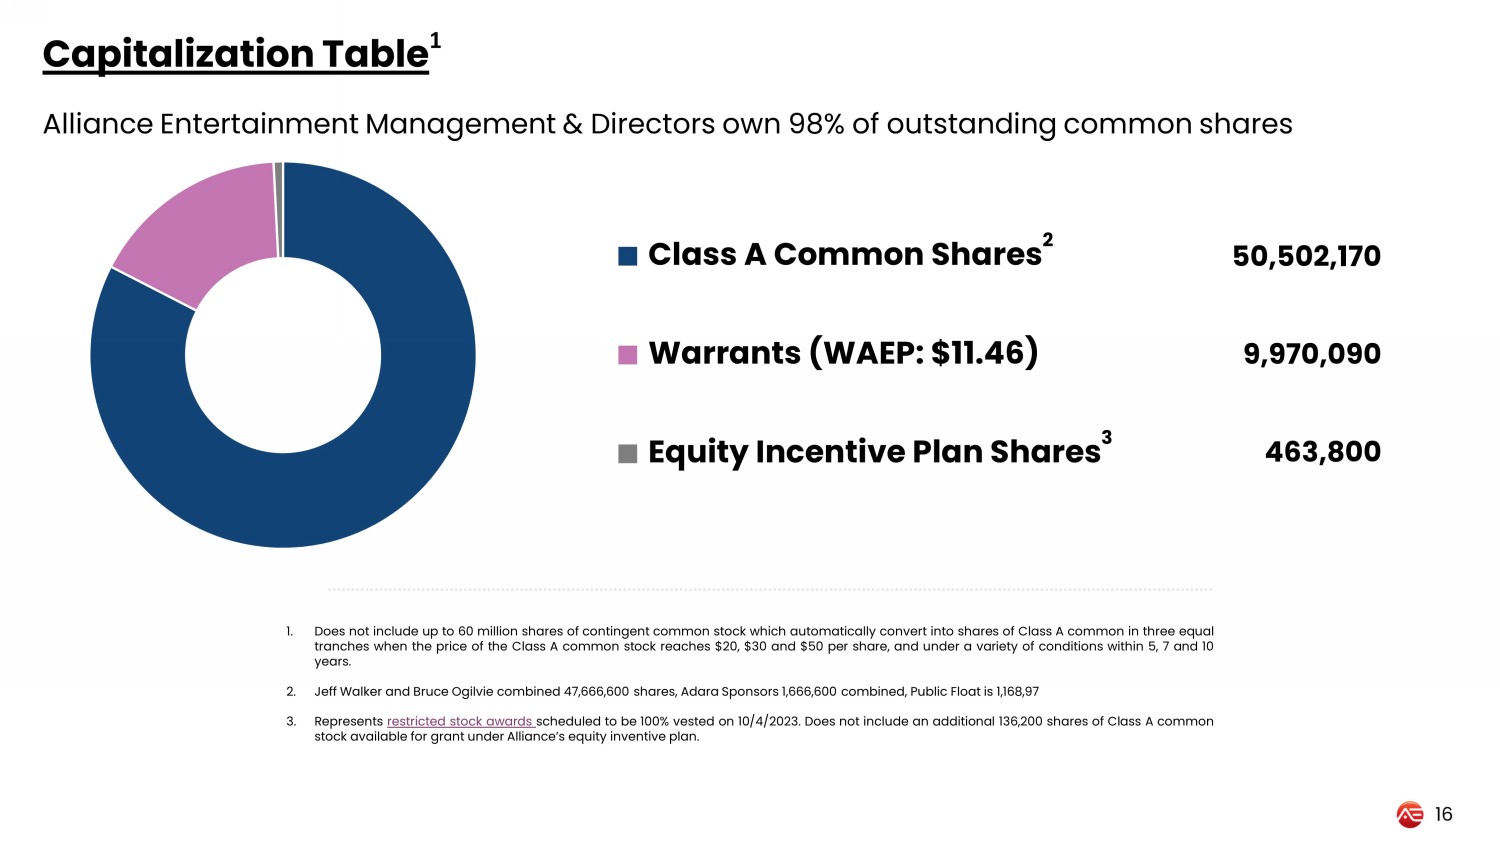
463,800 Capitalization Table 1 Alliance Entertainment Management & Directors own 98% of outstanding common shares 16 Class A Common Shares Warrants (WAEP: $11.46) Equity Incentive Plan Shares 3 50,502,170 9,970,090 1. Does not include up to 60 million shares of contingent common stock which automatically convert into shares of Class A common in three equal tranches when the price of the Class A common stock reaches $ 20 , $ 30 and $ 50 per share, and under a variety of conditions within 5 , 7 and 10 years . 2. Jeff Walker and Bruce Ogilvie combined 47 , 666 , 600 shares, Adara Sponsors 1 , 666 , 600 combined, Public Float is 1 , 168 , 97 3. Represents restricted stock awards scheduled to be 100 % vested on 10 / 4 / 2023 . Does not include an additional 136 , 200 shares of Class A common stock available for grant under Alliance’s equity inventive plan . 2

BRUCE OGILVIE Executive Chairman Bruce has spent his entire career in the entertainment distribution industry starting with the founding of Abbey Road Distributors in 1980 . Over the next 14 years, Bruce led Abbey Road’s growth to over $ 94 million in sales and successfully sold the business in 1994 . In 1995 , Bruce was awarded E&Y’s Distribution Entrepreneur of the Year Award for his work with Abbey Road . Armed with start - up experience, a successful exit, and street - level distribution knowledge, in 1996 , Bruce was selected by a bank group to turn around the 600 - store chain, Wherehouse Records . Under Bruce’s leadership Wherehouse emerged from bankruptcy within nine months and was sold to Cerberus Capital . Following his success with Wherehouse Records, Bruce bought a one - third interest in Super D in 2001 and assumed the role as CEO, joining with founders Jeff Walker and David Hurwitz . Bruce became the Chairman in 2013 after the merger of Super D and Alliance Entertainment . Tom Finke Director, Chair of Compensation, Audit, and Nominating and Corporate Governance Committees Tom has served as a director of Invesco Ltd . (NYSE : IVZ) since December 3 , 2020 . Mr . Finke served as Chairman of Adara Acquisition Corp . from its inception in August 2020 and as its Chief Executive Officer from June 2022 , in each case until its business combination with Alliance . Prior to joining the Board of Invesco, Mr . Finke was the Chairman and CEO of Barings LLC from 2016 - 2020 , and Chairman and CEO of Babson Capital Management, LLC from 2008 - 2016 . Mr . Finke also served as the Executive Vice President and Chief Investment Officer of MassMutual Life from 2008 - 2011 . Mr . Finke earned a Master of Business Administration degree from Duke University’s Fuqua School of Business in 1991 , and a Bachelor’s of Science degree from the University of Virginia’s McIntire School of Commerce in 1986 . In addition to his distinguished professional career, Mr . Finke is a Trustee of Davidson College, a member of the Board of Visitors of the Fuqua School of Business, Chairman of the Board of Charlotte Center City Partners, a member of the Board of Directors of the National Math & Science Initiative, and a member of the Investment Committee of the Roman Catholic Diocese of Charlotte . Alliance Leadership Team 17 JEFF WALKER Chief Executive Officer, Director After earning a degree in Economics from UC Irvine, Jeff Walker and David Hurwitz founded the CD Listening Bar in 1990 , a retail music store . A few years later, Jeff and David started wholesaling CDs from the back of the store, beginning the journey to create Super D , a music wholesaler founded in 1995 . In 2001 , Jeff and David Hurwitz sold a third of Super D to Bruce Ogilvie . Over the next decade, Bruce and Jeff continued to grow Super D’s presence in the music wholesaling space, culminating with the acquisition of Alliance Entertainment in 2013 . Upon the closing of the Alliance acquisition, Jeff became the CEO of the combined company . In 2015 , Jeff was awarded E&Y’s Distribution Entrepreneur of the Year award in Orange County . Tom Donaldson Director, Compensation, Audit, and Nominating and Corporate Governance Committees Tom is the Founder and Managing Partner of Blystone & Donaldson , a Charlotte, NC - based investment firm that focuses on middle - market companies . Mr . Donaldson was a director of Adara Acquisition Corp . from its inception in August 2020 through its business combination in February 2023 . Prior to Blystone & Donaldson, Mr . Donaldson served as an executive at Investors Management Corporation (“IMC”) where he focused on investment decisions, managing risk and developing relationships with companies of interest . Prior to IMC, he served as a Partner of Morehead Capital Management, LLC (“Morehead”) before it was merged into IMC in 2016 . Prior to Morehead, he practiced law as an associate and then a Partner at McGuireWoods LLP where he represented private funds and their portfolio companies in corporate governance, structuring and financing transactions and operating businesses in a wide variety of industries . Mr . Donaldson received his Master of Business Administration degree and Juris Doctor degree from Villanova University . He earned his undergraduate degree in Political Science from North Carolina State University . Teri Wielenga Director, Chair of Audit Committee Teri is a senior global finance executive, board director, and advisor with more than 30 years of experience at complex, highly regulated Fortune 500 companies and a Big Four accounting firm . She has led global tax policy and strategy for Gilead Sciences (Nasdaq : GILD) . She currently serves as board director, secretary, treasurer for The Gilead Foundation, and also currently serves as audit committee chair for the Arc Research Institute . Teri managed rapid global growth as the Senior Vice President of Tax for Allergan (NYSE : AGN) . She also previously served as board director, chief financial officer of the Allergan Foundation and served as a board director for multiple Allergan subsidiaries in Ireland, Japan, and Bermuda . Chris Nagelson Director, Compensation, and Nominating and Corporate Governance Committees Chris was the Vice President, DMM for Walmart, Inc . in Bentonville, AR . During that period, he was responsible for providing the strategic direction for the department that delivered market share growth as well as supported the overall corporate strategy . Chris also identified and established key performance indicators to improve team efficiencies and sales strategies and led a broad, cross - functional team in strategic executive - level planning . From June 1997 to February 2005 , Chris was the Divisional Merchandise Manager for American Eagle Outfitters, Inc . , based in Pittsburgh, PA . John Kutch CFO, Director John been Alliance’s Chief Financial Officer since February 2018 . From October 2014 to March 2017 , John was Vice President of Finance — US Operations for Metalsa , a metals supplier to the automotive manufacturing industry . For the ten years prior, he was employed by Amazon as a Senior Manager — Senior Regional Controller . John received a bachelor’s degree from Washington State University majoring in Management Information Systems, and a Master of Business Administration from Carnegie Mellon University — Tepper School of Business . Senior Management : Board of Directors :

Alliance Strategic Priorities INCREASE MARKET SHARE Expanding its existing product and service offerings and executing its acquisition strategy will drive Alliance’s efforts toward increasing market share. ENHANCE DTC RELATIONSHIPS & CAPABILITIES Alliance’s DTC services are in greater demand as consumer preferences shift and stress retailers' eCommerce and DTC capabilities. Enhancing DTC relationships will grow existing revenue lines and improving capabilities will generate a more attractive overall service offering. EXECUTE ACQUISITION STRATEGY Alliance has a proven track record of successfully acquiring and integrating competitors and complementary businesses. Executive Chairman Bruce Ogilvie and Chief Executive Officer Jeff Walker have acquired over a dozen companies in the last 20 years including Alliance Entertainment, AN Connect, Mecca Electronics, Distribution Solutions, CokeM, and Think3Fold. EXPAND INTO NEW CONSUMER PRODUCTS Leveraging existing relationships, Alliance can expand into new consumer product segments, growing its product offering and providing more to its existing customer base while attracting new customers in the process. TECHNOLOGICAL ADVANCEMENT Alliance will further invest in automating facilities and upgrading proprietary software. 18

Investment Highlights 19 Alliance Entertainment is a leading global wholesaler, direct - to - consumer distributor and e - commerce provider for the entertainment industry • Proven Management Experience and Equity Ownership. With over 30 years of operations and experience, Alliance management Team has extensive knowledge to lead the Company towards future growth. Management owns 97% of common shares outstanding. • Significant barriers to entry and market leadership. We are a leader in fulfillment and e - commerce distribution, with over 425,000 SKUs in stock, protected by a three - pronged moat of services, selection, and technology. Suppliers and retailer customers rely on the Company’s platforms to fuel transaction volume for sticky relationships. • Organic Growth Opportunities. Through the expansion of partnerships with vendors and customers as well as investment in existing facilities, Alliance expects to continue to grow revenue and expand margins. • Proven track record of M&A. Successfully acquired and integrated nine businesses. Significant consolidation opportunities to drive future growth through the acquisition of complementary businesses and competitors. • Modern technology distribution platform and interface. The Company’s technology platform increases the efficiency of transactions, provides great mobile accessibility, and incorporates modern marketing and Fintech tools.

Appendix 20

Exhibit 1 Reconciliation of Adjusted EBITDA to GAAP Net Income 9 Months Ended Fiscal Year 03 - 31 - 2023 06 - 30 - 2022 06 - 30 - 2021 06 - 30 - 2020 06 - 30 - 2019 Operating Earnings Before Depreciation, Amortization & Arcade Adjustment $(21,019) $60,012 $68,548 $33,227 $24,509 Net Income/(Loss) Per GAAP $(30,774) $28,619 $34,178 $5,361 $(5,894) Adj. EBITDA Calculation: Net Income/Loss per GAAP (30,774) 28,619 34,178 5,361 (5,894) Depreciation 1,802 3,097 5,623 7,124 6,232 Amortization 3,042 5,162 6,028 8,660 7,851 Interest Expense 9,105 4,056 2,938 3,524 6,850 IC - DISC Commissions 2,833 9,907 5,394 8,182 7,050 Income Taxes (Benefits) (11,380) 9,423 10,791 376 2,415 Gain/Loss Disposal of PPE & FX Currency (3) 7 102 (318) 33 Mergers & Acquisition Fees 4,355 (251) 3,509 - 4 Adjusted EBITDA $(21,019) $60,018 $68,564 $32,909 $24,541 Adjusted EBITDA % - 2.3% 4.2% 5.2% 4.2% 3.3% Adjusted EBITDA for the nine months ended March 31, 2023, includes the following costs: Excessive International Transportation Costs (Units Sold) 8,241 Excessive International Transportation Costs (On Hand) 7,100 Markdown for Arcades Sold 12,156 Incremental Storage Fees Arcades 3,950 Consumer Products Inventory Reserve 3,700 Total 35,147 21 ($ in 000’s )

9 Months Ended 03 - 31 - 2023 Year Ended 6 - 30 - 2022 Year Ended 6 - 30 - 2021 Year Ended 6 - 30 - 2020 Year Ended 6 - 30 - 2019 Cash Flows from Operating Activities Net Income (Loss) $(30,774) $28,619 $34,178 $5,361 $(5,894) Adjustments to Reconcile Net Income Net Cash provided by (Used In) Operating Activities Inventory Write - Down 10,800 - - - - Depreciation of Property and Equipment 1,804 3,096 5,623 7,124 6,232 Amortization of Intangible Assets 3,041 5,162 5,772 8,660 7,851 Amortization of Deferred Financing Costs (Included in Interest) 125 166 334 358 358 Payment - in - Kind, Interest - - - - 2,600 Bad Debt Expense 330 496 225 155 (188) Deferred Income Taxes - (1,177) 1,543 1,286 2,195 (Gain) Loss on Disposal of Fixed Assets (3) - 87 - - Changes in Assets and Liabilities, Net of Acquisitions Trade Receivables 22,213 12,138 8,053 13,684 (8,988) Related Party Receivable 245 1,231 157 (1,633) - Inventory 80,014 (107,778) (8,617) 35,821 2,989 Income Taxes Payable/Receivable (11,960) (1,867) 4,453 (1,187) 1,733 Operating Lease Right - Of - Use Assets 867 4,299 (817) 3,137 (14,979) Operating Lease Obligations (969) (4,583) 664 (3,284) 16,518 Other Assets 5,606 (5,230) 1,980 3,228 1,087 Accounts Payable (73,313) (16,146) 18,686 (38,761) (14,136) Accrued Expenses (512) (1,980) 2,395 (6,560) (2,602) Net Cash Provided by (Used in) Operating Activities $8,314 $(83,554) $74,718 $27,391 $(5,224) Exhibit 2 Consolidated Statement of Cash Flows ($ in 000’s ) 22
v3.23.2
Cover
|
Jul. 14, 2023 |
| Document Information [Line Items] |
|
| Document Type |
8-K
|
| Amendment Flag |
false
|
| Document Period End Date |
Jul. 14, 2023
|
| Entity File Number |
001-40014
|
| Entity Registrant Name |
ALLIANCE ENTERTAINMENT HOLDING CORPORATION
|
| Entity Central Index Key |
0001823584
|
| Entity Tax Identification Number |
85-2373325
|
| Entity Incorporation, State or Country Code |
DE
|
| Entity Address, Address Line One |
8201 Peters Road
|
| Entity Address, Address Line Two |
Suite
1000
|
| Entity Address, City or Town |
Plantation
|
| Entity Address, State or Province |
FL
|
| Entity Address, Postal Zip Code |
33324
|
| City Area Code |
954
|
| Local Phone Number |
255-4000
|
| Written Communications |
false
|
| Soliciting Material |
false
|
| Pre-commencement Tender Offer |
false
|
| Pre-commencement Issuer Tender Offer |
false
|
| Entity Emerging Growth Company |
true
|
| Elected Not To Use the Extended Transition Period |
false
|
| Common Class A [Member] |
|
| Document Information [Line Items] |
|
| Title of 12(b) Security |
Class A common stock, par value $0.0001 per share
|
| Trading Symbol |
AENT
|
| Security Exchange Name |
NASDAQ
|
| Redeemable warrants, exercisable for shares of Class A common stock at an exercise price of $11.50 per share [Member] |
|
| Document Information [Line Items] |
|
| Title of 12(b) Security |
Redeemable warrants, exercisable for shares of Class A common stock at an exercise price of $11.50 per share
|
| Trading Symbol |
AENTW
|
| Security Exchange Name |
NASDAQ
|
| X |
- DefinitionBoolean flag that is true when the XBRL content amends previously-filed or accepted submission.
| Name: |
dei_AmendmentFlag |
| Namespace Prefix: |
dei_ |
| Data Type: |
xbrli:booleanItemType |
| Balance Type: |
na |
| Period Type: |
duration |
|
| X |
- DefinitionFor the EDGAR submission types of Form 8-K: the date of the report, the date of the earliest event reported; for the EDGAR submission types of Form N-1A: the filing date; for all other submission types: the end of the reporting or transition period. The format of the date is YYYY-MM-DD.
| Name: |
dei_DocumentPeriodEndDate |
| Namespace Prefix: |
dei_ |
| Data Type: |
xbrli:dateItemType |
| Balance Type: |
na |
| Period Type: |
duration |
|
| X |
- DefinitionThe type of document being provided (such as 10-K, 10-Q, 485BPOS, etc). The document type is limited to the same value as the supporting SEC submission type, or the word 'Other'.
| Name: |
dei_DocumentType |
| Namespace Prefix: |
dei_ |
| Data Type: |
dei:submissionTypeItemType |
| Balance Type: |
na |
| Period Type: |
duration |
|
| X |
- DefinitionAddress Line 1 such as Attn, Building Name, Street Name
| Name: |
dei_EntityAddressAddressLine1 |
| Namespace Prefix: |
dei_ |
| Data Type: |
xbrli:normalizedStringItemType |
| Balance Type: |
na |
| Period Type: |
duration |
|
| X |
- DefinitionAddress Line 2 such as Street or Suite number
| Name: |
dei_EntityAddressAddressLine2 |
| Namespace Prefix: |
dei_ |
| Data Type: |
xbrli:normalizedStringItemType |
| Balance Type: |
na |
| Period Type: |
duration |
|
| X |
- Definition
+ References
+ Details
| Name: |
dei_EntityAddressCityOrTown |
| Namespace Prefix: |
dei_ |
| Data Type: |
xbrli:normalizedStringItemType |
| Balance Type: |
na |
| Period Type: |
duration |
|
| X |
- DefinitionCode for the postal or zip code
| Name: |
dei_EntityAddressPostalZipCode |
| Namespace Prefix: |
dei_ |
| Data Type: |
xbrli:normalizedStringItemType |
| Balance Type: |
na |
| Period Type: |
duration |
|
| X |
- DefinitionName of the state or province.
| Name: |
dei_EntityAddressStateOrProvince |
| Namespace Prefix: |
dei_ |
| Data Type: |
dei:stateOrProvinceItemType |
| Balance Type: |
na |
| Period Type: |
duration |
|
| X |
- DefinitionA unique 10-digit SEC-issued value to identify entities that have filed disclosures with the SEC. It is commonly abbreviated as CIK. Reference 1: http://www.xbrl.org/2003/role/presentationRef
-Publisher SEC
-Name Exchange Act
-Number 240
-Section 12
-Subsection b-2
| Name: |
dei_EntityCentralIndexKey |
| Namespace Prefix: |
dei_ |
| Data Type: |
dei:centralIndexKeyItemType |
| Balance Type: |
na |
| Period Type: |
duration |
|
| X |
- DefinitionIndicate if registrant meets the emerging growth company criteria. Reference 1: http://www.xbrl.org/2003/role/presentationRef
-Publisher SEC
-Name Exchange Act
-Number 240
-Section 12
-Subsection b-2
| Name: |
dei_EntityEmergingGrowthCompany |
| Namespace Prefix: |
dei_ |
| Data Type: |
xbrli:booleanItemType |
| Balance Type: |
na |
| Period Type: |
duration |
|
| X |
- DefinitionCommission file number. The field allows up to 17 characters. The prefix may contain 1-3 digits, the sequence number may contain 1-8 digits, the optional suffix may contain 1-4 characters, and the fields are separated with a hyphen.
| Name: |
dei_EntityFileNumber |
| Namespace Prefix: |
dei_ |
| Data Type: |
dei:fileNumberItemType |
| Balance Type: |
na |
| Period Type: |
duration |
|
| X |
- DefinitionTwo-character EDGAR code representing the state or country of incorporation.
| Name: |
dei_EntityIncorporationStateCountryCode |
| Namespace Prefix: |
dei_ |
| Data Type: |
dei:edgarStateCountryItemType |
| Balance Type: |
na |
| Period Type: |
duration |
|
| X |
- DefinitionThe exact name of the entity filing the report as specified in its charter, which is required by forms filed with the SEC. Reference 1: http://www.xbrl.org/2003/role/presentationRef
-Publisher SEC
-Name Exchange Act
-Number 240
-Section 12
-Subsection b-2
| Name: |
dei_EntityRegistrantName |
| Namespace Prefix: |
dei_ |
| Data Type: |
xbrli:normalizedStringItemType |
| Balance Type: |
na |
| Period Type: |
duration |
|
| X |
- DefinitionThe Tax Identification Number (TIN), also known as an Employer Identification Number (EIN), is a unique 9-digit value assigned by the IRS. Reference 1: http://www.xbrl.org/2003/role/presentationRef
-Publisher SEC
-Name Exchange Act
-Number 240
-Section 12
-Subsection b-2
| Name: |
dei_EntityTaxIdentificationNumber |
| Namespace Prefix: |
dei_ |
| Data Type: |
dei:employerIdItemType |
| Balance Type: |
na |
| Period Type: |
duration |
|
| X |
- DefinitionLocal phone number for entity.
| Name: |
dei_LocalPhoneNumber |
| Namespace Prefix: |
dei_ |
| Data Type: |
xbrli:normalizedStringItemType |
| Balance Type: |
na |
| Period Type: |
duration |
|
| X |
- DefinitionBoolean flag that is true when the Form 8-K filing is intended to satisfy the filing obligation of the registrant as pre-commencement communications pursuant to Rule 13e-4(c) under the Exchange Act. Reference 1: http://www.xbrl.org/2003/role/presentationRef
-Publisher SEC
-Name Exchange Act
-Number 240
-Section 13e
-Subsection 4c
| Name: |
dei_PreCommencementIssuerTenderOffer |
| Namespace Prefix: |
dei_ |
| Data Type: |
xbrli:booleanItemType |
| Balance Type: |
na |
| Period Type: |
duration |
|
| X |
- DefinitionBoolean flag that is true when the Form 8-K filing is intended to satisfy the filing obligation of the registrant as pre-commencement communications pursuant to Rule 14d-2(b) under the Exchange Act. Reference 1: http://www.xbrl.org/2003/role/presentationRef
-Publisher SEC
-Name Exchange Act
-Number 240
-Section 14d
-Subsection 2b
| Name: |
dei_PreCommencementTenderOffer |
| Namespace Prefix: |
dei_ |
| Data Type: |
xbrli:booleanItemType |
| Balance Type: |
na |
| Period Type: |
duration |
|
| X |
- DefinitionTitle of a 12(b) registered security. Reference 1: http://www.xbrl.org/2003/role/presentationRef
-Publisher SEC
-Name Exchange Act
-Number 240
-Section 12
-Subsection b
| Name: |
dei_Security12bTitle |
| Namespace Prefix: |
dei_ |
| Data Type: |
dei:securityTitleItemType |
| Balance Type: |
na |
| Period Type: |
duration |
|
| X |
- DefinitionName of the Exchange on which a security is registered. Reference 1: http://www.xbrl.org/2003/role/presentationRef
-Publisher SEC
-Name Exchange Act
-Number 240
-Section 12
-Subsection d1-1
| Name: |
dei_SecurityExchangeName |
| Namespace Prefix: |
dei_ |
| Data Type: |
dei:edgarExchangeCodeItemType |
| Balance Type: |
na |
| Period Type: |
duration |
|
| X |
- DefinitionBoolean flag that is true when the Form 8-K filing is intended to satisfy the filing obligation of the registrant as soliciting material pursuant to Rule 14a-12 under the Exchange Act. Reference 1: http://www.xbrl.org/2003/role/presentationRef
-Publisher SEC
-Name Exchange Act
-Section 14a
-Number 240
-Subsection 12
| Name: |
dei_SolicitingMaterial |
| Namespace Prefix: |
dei_ |
| Data Type: |
xbrli:booleanItemType |
| Balance Type: |
na |
| Period Type: |
duration |
|
| X |
- DefinitionTrading symbol of an instrument as listed on an exchange.
| Name: |
dei_TradingSymbol |
| Namespace Prefix: |
dei_ |
| Data Type: |
dei:tradingSymbolItemType |
| Balance Type: |
na |
| Period Type: |
duration |
|
| X |
- DefinitionBoolean flag that is true when the Form 8-K filing is intended to satisfy the filing obligation of the registrant as written communications pursuant to Rule 425 under the Securities Act. Reference 1: http://www.xbrl.org/2003/role/presentationRef
-Publisher SEC
-Name Securities Act
-Number 230
-Section 425
| Name: |
dei_WrittenCommunications |
| Namespace Prefix: |
dei_ |
| Data Type: |
xbrli:booleanItemType |
| Balance Type: |
na |
| Period Type: |
duration |
|
| X |
- Details
| Name: |
us-gaap_StatementClassOfStockAxis=us-gaap_CommonClassAMember |
| Namespace Prefix: |
|
| Data Type: |
na |
| Balance Type: |
|
| Period Type: |
|
|
| X |
- Details
| Name: |
us-gaap_StatementClassOfStockAxis=AENT_RedeemableWarrantsExercisableForSharesOfClassCommonStockAtExercisePriceOf11.50PerShareMember |
| Namespace Prefix: |
|
| Data Type: |
na |
| Balance Type: |
|
| Period Type: |
|
|
Alliance Entertainment (PK) (USOTC:AENT)
Historical Stock Chart
From Apr 2024 to May 2024
 Charts.")
Alliance Entertainment (PK) (USOTC:AENT)
Historical Stock Chart
From May 2023 to May 2024
 Charts.")