Remedent, Inc. (OTCBB: REMI), an international company specializing
in research, development, and manufacturing of oral care and
cosmetic dentistry products, reported results for the first quarter
ended June 30, 2011 (in US Dollars).
Net sales for the three months ended June 30, 2011 decreased 13%
to $3 million compared to $3.4 million for the same year ago
quarter. Net loss for the three months ended June 30, 2011 prior to
taxes and non-controlling interests was $75k compared to net profit
of $567k for the same year ago quarter.
Cash and cash equivalents totaled approximately $3 million at
June 30, 2011 compared to $1.6 million reported at March 31,
2011.
Management Commentary: "Our investment in
our Chinese operations continues to exceed all our expectations.
For the three months ended June 30, 2011, Glamsmile Asia generated
$900k in revenues and approximately $400k in profits for the first
quarter prior to taxes and outside shareholders interest. This is a
50% increase in revenue for the same year ago quarter. We
anticipate further growth in China and a new fourth studio is
expected to open in Wenzhou, China in September, 2011. We are
certainly looking forward to getting Glamsmile Asia positioned as
one of the leading luxury brands in China as well as the other
emerging markets," said Guy De Vreese, CEO of Remedent, Inc.
Conference Call Information Remedent will
host a conference call on Thursday, August 18, 2011 at 11:00 AM
Eastern Standard Time (8:00 AM Pacific Standard Time) to discuss
these results. A question and answer session will follow
management's presentation. To participate in the call, dial the
appropriate number 5-10 minutes before the start time.
Date: Thursday, August 18, 2011 Time: 11:00 AM Eastern time
(8:00 AM Pacific time) Dial in number: 888-233-7975 Pass code:
8070349
A telephone replay of the call will be available until August
31, 2011 Toll Free Replay Number: 888-203-1112 Replay Password:
8070349
About Remedent Remedent, Inc. specializes
in the research, development and marketing of oral care and
cosmetic dentistry products. The company serves the professional
dental industry with breakthrough technology for dental veneers.
These products are supported by a line of professional veneer
whitening and tooth sensitivity solutions. Headquartered in
Belgium, Remedent distributes its products to more than 35
countries worldwide. For more information, go to
www.remedent.be
Forward-Looking Statements
Statements in this press release that are "forward-looking
statements" are based on current expectations and assumptions that
are subject to risks and uncertainties. Such forward-looking
statements involve known and unknown risks, uncertainties and other
unknown factors that could cause Remedent's actual operating
results to be materially different from any historical results or
from any future results expressed or implied by such
forward-looking statements. In addition to statements that
explicitly describe these risks and uncertainties, readers are
urged to consider statements that contain terms such as "believes,"
"belief," "expects," "expect," "intends," "intend," "anticipate,"
"anticipates," "plans," "plan," "projects," "project," to be
uncertain and forward-looking. Actual results could differ
materially because of factors such as Remedent's ability to achieve
the synergies and value creation contemplated by the proposed
transaction. For further information regarding risks and
uncertainties associated with Remedent's business, please refer to
the risk factors described in Remedent's filings with the
Securities and Exchange Commission, including, but not limited to,
its annual report on Form 10-K and quarterly reports on Form 10-Q.
We undertake no duty to revise or update any forward-looking
statements to reflect events or circumstances after the date of
this press release.
REMEDENT, INC. AND SUBSIDIARIES
CONSOLIDATED STATEMENTS OF OPERATIONS
(Unaudited)

                                                For the three months ended
                                                         June 30,

                                                   2011           2010
                                              -------------- --------------

Net sales                                     $    3,001,971 $    3,436,759
Cost of sales                                        817,397        914,337
                                              -------------- --------------
  Gross profit                                     2,184,574      2,522,422
                                              -------------- --------------
Operating Expenses
    Research and development                         116,496         65,545
    Sales and marketing                              665,978        512,976
    General and administrative                     1,152,007      1,152,712
    Depreciation and amortization                    178,870        201,202
                                              -------------- --------------
  TOTAL OPERATING EXPENSES                         2,113,351      1,932,435
                                              -------------- --------------
INCOME (LOSS) FROM OPERATIONS                         71,223        589,987
                                              -------------- --------------
OTHER (EXPENSES) INCOME
    Interest expense                               (111,522)        (54,891)
    Other income                                      51,649         38,860
                                              -------------- --------------
  TOTAL OTHER (EXPENSES) INCOME                     (59,873)        (16,031)
                                              -------------- --------------

NET INCOME BEFORE TAXES AND NON-CONTROLLING
 INTEREST                                             11,350        573,956

INCOME TAXES                                        (86,393)         (6,229)
                                              -------------- --------------
NET (LOSS) INCOME BEFORE NON-CONTROLLING
 INTEREST                                           (75,043)        567,727

LESS: NET INCOME ATTRIBUTABLE TO THE NON-
 CONTROLLING INTEREST                                259,630        255,577
                                              -------------- --------------

NET (LOSS) INCOME ATTRIBUTABLE TO REMEDENT,
 INC. Common Stockholders                     $    (334,673) $      312,150
                                              ============== ==============

(LOSS) INCOME PER SHARE
    Basic                                     $       (0.02) $         0.02
                                              ============== ==============
    Fully diluted                             $       (0.02) $         0.01
                                              ============== ==============

WEIGHTED AVERAGE SHARES OUTSTANDING
    Basic                                         19,995,969     19,995,969
                                              ============== ==============
    Fully diluted                                 19,995,969     21,160,969
                                              ============== ==============


REMEDENT, INC. AND SUBSIDIARIES
CONSOLIDATED STATEMENTS OF COMPREHENSIVE INCOME (LOSS)
(Unaudited)

                                                   For the three months
                                                      ended June 30,
                                              -----------------------------
                                                   2011           2010
                                              -------------- --------------
Net Income(Loss) Attributable to Remedent
 Common Stockholders                          $    (334,673) $      312,150

OTHER COMPREHENSIVE
INCOME (LOSS):
  Foreign currency translation adjustment             57,279       (177,648)
                                              -------------- --------------

TOTAL OTHER COMPREHENSIVE (LOSS) INCOME            (277,934)        134,502

LESS: COMPREHENSIVE LOSS ATTRIBUTABLE TO NON-
 CONTROLLING INTEREST                                     --        (15,865)

                                              -------------- --------------
COMPREHENSIVE (LOSS) INCOME ATTRIBUTABLE TO
 REMEDENT Common Stockholders                 $    (277,934) $      150,367
                                              ============== ==============


REMEDENT, INC. AND SUBSIDIARIES
CONSOLIDATED BALANCE SHEETS

                                              June 30, 2011  March 31, 2011
                                             --------------  --------------
ASSETS                                         (unaudited)
CURRENT ASSETS:
Cash and cash equivalents                    $    2,975,682  $    1,662,520
  Accounts receivable, net of allowance for
   doubtful accounts of $29,719 at June 30,
   2011 and $28,975 at March 31, 2011             2,092,397       2,764,651
Inventories, net                                  2,294,648       2,164,046
Prepaid expense                                     874,546         762,953
                                             --------------  --------------
  Total current assets                            8,237,273       7,354,170
                                             --------------  --------------
PROPERTY AND EQUIPMENT, NET                       1,263,851       1,401,735
OTHER ASSETS
Patents, net                                        242,299         166,746
Goodwill                                            699,635         699,635
                                             --------------  --------------
  Total assets                               $   10,443,058  $    9,622,286
                                             ==============  ==============
LIABILITIES AND STOCKHOLDERS' EQUITY
 (DEFICIT)
CURRENT LIABILITIES:
Current portion, long term debt              $      137,841  $      184,679
Line of Credit                                    2,304,115       2,160,674
Short term loan                                     441,702         400,000
Accounts payable                                  1,831,486       1,744,253
Accrued liabilities                                 951,472       1,256,148
Deferred revenue                                    475,250         475,250
Due to related parties                                   --          95,354
                                             --------------  --------------
  Total current liabilities                       6,141,866       6,316,358
Long term debt less current portion               1,273,557         273,557
                                             --------------  --------------
  Total liabilities                               7,415,423       6,589,915
                                             --------------  --------------

EQUITY:
  Preferred Stock $0.001 par value
   (10,000,000 shares authorized, none issued
   and outstanding)                                      --              --
  Common stock, $0.001 par value; (50,000,000
   shares authorized, 19,995,969 shares
   issued and outstanding at June 30, 2011
   and March 31, 2011 respectively)                  19,996          19,996
  Treasury stock, at cost; 723,000 shares
   outstanding at June 30, 2011 and March 31,
   2011 respectively                               (831,450)       (831,450)
Additional paid-in capital                       24,868,908      24,855,883
Accumulated deficit                             (21,447,788)    (21,113,118)
Accumulated other comprehensive income (loss)
 (foreign currency translation adjustment)         (777,670)       (834,949)
Obligation to issue shares                           97,500          97,500
                                             --------------  --------------
  Total Remedent, Inc. stockholders' equity       1,929,496       2,193,862
                                             --------------  --------------
Non-controlling interest                          1,098,139         838,509
                                             --------------  --------------
Total stockholders' equity                        3,027,635       3,032,371
                                             --------------  --------------
  Total liabilities and equity               $   10,443,058  $    9,622,286
                                             ==============  ==============
CONTACT: Stephen Ross 310 922 5685 docktor99@aol.com
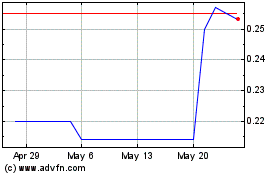
Elysee Development (PK) (USOTC:ASXSF)
Historical Stock Chart
From Jun 2024 to Jul 2024

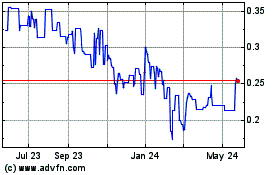
Elysee Development (PK) (USOTC:ASXSF)
Historical Stock Chart
From Jul 2023 to Jul 2024
