Avidbank Holdings, Inc. (“the Company”) (OTCBB: AVBH), sole
owner of Avidbank (“the Bank”), an independent full-service
commercial bank serving businesses and consumers in Northern
California, announced net income of $923,000 for the second quarter
of 2013 compared to $653,000 during the same period in 2012.
2nd Quarter 2013 Financial Highlights
- Net income was $1,437,000 for the first
six months of 2013, compared to $1,424,000 for the first six months
of 2012
- Diluted earnings per common share were
$0.47 for the first six months of 2013, compared to $0.48 for the
first six months of 2012
- Net income was $923,000 for the second
quarter of 2013. Excluding gains from the sale of investment
securities net income from core operations was $528,000 for the
quarter.
- Diluted earnings per common share were
$0.30 for the quarter, compared to $0.22 for the second quarter of
2012
- Total assets grew annually by 11% to
$433 million
- Total loans outstanding grew by 4% to
$248 million
- Total deposits grew by 8% to $377
million
- The Company continues to be well
capitalized with a Tier 1 Leverage Ratio of 12.7% and a Total Risk
Based Capital Ratio of 17.2%
Mark D. Mordell, Chairman and Chief Executive Officer, stated,
“We are pleased that net income for the second quarter of 2013
increased by 41% compared to the second quarter of 2012 as gains
from investment security sales more than offset an increase in
expenses from expanding our business development and loan
generation capacity. The Bank’s loans, deposits and total assets
all showed growth over the second quarter of the previous year.
Loan growth was 4% in spite of some large construction loan
payoffs. Our loan production offices in San Jose and Redwood City
are starting to gain traction in the marketplace and our capacity
for generating earning assets is continually improving. All of our
capital ratios have dramatically improved with the $16 million
capital raise we recently completed and announced in June.”
For the three months ended June 30, 2013, net interest income
before provision for loan losses was $3.8 million, an increase of
more than $91,000 or 2% compared to the second quarter of 2012. The
growth in net interest income was the result of growth in loans
outstanding. Average earning assets were $402 million in the second
quarter of 2013, a 14% increase over the second quarter of the
prior year. Net interest margin was 3.82% for the second quarter,
compared to 4.34% for the second quarter of 2012. No loan loss
provision was made in the second quarter of 2013 while a $100,000
loan loss provision was made in the second quarter of 2012.
For the first six months of 2013 net interest income before
provision was $7.7 million, a $0.3 million increase over the prior
year. The growth in net interest income was the result of growth in
earning assets partially offset by a decrease in net interest
margin. Average earning assets grew by $59 million or 17% over
2012. Net interest margin decreased from 4.41% in 2012 to 3.88% in
2013, primarily as a result of a drop in loan yields partially
offset by a decrease in the Bank’s cost of funds. No provision for
loan losses has been recorded to date in 2013, while a $100,000
loan loss provision was recognized in the first half of 2012. We
have experienced net recoveries of $285,000 for the first half of
2013 compared to net charge-offs of $14,000 for the first six
months of 2012. Non-accrual loans totaled $699,000 on June 30, 2013
compared to $975,000 for the end of the previous year. “Our high
underwriting standards continue to serve us well as we prepare for
growth in the second half of the year,” stated Mr. Mordell.
Non-interest expense grew by $433,000 in the second quarter of
2013 to $3.1 million compared to $2.6 million for the second
quarter of 2012. This growth is due to investments in loan
production personnel and facilities as we continue to expand our
footprint and grow our loan portfolio.
Non-interest expense grew by $990,000 for the first six months
of 2013 to $6.2 million compared to $5.2 million for the first six
months of 2012. This growth is due to the previously mentioned
investments in loan production personnel and facilities.
Non-interest income was $840,000 in the second quarter of 2013,
an increase of $727,000 or 644% over the second quarter of 2012.
Non-interest income in the second quarter of 2013 reflected
$681,000 of gains from investment securities sales.
For the first six months of 2013, non-interest income, excluding
gains on sales of securities was $284,000, an increase of more than
$64,000 or 29% over the comparable period in 2012.
About Avidbank
Avidbank Holdings, Inc., headquartered in Palo Alto, California
offers innovative financial solutions and services. We specialize
in the following markets: commercial & industrial, corporate
finance, asset-based lending, real estate construction and
commercial real estate lending, and real estate bridge financing.
Avidbank advances the success of our clients by providing them with
financial opportunities and serving them as we wish to be served –
with mutual effort, ingenuity and trust – creating long-term
banking relationships.
Forward-Looking Statement:
This news release contains statements that are forward-looking
statements within the meaning of the Private Securities Litigation
Reform Act of 1995. These statements are based on current
expectations, estimates and projections about Avidbank’s business
based, in part, on assumptions made by management. These statements
are not guarantees of future performance and involve risks,
uncertainties and assumptions that are difficult to predict.
Therefore, actual outcomes and results may differ materially from
what is expressed or forecasted in such forward-looking statements
due to numerous factors, including those described above and the
following: Avidbank’s timely implementation of new products and
services, technological changes, changes in consumer spending and
savings habits and other risks discussed from time to time in
Avidbank’s reports and filings with banking regulatory agencies. In
addition, such statements could be affected by general industry and
market conditions and growth rates, and general domestic and
international economic conditions. Such forward-looking statements
speak only as of the date on which they are made, and Avidbank does
not undertake any obligation to update any forward-looking
statement to reflect events or circumstances after the date of this
release.
Avidbank Holdings, Inc. Balance Sheet ($000, except
per share amounts) Unaudited Audited Unaudited
Assets
6/30/13
12/31/12
6/30/12
Cash and due from banks $ 13,718 $ 21,493 $ 11,870 Fed funds sold
115,575 85,510 57,171
Total cash and cash equivalents 129,293 107,003 69,041
Investment securities - available for sale 50,541 55,343 74,114
Loans, net of deferred loan fees 247,964 247,269 237,341
Allowance for loan losses (4,764 ) (4,480 )
(4,462 ) Loans, net of allowance for loan losses 243,200 242,789
232,879 Premises and equipment, net 1,269 1,291 708 Accrued
interest receivable & other assets 8,212
9,296 11,222 Total assets $ 432,515 $
415,721 $ 387,965
Liabilities
Non-interest-bearing demand deposits $ 115,115 $ 105,518 $ 109,522
Interest bearing transaction accounts 16,177 17,293 14,549 Money
market and savings accounts 186,885 185,664 158,042 Time deposits
58,901 66,520 67,083
Total deposits 377,078 374,994 349,195 Other liabilities
2,332 2,864 3,019 Total
liabilities 379,410 377,858 352,215
Shareholders'
equity
Preferred stock 5,974 5,952 5,929 Common stock 44,579 29,556 29,448
Retained earnings 2,436 1,171 23 Accumulated other comprehensive
income 116 1,184 350
Total shareholders' equity 53,105 37,863 35,750 Total
liabilities and shareholders' equity $ 432,515 $ 415,721
$ 387,965 Tier 1 leverage ratio 12.66 %
8.88 % 9.72 % Tier 1 risk-based capital ratio 15.92 % 10.78 % 10.84
% Total risk-based capital ratio 17.17 % 12.03 % 12.09 % Book value
per common share $ 11.03 $ 12.20 $ 11.41 Total shares outstanding
4,274,014 2,614,655 2,613,655
Avidbank Holdings,
Inc. Condensed Statements of Operations
(Unaudited) ($000, except per share
amounts)
Quarter Ended Year to Date
6/30/13
6/30/12
6/30/13
6/30/12
Interest and fees on loans $ 3,661 $ 3,692
$
7,383
$ 7,347 Interest on investment securities 399 528 803 1,056 Other
interest income 57 17 111
37 Total interest income 4,117 4,237 8,297 8,440
Interest expense 289 500 607
1,002 Net interest income 3,828 3,736 7,690
7,438 Provision for loan losses - 100
- 100
Net interest income after provision for
loan losses
3,828 3,636 7,690 7,338 Service charges, fees and other
income 159 113 284 220 Gain on sale of investment securities
681 - 681 - Total
non-interest income 840 113 965 220 Compensation and benefit
expenses 1,802 1,559 3,640 3,052 Occupancy and equipment expenses
441 296 1,413 1,088 Other operating expenses 829
785 1,116 1,038 Total
non-interest expense 3,072 2,639 6,168 5,178 Income before
income taxes 1,596 1,110 2,487 2,380 Provision for income taxes
673 457 1,050 956
Net income $ 923 $ 653
$
1,437
$ 1,424 Preferred dividends & warrant
amortization 84 84 168
168
Net income applicable to common
shareholders
$ 839 $ 569
$
1,269
$ 1,256 Basic earnings per share $ 0.31
$ 0.22
$
0.47
$ 0.48 Diluted earnings per share $ 0.30 $ 0.22
$
0.47
$ 0.48 Average shares outstanding 2,733,948 2,612,127
2,675,349 2,607,977 Average fully diluted shares 2,773,900
2,623,127 2,715,301 2,618,977 Annualized returns: Return on
average assets 0.88 % 0.70 % 0.69 % 0.79 % Return on average common
equity 9.87 % 8.81 % 8.25 % 9.73 % Net interest margin 3.82
% 4.34 % 3.88 % 4.41 % Cost of funds 0.31 % 0.62 % 0.33 % 0.63 %
Efficiency ratio 66 % 69 % 71 % 68 %
Avidbank Holdings, Inc.Steve Leen, 650-843-2204Executive Vice
President and Chief Financial
Officersleen@avidbank.comavidbank.com
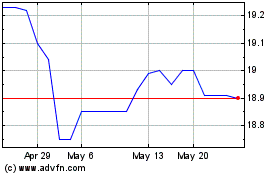
Avidbank (PK) (USOTC:AVBH)
Historical Stock Chart
From Jan 2025 to Feb 2025

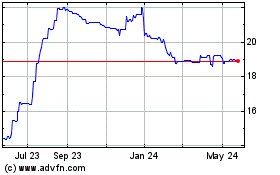
Avidbank (PK) (USOTC:AVBH)
Historical Stock Chart
From Feb 2024 to Feb 2025
