Farmers & Merchants Bank of Long Beach (OTCBB:FMBL) today
reported financial results for the fourth quarter and full year
ended December 31, 2010.
“Farmers & Merchants Bank finished 2010 with strength,
reduced operating expenses for the 2010 fourth quarter and
continued profitability during an important transitional period for
the industry and economy as a whole,” said Henry Walker, chief
executive officer of Farmers & Merchants Bank of Long Beach.
“Even though the economic environment continues to pose challenges,
we enter 2011 well positioned to continue our legacy of providing a
superior banking experience.”
Income Statement
For the 2010 fourth quarter, total interest income was $44.0
million, compared with $46.9 million in the fourth quarter of 2009.
Total interest income for the year ended December 31, 2010 was
$178.9 million, compared with $189.6 million reported for the same
period in 2009.
Interest expense for the 2010 fourth quarter declined to $2.7
million from $3.8 million in the same quarter of 2009, primarily
amid a lower interest rate environment. Interest expense for the
year totaled $12.0 million, compared with $18.4 million for the
same period in 2009.
The Bank’s net interest income for the 2010 fourth quarter was
$41.3 million, compared with $43.1 million in the same quarter of
2009, and was $166.9 million for the full-year 2010, versus $171.2
million in 2009. Farmers & Merchant’s net interest margin was
4.23% for the year ended December 31, 2010, compared with 4.60% in
the previous year.
The Bank’s provision for loan losses decreased to $6.5 million
in the fourth quarter of 2010 from $15.1 million in the 2009 fourth
quarter, as economic conditions continued to stabilize. Provision
for loan losses declined to $26.0 million in 2010 from $40.8
million for 2009. The Bank’s allowance for loan losses as a
percentage of loans outstanding was 2.69% at December 31, 2010,
compared with 2.85% at December 31, 2009.
Non-interest income rose to $4.2 million for the 2010 fourth
quarter, compared with $3.7 million in the 2009 fourth quarter.
Non-interest income for the full 2010 year totaled $15.4 million,
compared with $13.1 million for 2009.
Non-interest expense for the 2010 fourth quarter was $16.7
million, compared with $17.3 million for the same period last year.
Non-interest expense for the year ended December 31, 2010 was $74.4
million, compared with $77.5 million last year. Farmers &
Merchants’ overhead efficiency ratio was 39.88% for 2010, compared
with 41.26% for 2009.
The Bank’s net income for the 2010 fourth quarter increased to
$15.3 million, or $117.16 per diluted share, from $10.1 million, or
$77.31 per diluted share, in the 2009 fourth quarter. The Bank’s
net income for 2010 rose to $53.0 million, or $405.06 per diluted
share, from $40.7 million, or $310.82 per diluted share, for
2009.
Balance Sheet
At December 31, 2010, net loans increased to $2.01 billion from
$1.97 billion at December 31, 2009. The Bank’s deposits grew 5.7%
to $3.0 billion at the end of 2010, from $2.8 billion at December
31, 2009. Non-interest bearing deposits represented 33.4% of total
deposits at December 31, 2010, versus 31.6% of total deposits at
December 31, 2009. Total assets increased to $4.26 billion at the
close of 2010 from $3.98 billion at December 31, 2009.
At December 31, 2010, Farmers & Merchants Bank remained
“well-capitalized” under all regulatory categories, with a total
risk-based capital ratio of 26.59%, a Tier 1 risk-based capital
ratio of 25.33%, and a Tier 1 leverage ratio of 14.31%. The minimum
ratios for capital adequacy for a well-capitalized bank are 10.00%,
6.00% and 4.00%, respectively.
“Our robust balance sheet is important to both existing and new
customers because it demonstrates Farmers & Merchants’
commitment to long-term relationships,” said Daniel Walker,
president and chairman of the board. “Our disciplined approach to
banking is rooted in more than a century of experience, a
distinguishing factor in an industry that requires a solid
foundation.”
About Farmers & Merchants Bank of Long Beach
Farmers & Merchants Bank of Long Beach provides personal and
business banking services through 22 offices in Los Angeles and
Orange Counties. Founded in 1907 by C.J. Walker, the Bank
specializes in commercial and small business banking along with
business loan programs.
FARMERS & MERCHANTS BANK OF LONG BEACH Balance
Sheets (Unaudited) (In Thousands)
Dec. 31, 2010 Dec. 31, 2009 Assets
Cash and due from banks: Noninterest-bearing balances $
49,628 $ 46,402 Interest-bearing balances 48,509 123,491 Investment
securities 1,977,343 1,709,983 Gross loans 2,070,493 2,025,586 Less
allowance for loan losses (55,627 ) (57,751 ) Less unamortized
deferred loan fees, net (426 ) (129 ) Net loans 2,014,440
1,967,706 Bank premises and equipment 51,650 52,783 Other
real estate owned 37,300 19,600 Accrued interest receivable 17,134
16,427 Deferred tax asset 27,032 26,161 Other assets 39,370
18,216
Total assets $ 4,262,406
$ 3,980,769 Liabilities and
stockholders' equity Liabilities:
Deposits: Demand, non-interest bearing $ 1,004,272 $ 898,186
Demand, interest bearing 261,961 254,905 Savings and money market
savings 754,446 626,320 Time deposits 983,314 1,063,579
Total deposits 3,003,993 2,842,990 Securities
sold under agreements to repurchase 628,192 544,566 Accrued
interest payable and other liabilities 7,141 6,348
Total liabilities 3,639,326
3,393,904 Stockholders' Equity:
Common Stock, par value $20; authorized 250,000 shares; issued and
outstanding 130,928 shares 2,619 2,619 Surplus 12,044 12,044
Retained earnings 601,861 563,099 Other comprehensive income 6,556
9,103
Total stockholders' equity
623,080 586,865 Total
liabilities and stockholders' equity $ 4,262,406
$ 3,980,769
FARMERS & MERCHANTS BANK OF LONG
BEACH
Income Statements (Unaudited)
(In Thousands)
Three Months ended Dec. 31, Year ended Dec.
31, 2010 2009 2010
2009 Interest income: Loans $ 28,796 $ 30,180 $
115,928 $ 121,745 Securities held to maturity 11,768 12,005 47,563
48,773 Securities available for sale 3,311 4,403 14,666 18,388
Deposits with banks 85 284 774 654 Total interest income
43,960 46,872 178,931 189,560
Interest
expense: Deposits 2,219 3,120 9,999 15,707 Securities sold
under agreement to repurchase 449 656 2,043 2,664 Total
interest expense 2,668 3,776 12,042 18,371 Net
interest income 41,292 43,096 166,889 171,189
Provision
for loan losses 6,500 15,100 25,950 40,800 Net interest
income after provision for loan losses 34,792 27,996 140,939
130,389
Non-interest income: Service charges on
deposit accounts 1,240 1,368 5,073 5,771 Gains on sale of
securities - - 870 - Merchant bankcard fees 286 336 1,209 1,230
Escrow fees 188 152 790 673 Other 2,504 1,818 7,489 5,470
Total non-interest income 4,218 3,674 15,431 13,144
Non-interest expense: Salaries and employee benefits 9,631
8,701 40,165 38,834 FDIC and other insurance expense 1,265 846
4,881 6,211 Occupancy expense 1,465 1,482 5,696 6,038 Equipment
expense 1,345 1,224 5,102 4,963 Other real estate owned expense,
net (520 ) 1,701 6,298 10,326 Legal and professional fees 689 632
2,436 2,291 Marketing and promotional expense 692 634 3,004 2,035
Printing and supplies 217 173 831 901 Postage and delivery 298 268
1,154 1,252 Other 1,651 1,597 4,861 4,678 Total non-interest
expense 16,733 17,258 74,428 77,530 Income before income tax
expense 22,277 14,412 81,942 66,003
Income tax expense:
6,938 4,290 28,909 25,308
Net income $
15,339 $ 10,122 $ 53,033
$ 40,695 Basic and diluted earnings per common
share $ 117.16 $ 77.31 $ 405.06 $ 310.82
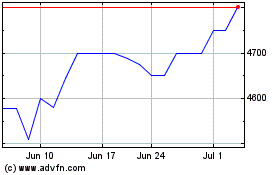
Farmers and Merchants Bank (QX) (USOTC:FMBL)
Historical Stock Chart
From Dec 2024 to Jan 2025

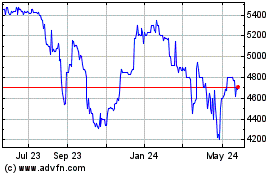
Farmers and Merchants Bank (QX) (USOTC:FMBL)
Historical Stock Chart
From Jan 2024 to Jan 2025
