Farmers & Merchants Bank of Long Beach (OTCBB: FMBL) today
reported financial results for the second quarter ended June 30,
2012.
“Farmers & Merchants reported solid financial results for
the second quarter, maintaining strong operational performance and
continuing to grow the Bank’s deposit base,” said Henry Walker,
president of Farmers & Merchants Bank of Long Beach. “The
Bank’s strength reflects our conservative lending practices and
disciplined approach to managing investments.”
Income Statement
For the 2012 second quarter, interest income decreased to $42.9
million from $45.5 million in the prior-year comparable period.
Interest income for the first half of 2012 was $89.2 million,
compared with $90.7 million reported for the first half of
2011.
Interest expense for the 2012 second quarter declined to $1.8
million from $2.5 million in the second quarter of 2011, primarily
related to the prolonged low interest rate environment. Interest
expense for the first half of 2012 declined to $3.6 million from
$5.1 million reported for the first half of 2011.
Net interest income for the 2012 second quarter declined to
$41.1 million from $42.9 million for the second quarter of 2011,
and was virtually unchanged at $85.5 million for the first half of
2012, compared with the six months ended June 30, 2011.
The Bank did not have a provision for loan losses in the second
quarter or first half of 2012, primarily because of generally more
stable economic conditions. The provision for loan losses was $6.1
million for the second quarter of 2011 and $6.8 million for the
first half of 2011. The Bank’s allowance for loan losses as a
percentage of loans outstanding was 2.80% at June 30, 2012, in line
with 2.80% at December 31, 2011.
Non-interest income was $3.4 million for the 2012 second
quarter, the same as that for the second quarter a year ago.
Non-interest income was $8.6 million for the first half of 2012,
compared with $6.6 million for the first half of 2011.
Non-interest expense for the 2012 second quarter was $19.9
million, compared with $18.5 million for the same period last year.
Non-interest expense for the first half of 2012 was $41.8 million,
compared with $39.8 million for the first half of 2011.
Farmers & Merchants’ net interest margin was 3.73% for the
2012 second quarter, compared with 4.24% last year.
The Bank’s net income for the 2012 second quarter rose 19.0% to
$16.7 million, or $127.87 per diluted share, from $14.0 million, or
$107.21 per diluted share, for the 2011 second quarter. Net income
for the first half of 2012 advanced to $35.3 million, or $269.35
per diluted share, from $29.4 million, or $224.39 per diluted share
for the first six months of 2011.
Balance Sheet
At June 30, 2012, net loans decreased to $1.99 billion from
$2.03 billion at December 31, 2011. The Bank’s deposits grew to
$3.48 billion at the end of the 2012 second quarter, from $3.39
billion at December 31, 2011. Non-interest bearing deposits
represented 37.7% of total deposits at June 30, 2012, versus 37.2%
of total deposits at December 31, 2011. Total assets increased to
$4.78 billion at the close of the 2012 second quarter from $4.66
billion at December 31, 2011.
At June 30, 2012, Farmers & Merchants Bank remained
“well-capitalized” under all regulatory categories, with a total
risk-based capital ratio of 28.90%, a Tier 1 risk-based capital
ratio of 27.64%, and a Tier 1 leverage ratio of 14.47%. The minimum
ratios for capital adequacy for a well-capitalized bank are 10.00%,
6.00% and 5.00%, respectively.
“Deposits grew at a steady clip during the first half of 2012,
as we continued to maintain a strong balance sheet,” said Daniel
Walker, chief executive officer and chairman of the board. “With
capital ratios well above regulatory minimums, the Bank enters the
second half of the year in a position of strength and
stability.”
About Farmers & Merchants Bank of Long Beach
Farmers & Merchants Bank of Long Beach provides personal and
business banking services through 21 offices in Los Angeles and
Orange Counties. Founded in 1907 by C.J. Walker, the Bank
specializes in commercial and small business banking along with
business loan programs.
FARMERS & MERCHANTS BANK OF LONG BEACH
Income Statements (Unaudited) (In Thousands)
Three Months Ended June
30, Six Months Ended June 30, 2012 2011
2012 2011 Interest income: Loans
$ 27,945 $ 28,436 $ 59,355 $ 57,835 Securities held to maturity
11,911 13,014 23,544 25,434 Securities available for sale 2,776
3,961 5,791 7,341 Deposits with banks 252 50
471 111 Total interest income 42,884
45,461 89,161 90,721
Interest
expense: Deposits 1,513 2,106 3,079 4,239 Securities
sold under agreement to repurchase 280 433
549 868 Total interest expense 1,793
2,539 3,628 5,107 Net interest
income 41,091 42,922 85,533 85,614
Provision for loan
losses - 6,050 - 6,750
Net int. income after provision for loan losses
41,091 36,872 85,533 78,864
Non-interest income: Service charges on deposit
accounts 1,153 1,182 2,352 2,352 Merchant bankcard fees 481 290 902
555 Escrow fees 264 272 429 477 Other 1,530
1,605 4,915 3,255 Total non-interest income
3,427 3,350 8,598 6,639
Non-interest expense: Salaries and employee benefits
11,803 10,349 23,564 21,038 FDIC and other insurance expense 1,609
703 3,179 1,820 Occupancy expense 1,358 1,405 2,736 2,663 Equipment
expense 1,379 1,416 2,716 2,732 Other real estate owned expense,net
(758 ) 550 538 2,043 Amortization of investments in low-income
communities 1,830 451 4,031 902 Legal and professional fees 581 862
1,045 1,613 Marketing and promotional expense 547 1,100 1,233 1,905
Other 1,509 1,673 2,747 5,050
Total non-interest expense 19,858
18,509 41,789 39,766 Income before income tax
expense 24,660 21,713 52,342 45,737
Income tax
expense 7,918 7,676 17,077
16,359
Net income $ 16,742
$ 14,037 $ 35,265 $
29,378 Basic and diluted earnings per common share $
127.87 $ 107.21 $ 269.35 $ 224.39
FARMERS & MERCHANTS BANK OF LONG
BEACH Balance Sheets (Unaudited) (In Thousands)
June 30, 2012 Dec. 31, 2011 Assets
Cash and due from banks: Noninterest-bearing balances $
55,720 $ 57,394 Interest-bearing balances 245,722 278,525
Investment securities 2,308,810 2,113,130 Gross loans 2,044,716
2,087,388 Less allowance for loan losses (57,155 ) (58,463 ) Less
unamortized deferred loan fees, net (450 ) (418 ) Net loans
1,987,111 2,028,507 Other real estate owned 21,248
23,036 Investments in low-income communities 39,535 43,566 Bank
premises and equipment 59,751 55,155 Accrued interest receivable
16,940 16,464 Deferred tax asset 29,117 28,583 Other assets 15,909
14,985
Total assets $
4,779,863 $ 4,659,345
Liabilities and stockholders' equity
Liabilities: Deposits: Demand, non-interest bearing $
1,314,325 $ 1,263,162 Demand, interest bearing 307,950 300,984
Savings and money market savings 964,329 909,794 Time deposits
897,608 919,538 Total deposits 3,484,212
3,393,478 Securities sold under agreements to repurchase
559,007 555,992 Other liabilities 37,289 39,659
Total liabilities 4,080,508
3,989,129 Stockholders' Equity:
Common Stock, par value $20;
authorized
250,000 shares; issued and outstanding 130,928 shares 2,619 2,619
Surplus 12,044 12,044 Retained earnings 676,474 646,708 Other
comprehensive income 8,218 8,845
Total
stockholders' equity 699,355 670,216
Total liabilities and stockholders' equity
$ 4,779,863 $ 4,659,345
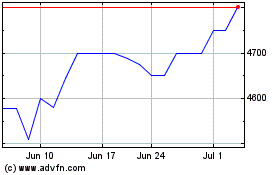
Farmers and Merchants Bank (QX) (USOTC:FMBL)
Historical Stock Chart
From Feb 2025 to Mar 2025

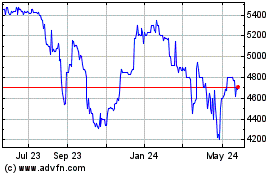
Farmers and Merchants Bank (QX) (USOTC:FMBL)
Historical Stock Chart
From Mar 2024 to Mar 2025
