Bitcoin Attempt To Dip Below $96K ‘Led To Nothing’ – Analyst Expects $100K Soon
26 November 2024 - 2:30AM
NEWSBTC
Bitcoin has been on a remarkable upward trajectory, pushing above
the $96,000 mark for several days after consolidating below the
psychological $100,000 level. As the leading cryptocurrency,
Bitcoin has consistently broken all-time highs over the past three
weeks, with yesterday marking a milestone weekly close at
$98,000—the highest in its history. Related Reading: XRP
Analyst Sets $2 Target If It Holds Key Level – Can It Reach
Multi-Year Highs? CryptoQuant analyst Axel Adler shared an
insightful analysis on X, emphasizing that Bitcoin’s recent attempt
to dip below $95,000 met with significant resistance, reinforcing
the strength of current support levels. According to Adler, the
market is now poised for a critical test of the $100,000 mark, a
barrier that could catalyze further bullish momentum or signal a
short-term consolidation phase. With Bitcoin’s bullish trajectory
showing no signs of slowing, traders and investors are closely
watching for a breakout above $100,000. Such a move could ignite
broader market optimism and drive renewed interest in altcoins,
potentially shaping the next phase of the crypto market’s growth.
However, failure to break above this key level might trigger a
healthy correction, setting the stage for a more sustainable rally.
Bitcoin Price Action Remains Strong Bitcoin’s price action has
remained exceptionally bullish despite a recent retrace from
$99,800 to $95,800—a minor dip of less than 4%. Investors widely
see this pullback as a brief consolidation phase before a potential
breakout above the pivotal $100,000 mark. The resilience
demonstrated during this retrace has bolstered confidence among
market participants, with many viewing it as a healthy pause in an
ongoing uptrend. Renowned CryptoQuant analyst Axel Adler weighed in
on the recent market movements via X, sharing a technical analysis
that reinforces Bitcoin’s robust bullish structure. Adler
highlighted that pushing BTC to lower demand levels was
unsuccessful, further solidifying current support zones.
According to his insights, the stage is now set for Bitcoin to
finally test the critical $100,000 area and gauge the market’s
reaction at this psychological threshold. As BTC approaches this
milestone, investor sentiment appears divided. Many traders view
the $100,000 level as an ideal price to begin taking profits,
citing historical patterns of pullbacks after significant
round-number milestones. Related Reading: Avalanche Soars 20%
In 24 Hours – Analyst Reveals Next Price Target However, others
remain optimistic about Bitcoin’s continued strength, forecasting a
potential surge beyond $100,000. Predictions for the rally’s peak
range between $105,000 and $120,000, reflecting a broader belief in
the cryptocurrency’s long-term potential. Whether Bitcoin
consolidates or continues climbing, all eyes remain on its next
moves. Bullish Weekly Close Could Send BTC Higher Bitcoin has
achieved its highest weekly close in history, recording an
impressive $98,000. This milestone is a technical achievement and a
critical psychological boost for market participants. It signals a
strong bullish environment that could soon propel Bitcoin above the
coveted $100,000 mark. The $98,000 level now serves as a robust
support zone, and maintaining this price—or at least staying above
$95,000—in the coming days will be pivotal. A breakout above these
levels could propel Bitcoin towards $100,000 with significant
momentum. Such a move would solidify Bitcoin’s uptrend and attract
further interest from retail and institutional investors. Related
Reading: Massive Ethereum Buying Spree – Taker Buy Volume hits
$1.683B In One Hour However, continued consolidation below $100,000
remains a possibility. Bitcoin may take several weeks of sideways
movement to gather the strength needed for the next leg up. While
potentially frustrating for short-term traders, this consolidation
phase would provide a healthy foundation for sustainable
growth. Featured image from Dall-E, chart from TradingView
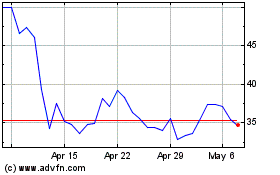
Avalanche (COIN:AVAXUSD)
Historical Stock Chart
From Dec 2024 to Jan 2025

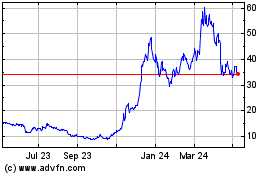
Avalanche (COIN:AVAXUSD)
Historical Stock Chart
From Jan 2024 to Jan 2025
