Cardano Price Poised To Hit $2.88, Following Solana’s Fractal: Crypto Analyst
23 August 2024 - 9:00PM
NEWSBTC
Crypto analyst @XForceGlobal shared a new video chart analysis
focused on Cardano (ADA), a cryptocurrency that many are dismissing
as a “dinosaur coin” at the moment. In the analysis, XForceGlobal
(@XForceGlobal) provided an in-depth look at Cardano’s current
position within the Elliott Wave cycle, suggesting that ADA is on
the of entering a strong upward phase, commonly referred to as
“Wave 3.” Cardano Price Could Soar To $2.88 The analyst compares
the current price action of ADA to that of Solana (SOL). Earlier
this year, Solana demonstrated a similar price trajectory under
comparable market conditions. The comparison is drawn using
logarithmic price charts, which clearly displays the Elliott Wave
structures, identifying a WXY corrective pullback followed by a new
impulse wave setup. “If we look at the actual wave count of Solana
you can see that it did a WXY pullback. Now this corrected pullback
caught us all off guard, it didn’t look like a correction pullback
in the first place. It looked better as an impulse to the downside
[…] it caught everyone off guard. Even the bulls and even the
bears,” explained XForceGlobal. Related Reading: Cardano Chang
Upgrade Launch: ADA Sees 52% Explosion In Major Metric The Elliott
Wave Theory, which is central to his analysis, posits that markets
move in repetitive cycles of waves driven by investor psychology.
According to XForceGlobal, ADA is mirroring the early stages of
Solana’s previous rally, which saw significant gains as it entered
the third wave of its cycle. The crypto analyst outlined that ADA
is currently positioned in what appears to be the second wave,
following a corrective pullback, which typically precedes strong
bullish momentum. “In the previous bull market alone, we did an
18,000% […] and I’m not sure why people are just brushing this coin
off as a dead coin. I believe it’s a very good coin but we just
need to find the right opportunity in terms of the timing,” stated
the analyst during the video. Delving into the potential future of
ADA, the analyst projects a conservative estimate of a 5x to 10x
times increase in its price. This prediction is based not only on
Elliott Wave analysis but also on comparative historical data from
other high market cap altcoins like XRP, which are currently in
similar positions within their market cycles. Related Reading:
Cardano Rises 8% As Hoskinson Reveals Launch Date For Highly
Anticipated Chang Fork “Wave 3’s are usually the most profitable,
if not arguably better than what XRP is going to be giving us
because XRP right now is on Wave 3 to 4 and we don’t know how wave
five is going to be completed and that’s usually the end of a
trend. ADA is in a wave three and it may be even going for a wave
five which can be even bringing us to higher levels that could be
giving us a potential break of the all-time high,” XForceGlobal
remarked. To quantify the risk-reward ratio, the analyst uses a
long positioning tool that suggests a 14 or 15 : 1 one risk-reward
potential, based on a prospective 600% run. Additionally, the
crypto analyst emphasized the importance of historical context and
the apparent neglect of “dinosaur coins,” in favor of more recent,
meme-driven cryptocurrencies: “I believe dinosaur coins, AKA coins
that have been trading since 2018 or so, that have a relatively
long price history, may be setting us up for another run since they
haven’t gone for a run during this whole memecoin narrative.” In
conclusion, @XForceGlobal’shighlights a highly optimistic outlook
for ADA. Via X, he stated: “Cardano did an 18,000% run in its last
bull run, but it also did one of the strongest pullbacks during the
bear market. Structure looks very similar to when SOL was creating
a bottom as well for a 1-2 sequence. Wave 3 targets would be around
$3.” At press time, ADA traded at $0.3842. Featured image created
with DALL.E, chart from TradigView.com
Solana (COIN:SOLUSD)
Historical Stock Chart
From Oct 2024 to Nov 2024

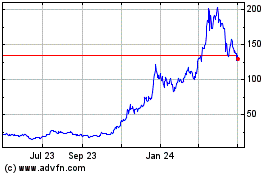
Solana (COIN:SOLUSD)
Historical Stock Chart
From Nov 2023 to Nov 2024
