Solana Price At $4,000? Cup And Handle Pattern Shows Why This Is Possible
12 December 2024 - 2:00AM
NEWSBTC
The Solana price is currently in a massive supply zone after recent
declines in the past 48 hours that cut across the entire crypto
landscape. Notably, technical analysis suggests that the Solana
price is on the way to a massive breakout that would see both its
price and market cap surge by over 1,700% in the near future. This
analysis is highlighted by a cup and handle formation that has been
in play for over two years. According to Solana price analysis
shared on social media platform X by crypto analyst Ali Martinez, a
bullish cup and handle pattern on Solana’s chart is pointing to a
rally to an unprecedented $4,000. Cup And Handle Pattern Signals
Bullish Momentum The cup and handle pattern is a classic technical
analysis formation often associated with a strong bullish breakout.
This pattern, characterized by a rounded bottom (the cup) followed
by a smaller dip (the handle), is considered one of the more
reliable indicators in technical trading. Related Reading: Weekly
Bull Flag Appears On XRP Price Chart, Why A Double-Digit Is Still
Feasible In the case of Solana, the development of this pattern has
been in action since 2022 through different market cycles. The cup
phase began to take shape during the start of the 2022 bear market
and extended throughout the entire persistent downtrend. This
period also covers the consolidation phase in early 2023 and the
rally that took place in the second half of the year. Together,
these movements formed the rounded bottom of the cup, with the
latter rally highlighted by a break above five successive Fib
extension levels. Interestingly, Martinez’s analysis indicates that
Solana is currently in the handle phase for the past eight or so
months. As it stands, recent price action has seen the Solana price
peeking above the neckline of the cup and handle pattern,
culminating with the recent all-time high of $263 on November 23.
However, the Solana price has been highlighted by a correction
phase since reaching this all-time high, with a low of $205 in the
past 24 hours. Implications For Solana Price According to technical
analysis, the recent all-time high on November 23 coincides with
the 1.00 Fibonacci extension level when drawn from the 2022 bear
market low of $8, which serves as the lowest point in the cup and
handle pattern. Related Reading: This Analyst Correctly
Predicted The Bitcoin Flash Crash To $94,000, But There’s A New
Target However, the correction that ensued since the all-time high
has seen the Solana price retesting the breakout level of neckline
for the cup and handle pattern. Such a retest is a common
occurrence in cryptocurrency markets, especially after breaking
through long-standing resistance levels. With this in mind,
Martinez predicted a bounce at the neckline and a resumption of the
uptrend. Martinez’s prediction envisions a break above the
next four Fib extension levels up until 1.786 Fib extension. If
this trajectory were to play out this way, it would drive the
Solana price above multiple psychological thresholds, ultimately
surpassing $4,000 at the 1.786 extension level., representing a
1,700% increase from the current price of Solana. At the time of
writing, Solana is trading at $219. Featured image created with
Dall.E, chart from Tradingview.com
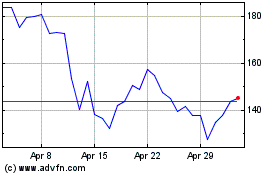
Solana (COIN:SOLUSD)
Historical Stock Chart
From Nov 2024 to Dec 2024

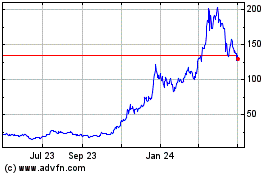
Solana (COIN:SOLUSD)
Historical Stock Chart
From Dec 2023 to Dec 2024
