Portman Ridge Finance Corp false 0001372807 0001372807 2023-08-09 2023-08-09
UNITED STATES
SECURITIES AND EXCHANGE COMMISSION
Washington, D.C. 20549
FORM 8-K
CURRENT REPORT
Pursuant to Section 13 or 15(d)
of the Securities Exchange Act of 1934
Date of Report (Date of earliest event reported): August 11, 2023 (August 9, 2023)
Portman Ridge Finance Corporation
(Exact name of registrant as specified in its charter)
|
|
|
|
|
| Delaware |
|
814-00735 |
|
20-5951150 |
| (State or other jurisdiction of incorporation) |
|
(Commission File Number) |
|
(IRS Employer Identification No.) |
|
|
|
| 650 Madison Avenue, 23rd Floor New York, New York |
|
10022 |
| (Address of principal executive offices) |
|
(Zip Code) |
(Registrant’s telephone number, including area code): (212) 891-2880
Not Applicable
(Former name or former address, if changed since last report)
Check the appropriate box below if the Form 8-K filing is intended to simultaneously satisfy the filing obligation of the registrant under any of the following provisions (see General Instructions A.2. below):
| ☐ |
Written communications pursuant to Rule 425 under the Securities Act (17 CFR 230.425) |
| ☐ |
Soliciting material pursuant to Rule 14a-12 under the Exchange Act (17 CFR 240.14a-12) |
| ☐ |
Pre-commencement communications pursuant to Rule 14d-2(b) under the Exchange Act (17 CFR 240.14d-2(b)) |
| ☐ |
Pre-commencement communications pursuant to Rule 13e-4(c) under the Exchange Act (17 CFR 240.13e-4(c)) |
Securities registered pursuant to Section 12(b) of the Exchange Act:
|
|
|
|
|
| Title of each class |
|
Trading
Symbol(s) |
|
Name of each exchange on which registered |
| Common Stock, par value $0.01 per share |
|
PTMN |
|
The NASDAQ Global Select Market |
Indicate by check mark whether the registrant is an emerging growth company as defined in Rule 405 of the Securities Act of 1933 (§ 230.405 of this chapter) or Rule 12b-2 of the Securities Exchange Act of 1934 (§ 240.12b-2 of this chapter).
Emerging growth company ☐
If an emerging growth company, indicate by check mark if the registrant has elected not to use the extended transition period for complying with any new or revised financial accounting standards provided pursuant to Section 13(a) of the Exchange Act. ☐
| Item 7.01 |
Regulation FD Disclosure. |
On August 9, 2023, Portman Ridge Finance Corporation (the “Company”) issued a press release announcing its financial results for the fiscal quarter ended June 30, 2023. A copy of the press release is being furnished as Exhibit 99.1 to this Current Report on Form 8-K and is incorporated herein by reference. Additionally, on August 10, 2023, the Company made available on its website, http://www.portmanridge.com/home, a supplemental investor presentation with respect to the second quarter 2023 earnings release. A copy of the investor presentation is being furnished as Exhibit 99.2 to this Current Report on Form 8-K and is incorporated herein by reference.
The information disclosed under this Item 7.01, including Exhibits 99.1 and 99.2 hereto, is being furnished and shall not be deemed “filed” for purposes of Section 18 of the Securities Exchange Act of 1934, as amended (the “Exchange Act”), or otherwise subject to the liabilities of that section, and shall not be deemed incorporated by reference into any filing made under the Securities Act of 1933, as amended (the “Securities Act”), or the Exchange Act, except as expressly set forth by specific reference in such filing.
| Item 9.01. |
Financial Statements and Exhibits. |
(d) Exhibits:
SIGNATURES
Pursuant to the requirements of the Securities Exchange Act of 1934, the Registrant has duly caused this report to be signed on its behalf by the undersigned hereunto duly authorized.
|
|
|
| PORTMAN RIDGE FINANCE CORPORATION |
|
|
| By: |
|
/s/ Jason T. Roos |
| Name: |
|
Jason T. Roos |
| Title: |
|
Chief Financial Officer |
Date: August 11, 2023
Exhibit 99.1

Portman Ridge Finance Corporation Announces Second Quarter 2023 Financial Results
August 9, 2023
Reports Strong Performance
with Elevated Total Investment Income, Core Investment Income and Net Investment Income Year-over-Year, While Also Continuing Share Repurchase Program in the Second Quarter of 2023
Announces Quarterly Distribution of $0.69 Per Share in the Third Quarter of 2023, Marking a $0.06 per Share Increase from the $0.63
Distribution Seen in the Third Quarter of 2022
NEW YORK, Aug. 09, 2023 (GLOBE NEWSWIRE) — Portman Ridge Finance Corporation (Nasdaq: PTMN)
(the “Company” or “Portman Ridge”) announced today its financial results for the second quarter ended June 30, 2023.
Second
Quarter 2023 Highlights
| |
• |
|
Total investment income for the second quarter of 2023 was $19.6 million, an increase of
$4.6 million as compared to $15.0 million for the second quarter of 2022 and a decrease of $0.7 million as compared to $20.3 million for the first quarter of 2023. |
| |
• |
|
Core investment income1, excluding the impact of
purchase price accounting, for the second quarter of 2023 was $19.2 million, an increase of $5.5 million as compared to $13.7 million for the second quarter of 2022 and a decrease of $0.1 million as compared to $19.3 million for
the first quarter of 2023. |
| |
• |
|
Net investment income (“NII”) for the second quarter of 2023 was $7.9 million ($0.83 per
share), an increase of $2.4 million as compared to $5.5 million ($0.57 per share) for the second quarter of 2022 and a decrease of $0.6 million as compared to $8.5 million ($0.89 per share) for the first quarter of 2023.
|
| |
• |
|
Core net investment income2 for the second quarter of
2023 was $7.6 million ($0.79 per share), an increase of $2.7 million as compared to $4.9 million ($0.51 per share) for the second quarter of 2022 and a decrease of $0.1 million as compared to $7.7 million ($0.80 per share) for
the first quarter of 2023. |
| |
• |
|
Total shares repurchased in open market transactions under the Renewed Stock Repurchase Program during the
quarter ended June 30, 2023 were 27,081 at an aggregate cost of approximately $552 thousand. |
Subsequent Events
| |
• |
|
Declared stockholder distribution of $0.69 per share for the third quarter of 2023, payable on
August 31, 2023 to stockholders of record at the close of business on August 22, 2023. This is a $0.06 per share distribution increase as compared to the third quarter of 2022. Including the distribution subsequent to the announcement of
full year 2022 earnings results, total stockholder distributions for 2023 amount to $2.06 per share. |
Management Commentary
| |
• |
|
Ted Goldthorpe, Chief Executive Officer of Portman Ridge, stated, “Continuing off the back of strong
earnings momentum seen in the first quarter of 2023, we are pleased to announce strong financial performance for Portman Ridge in both the second quarter of 2023 and the first half of 2023 overall. Our total investment income, core investment
income, and net investment income substantially increased as compared to the same three month and six month periods of last year as we continue to see the impact that rising rates have had in generating incremental revenue from our debt portfolio
investments. We believe we are well-positioned to take advantage of opportunities that arise from the current market environment by continuing to be selective and resourceful in our investment decision-making. Overall, our strong performance this
past quarter has allowed us to declare a dividend of $0.69 per share, marking a $0.06 per share distribution increase as compared to the third quarter of 2022. We believe we remain situated to continue to deliver attractive returns to our
shareholders throughout the second half of 2023.” |
Selected Financial Highlights
| |
• |
|
Total investments at fair value as of June 30, 2023 was $510.1 million; when excluding CLO funds,
Joint Ventures, and short-term investments, these investments are spread across 27 different industries and 104 different entities with an average par balance per entity of approximately $3.2 million. |
| |
• |
|
Weighted average contractual interest rate on our interest earning Debt Securities Portfolio as of June
30, 2023 was approximately 12.2%. |
| |
• |
|
Non-accruals on debt investments, as of June 30, 2023, were seven debt investments representing 0.8% and
2.6% of the Company’s investment portfolio at fair value and amortized cost, respectively. |
| |
• |
|
Net asset value (“NAV”) for the second quarter of 2023 was $215.0 million ($22.54 per
share), a decrease of $10.1 million ($1.02 per share) as compared to $225.1 million ($23.56 per share) for the first quarter of 2023. The decrease in NAV was predominately driven by $6.6 million ($0.69 per share) of realized and
unrealized losses on the CLO portfolio. |
| |
• |
|
Par value of outstanding borrowings, as of June 30, 2023, was $333.7 million with an asset coverage
ratio of total assets to total borrowings of 163%. On a net basis, leverage as of June 30, 2023 was 1.39x3 compared to net leverage of 1.39x3
as of March 31, 2023. |
| 1 |
Core investment income represents reported total investment income as determined in accordance with U.S.
generally accepted accounting principles, or U.S. GAAP, less the impact of purchase price discount accounting in connection with the Garrison Capital Inc. (“GARS”) and Harvest Capital Credit Corporation (“HCAP”) mergers. Portman
Ridge believes presenting core investment income and the related per share amount is useful and appropriate supplemental disclosure for analyzing its financial performance due to the unique circumstance giving rise to the purchase accounting
adjustment. However, core investment income is a non-U.S. GAAP measure and should not be considered as a replacement for total investment income and other earnings measures presented in accordance with U.S.
GAAP. Instead, core investment income should be reviewed only in connection with such U.S. GAAP measures in analyzing Portman Ridge’s financial performance. |
| 2 |
Core net investment income represents reported total net investment income as determined in accordance with
U.S. generally accepted accounting principles, or U.S. GAAP, less the impact of purchase price discount accounting in connection with the GARS and HCAP mergers, while also considering the impact of accretion from these mergers on expenses, such as
incentive fees. Portman Ridge believes presenting core net investment income and the related per share amount is useful and appropriate supplemental disclosure for analyzing its financial performance due to the unique circumstance giving rise to the
purchase accounting adjustment. However, core net investment income is a non-U.S. GAAP measure and should not be considered as a replacement for total net investment income and other earnings measures
presented in accordance with U.S. GAAP. Instead, core net investment income should be reviewed only in connection with such U.S. GAAP measures in analyzing Portman Ridge’s financial performance. |
| 3 |
Net leverage is calculated as the ratio between (A) debt, excluding unamortized debt issuance costs, less
available cash and cash equivalents, and restricted cash and (B) NAV. Portman Ridge believes presenting a net leverage ratio is useful and appropriate supplemental disclosure because it reflects the Company’s financial condition net of
$35.4 million and $46.1 million of cash and cash equivalents and restricted cash for the quarters ended June 30, 2023 and March 31, 2023, respectively. However, the net leverage ratio is a
non-U.S. GAAP measure and should not be considered as a replacement for the regulatory asset coverage ratio and other similar information presented in accordance with U.S. GAAP. Instead, the net leverage ratio
should be reviewed only in connection with such U.S. GAAP measures in analyzing Portman Ridge’s financial condition. |
Results of Operations
Operating results for the three months ended June 30, 2023 and June 30, 2022 were as follows:
|
|
|
|
|
|
|
|
|
|
|
|
|
|
|
|
|
| |
|
For the Three Months Ended
June 30, |
|
|
For the Six Months Ended
June 30, |
|
| |
|
2023 |
|
|
2022 |
|
|
2023 |
|
|
2022 |
|
| Total investment income |
|
$ |
19,626 |
|
|
$ |
15,044 |
|
|
$ |
39,953 |
|
|
$ |
31,988 |
|
|
|
|
|
|
|
|
|
|
|
|
|
|
|
|
|
|
| Total expenses |
|
|
11,711 |
|
|
|
9,522 |
|
|
|
23,509 |
|
|
|
18,558 |
|
|
|
|
|
|
|
|
|
|
|
|
|
|
|
|
|
|
| Net Investment Income |
|
|
7,915 |
|
|
|
5,522 |
|
|
|
16,444 |
|
|
|
13,430 |
|
|
|
|
|
|
|
|
|
|
|
|
|
|
|
|
|
|
| Net realized gain (loss) on investments |
|
|
(6,471 |
) |
|
|
(13,991 |
) |
|
|
(9,556 |
) |
|
|
(19,544 |
) |
|
|
|
|
|
|
|
|
|
|
|
|
|
|
|
|
|
| Net unrealized gain (loss) on investments |
|
|
(4,176 |
) |
|
|
113 |
|
|
|
(10,136 |
) |
|
|
2,256 |
|
|
|
|
|
|
|
|
|
|
|
|
|
|
|
|
|
|
| Tax (provision) benefit on realized and unrealized gains (losses) on investments |
|
|
(164 |
) |
|
|
(77 |
) |
|
|
407 |
|
|
|
(517 |
) |
|
|
|
|
|
|
|
|
|
|
|
|
|
|
|
|
|
| Net realized and unrealized appreciation (depreciation) on investments, net of taxes |
|
|
(10,811 |
) |
|
|
(13,955 |
) |
|
|
(19,285 |
) |
|
|
(17,805 |
) |
|
|
|
|
|
|
|
|
|
|
|
|
|
|
|
|
|
| Realized gains (losses) on extinguishments of debt |
|
|
(218 |
) |
|
|
— |
|
|
|
(218 |
) |
|
|
— |
|
|
|
|
|
|
|
|
|
|
|
|
|
|
|
|
|
|
| Net Increase (Decrease) in Net Assets Resulting from Operations |
|
$ |
(3,114 |
) |
|
$ |
(8,433 |
) |
|
$ |
(3,059 |
) |
|
$ |
(4,375 |
) |
|
|
|
|
|
|
|
|
|
|
|
|
|
|
|
|
|
| Net Increase (Decrease) In Net Assets Resulting from Operations per |
|
|
|
|
|
|
|
|
|
|
|
|
|
|
|
|
| Common Share: |
|
|
|
|
|
|
|
|
|
|
|
|
|
|
|
|
| Basic and Diluted: |
|
$ |
(0.33 |
) |
|
$ |
(0.88 |
) |
|
$ |
(0.32 |
) |
|
$ |
(0.45 |
) |
| Net Investment Income Per Common Share: |
|
|
|
|
|
|
|
|
|
|
|
|
|
|
|
|
| Basic and Diluted: |
|
$ |
0.83 |
|
|
$ |
0.57 |
|
|
$ |
1.72 |
|
|
$ |
1.39 |
|
| Weighted Average Shares of Common Stock Outstanding—Basic and Diluted |
|
|
9,541,722 |
|
|
|
9,634,870 |
|
|
|
9,548,424 |
|
|
|
9,666,298 |
|
Investment Income
The
composition of our investment income for the three and six months ended June 30, 2023 and June 30, 2022 was as follows:
|
|
|
|
|
|
|
|
|
|
|
|
|
|
|
|
|
| |
|
For the Three Months Ended
June 30, |
|
|
For the Six Months Ended
June 30, |
|
| ($ in thousands) |
|
2023 |
|
|
2022 |
|
|
2023 |
|
|
2022 |
|
| Interest from investments in debt excluding accretion |
|
$ |
14,156 |
|
|
$ |
9,275 |
|
|
$ |
28,261 |
|
|
$ |
19,087 |
|
| Purchase discount accounting |
|
|
427 |
|
|
|
1,303 |
|
|
|
1,469 |
|
|
|
3,115 |
|
| PIK Investment Income |
|
|
966 |
|
|
|
1,292 |
|
|
|
2,566 |
|
|
|
2,674 |
|
| CLO Income |
|
|
829 |
|
|
|
928 |
|
|
|
1,377 |
|
|
|
2,562 |
|
| JV Income |
|
|
2,329 |
|
|
|
2,071 |
|
|
|
4,788 |
|
|
|
4,179 |
|
| Service Fees |
|
|
919 |
|
|
|
175 |
|
|
|
1,492 |
|
|
|
371 |
|
|
|
|
|
|
|
|
|
|
|
|
|
|
|
|
|
|
| Investment Income |
|
$ |
19,626 |
|
|
|
15,044 |
|
|
$ |
39,953 |
|
|
$ |
31,988 |
|
|
|
|
|
|
|
|
|
|
|
|
|
|
|
|
|
|
| Less: Purchase discount accounting |
|
$ |
(427 |
) |
|
$ |
(1,303 |
) |
|
$ |
(1,469 |
) |
|
$ |
(3,115 |
) |
|
|
|
|
|
|
|
|
|
|
|
|
|
|
|
|
|
| Core Investment Income |
|
$ |
19,199 |
|
|
$ |
13,741 |
|
|
$ |
38,484 |
|
|
$ |
28,873 |
|
|
|
|
|
|
|
|
|
|
|
|
|
|
|
|
|
|
Fair Value of Investments
The composition of our investment portfolio as of June 30, 2023 and December 31, 2022 at cost and fair value was as follows:
|
|
|
|
|
|
|
|
|
|
|
|
|
|
|
|
|
|
|
|
|
|
|
|
|
| ($ in thousands) |
|
June 30, 2023
(Unaudited) |
|
|
December 31, 2022 |
|
| Security Type |
|
Cost/Amortized
Cost |
|
|
Fair Value |
|
|
%(4) |
|
|
Cost/Amortized
Cost |
|
|
Fair Value |
|
|
%(4) |
|
| Senior Secured Loan |
|
$ |
396,674 |
|
|
$ |
376,539 |
|
|
|
74 |
|
|
$ |
435,856 |
|
|
$ |
418,722 |
|
|
|
73 |
|
| Junior Secured Loan |
|
|
51,707 |
|
|
|
37,962 |
|
|
|
7 |
|
|
|
65,776 |
|
|
|
56,400 |
|
|
|
10 |
|
| Senior Unsecured Bond |
|
|
416 |
|
|
|
43 |
|
|
|
0 |
|
|
|
416 |
|
|
|
43 |
|
|
|
0 |
|
| Equity Securities |
|
|
28,901 |
|
|
|
20,013 |
|
|
|
4 |
|
|
|
28,848 |
|
|
|
21,905 |
|
|
|
4 |
|
| CLO Fund Securities |
|
|
25,577 |
|
|
|
12,996 |
|
|
|
3 |
|
|
|
34,649 |
|
|
|
20,453 |
|
|
|
3 |
|
| Asset Manager Affiliates(5) |
|
|
17,791 |
|
|
|
— |
|
|
|
— |
|
|
|
17,791 |
|
|
|
— |
|
|
|
— |
|
| Joint Ventures |
|
|
74,878 |
|
|
|
62,547 |
|
|
|
12 |
|
|
|
68,850 |
|
|
|
58,955 |
|
|
|
10 |
|
| Derivatives |
|
|
31 |
|
|
|
— |
|
|
|
— |
|
|
|
31 |
|
|
|
— |
|
|
|
— |
|
|
|
|
|
|
|
|
|
|
|
|
|
|
|
|
|
|
|
|
|
|
|
|
|
|
| Total |
|
$ |
595,975 |
|
|
$ |
510,100 |
|
|
|
100 |
% |
|
$ |
652,217 |
|
|
$ |
576,478 |
|
|
|
100 |
% |
| 4 |
Represents percentage of total portfolio at fair value |
| 5 |
Represents the equity investment in the Asset Manager Affiliates |
Liquidity and Capital Resources
As of June 30, 2023, the
Company had $333.7 million (par value) of borrowings outstanding at a current weighted average interest rate of 6.7%, of which $108.0 million par value had a fixed rate and $225.7 million par value had a floating rate. This balance
was comprised of $78.0 million of outstanding borrowings under the Senior Secured Revolving Credit Facility, $147.7 million of 2018-2 Secured Notes due 2029, and $108.0 million of 4.875% Notes due 2026.
As of June 30, 2023 and December 31, 2022, the fair value of investments and cash were as follows:
|
|
|
|
|
|
|
|
|
| ($ in thousands) |
|
|
|
|
|
|
| Security Type |
|
June 30, 2023 |
|
|
December 31, 2022 |
|
| Cash and cash equivalents |
|
$ |
20,254 |
|
|
$ |
5,148 |
|
| Restricted Cash |
|
|
15,192 |
|
|
|
27,983 |
|
| Senior Secured Loan |
|
|
376,539 |
|
|
|
418,722 |
|
| Junior Secured Loan |
|
|
37,962 |
|
|
|
56,400 |
|
| Senior Unsecured Bond |
|
|
43 |
|
|
|
43 |
|
| Equity Securities |
|
|
20,013 |
|
|
|
21,905 |
|
| CLO Fund Securities |
|
|
12,996 |
|
|
|
20,453 |
|
| Asset Manager Affiliates |
|
|
— |
|
|
|
— |
|
| Joint Ventures |
|
|
62,547 |
|
|
|
58,955 |
|
| Derivatives |
|
|
— |
|
|
|
— |
|
|
|
|
|
|
|
|
|
|
| Total |
|
$ |
545,546 |
|
|
$ |
609,609 |
|
As of June 30, 2023, the Company had unrestricted cash of $20.3 million and restricted cash of $15.2 million. This
compares to unrestricted cash of $11.9 million and restricted cash of $34.2 million as of March 31, 2023. As of June 30, 2023, the Company had $37.0 million of available borrowing capacity under the Senior Secured Revolving Credit
Facility, and no remaining borrowing capacity under the 2018-2 Secured Notes.
Interest Rate Risk
The Company’s investment income is affected by fluctuations in various interest rates, including LIBOR, SOFR and prime rates.
As of June 30, 2023, approximately 90.9% of our Debt Securities Portfolio at par value were either floating rate with a spread to an interest rate index
such as LIBOR, SOFR or the prime rate. 79.5% of these floating rate loans contain floors ranging between 0.50% and 2.00%. We generally expect that future portfolio investments will predominately be floating rate investments.
In periods of rising or lowering interest rates, the cost of the portion of debt associated with the 4.875% Notes Due 2026 would remain the same, given that
this debt is at a fixed rate, while the interest rate on borrowings under the Revolving Credit Facility would fluctuate with changes in interest rates.
Generally, the Company would expect that an increase in the base rate index for floating rate investment assets would increase gross investment income and a
decrease in the base rate index for such assets would decrease gross investment income (in either case, such increase/decrease may be limited by interest rate floors/minimums for certain investment assets).
|
|
|
|
|
|
|
|
|
|
|
|
|
| |
|
Impact on net investment income from
a change in interest rates at: |
|
| ($ in thousands) |
|
1% |
|
|
2% |
|
|
3% |
|
| Increase in interest rate |
|
$ |
1,797 |
|
|
$ |
3,594 |
|
|
$ |
5,392 |
|
| Decrease in interest rate |
|
$ |
(1,797 |
) |
|
$ |
(3,594 |
) |
|
$ |
(5,392 |
) |
Conference Call and Webcast
We will hold a conference call on August 10, 2023, at 9:00 am Eastern Time to discuss our second quarter 2023 financial results. To access the call,
stockholders, prospective stockholders and analysts should dial (646) 307-1963 approximately 10 minutes prior to the start of the conference call and use the conference ID 3296365.
A live audio webcast of the conference call can be accessed via the Internet, on a listen-only basis on the
Company’s website www.portmanridge.com in the Investor Relations section under Events and Presentations. The webcast can also be accessed by clicking the following link: https://edge.media-server.com/mmc/p/fx5skorp. The
online archive of the webcast will be available on the Company’s website shortly after the call.
About Portman Ridge Finance Corporation
Portman Ridge Finance Corporation (Nasdaq: PTMN) is a publicly traded, externally managed investment company that has elected to be regulated as a business
development company under the Investment Company Act of 1940. Portman Ridge’s middle market investment business originates, structures, finances and manages a portfolio of term loans, mezzanine investments and selected equity securities in
middle market companies. Portman Ridge’s investment activities are managed by its investment adviser, Sierra Crest Investment Management LLC, an affiliate of BC Partners Advisors, LP.
Portman Ridge’s filings with the Securities and Exchange Commission (the “SEC”), earnings releases, press releases and other financial,
operational and governance information are available on the Company’s website at www.portmanridge.com.
About BC Partners Advisors L.P. and
BC Partners Credit
BC Partners is a leading international investment firm with over €40 billion of assets under management in private
equity, private credit and real estate strategies. Established in 1986, BC Partners has played an active role in developing the European buyout market for three decades. Today, BC Partners executives operate across markets as an integrated team
through the firm’s offices in North America and Europe. Since inception, BC Partners has completed 117 private equity investments in companies with a total enterprise value of €149 billion and is currently investing its eleventh
private equity fund. For more information, please visit www.bcpartners.com.
BC Partners Credit was
launched in February 2017 and has pursued a strategy focused on identifying attractive credit opportunities in any market environment and across sectors, leveraging the deal sourcing and infrastructure made available from BC Partners.
Cautionary Statement Regarding Forward-Looking Statements
This press release contains forward-looking statements. The matters discussed in this press release, as well as in future oral and written statements by
management of Portman Ridge Finance Corporation, that are forward-looking statements are based on current management expectations that involve substantial risks and uncertainties which could cause actual results to differ materially from the results
expressed in, or implied by, these forward-looking statements.
Forward-looking statements relate to future events or our future financial performance and
include, but are not limited to, projected financial performance, expected development of the business, plans and expectations about future investments and the future liquidity of the Company. We generally identify forward-looking statements by
terminology such as “may,” “will,” “should,” “expects,” “plans,” “anticipates,” “could,” “intends,” “target,” “projects,” “outlook”,
“contemplates,” “believes,” “estimates,” “predicts,” “potential” or “continue” or the negative of these terms or other similar words. Forward-looking statements are based upon current
plans, estimates and expectations that are subject to risks, uncertainties, and assumptions. Should one or more of these risks or uncertainties materialize, or should underlying assumptions prove to be incorrect, actual results may vary materially
from those indicated or anticipated by such forward-looking statements.
Important assumptions include our ability to originate new investments, and
achieve certain margins and levels of profitability, the availability of additional capital, and the ability to maintain certain debt to asset ratios. In light of these and other uncertainties, the inclusion of a projection or forward-looking
statement in this press release should not be regarded as a representation that such plans, estimates, expectations or objectives will be achieved. Important factors that could cause actual results to differ materially from such plans, estimates or
expectations include, among others, (1) uncertainty of the expected financial performance of the Company; (2) expected synergies and savings associated with. merger transactions effectuated by the Company; (3) the ability of the
Company and/or its adviser to implement its business strategy; (4) evolving legal, regulatory and tax regimes; (5) changes in general economic and/or industry specific conditions, including but not limited to the impact of inflation;
(6) the impact of increased competition; (7) business prospects and the prospects of the Company’s portfolio companies; (8) contractual arrangements with third parties; (9) any future financings by the Company; (10) the
ability of Sierra Crest Investment Management LLC to attract and retain highly talented professionals; (11) the Company’s ability to fund any unfunded commitments; (12) any future distributions by the Company; (13) changes in
regional or national economic conditions, including but not limited to the impact of the COVID-19 pandemic, and their impact on the industries in which we invest; and (14) other changes in the conditions of
the industries in which we invest and other factors enumerated in our filings with the SEC. The forward-looking statements should be read in conjunction with the risks and uncertainties discussed in the Company’s filings with the SEC, including
the Company’s most recent Form 10-K and other SEC filings. We do not undertake to publicly update or revise any forward-looking statements, whether as a result of new information, future events or
otherwise, except as required to be reported under the rules and regulations of the SEC.
Contacts:
Portman Ridge Finance Corporation
650 Madison Avenue,
23rd floor
New York, NY 10022
info@portmanridge.com
Jason Roos
Jason.Roos@bcpartners.com
(212) 891-2880
The Equity Group Inc.
Lena Cati
lcati@equityny.com
(212) 836-9611
Val
Ferraro
vferraro@equityny.com
(212) 836-9633
PORTMAN RIDGE FINANCE CORPORATION
CONSOLIDATED BALANCE SHEETS
(in thousands, except share and per share amounts)
|
|
|
|
|
|
|
|
|
| |
|
June 30, 2023 |
|
|
December 31, 2022 |
|
| |
|
(Unaudited) |
|
|
|
|
| ASSETS |
|
|
|
|
|
|
|
|
| Investments at fair value: |
|
|
|
|
|
|
|
|
|
Non-controlled/non-affiliated
investments (amortized cost: 2023 - $465,608; 2022 - $518,699) |
|
$ |
422,072 |
|
|
$ |
483,698 |
|
| Non-controlled affiliated investments (amortized cost:
2023 - $72,325; 2022 - $75,196) |
|
|
71,411 |
|
|
|
73,827 |
|
| Controlled affiliated investments (cost: 2023 - $58,042; 2022 - $58,322) |
|
|
16,617 |
|
|
|
18,953 |
|
|
|
|
|
|
|
|
|
|
| Total Investments at Fair Value (cost: 2023 - $595,975; 2022 - $652,217) |
|
$ |
510,100 |
|
|
$ |
576,478 |
|
| Cash and cash equivalents |
|
|
20,254 |
|
|
|
5,148 |
|
| Restricted cash |
|
|
15,192 |
|
|
|
27,983 |
|
| Interest receivable |
|
|
5,245 |
|
|
|
4,828 |
|
| Receivable for unsettled trades |
|
|
1,755 |
|
|
|
1,395 |
|
| Due from affiliates |
|
|
1,896 |
|
|
|
930 |
|
| Other assets |
|
|
2,802 |
|
|
|
2,724 |
|
|
|
|
|
|
|
|
|
|
| Total Assets |
|
$ |
557,244 |
|
|
$ |
619,486 |
|
|
|
|
|
|
|
|
|
|
| LIABILITIES |
|
|
|
|
|
|
|
|
| 2018-2 Secured Notes (net of discount of: 2023 - $938;
2022 - $1,226) |
|
$ |
146,734 |
|
|
$ |
176,937 |
|
| 4.875% Notes Due 2026 (net of discount of: 2023 - $1,467; 2022 - $1,704; net of deferred financing
costs of: 2023 - $692; 2022 - $818) |
|
|
105,841 |
|
|
|
105,478 |
|
| Great Lakes Portman Ridge Funding LLC Revolving Credit Facility (net of deferred financing costs
of: 2023 - $941; 2022 - $1,107) |
|
|
77,059 |
|
|
|
90,893 |
|
| Payable for unsettled trades |
|
|
422 |
|
|
|
1,276 |
|
| Accounts payable, accrued expenses and other liabilities |
|
|
3,988 |
|
|
|
4,614 |
|
| Accrued interest payable |
|
|
3,618 |
|
|
|
3,722 |
|
| Due to affiliates |
|
|
1,021 |
|
|
|
900 |
|
| Management and incentive fees payable |
|
|
3,548 |
|
|
|
3,543 |
|
|
|
|
|
|
|
|
|
|
| Total Liabilities |
|
$ |
342,231 |
|
|
$ |
387,363 |
|
| NET ASSETS |
|
|
|
|
|
|
|
|
| Common stock, par value $0.01 per share, 20,000,000 common shares authorized; 9,935,250 issued,
and 9,537,236 outstanding at June 30, 2023, and 9,916,856 issued, and 9,581,536 outstanding at December 31, 2022 |
|
$ |
95 |
|
|
$ |
96 |
|
| Capital in excess of par value |
|
|
735,808 |
|
|
|
736,784 |
|
| Total distributable (loss) earnings |
|
|
(520,890 |
) |
|
|
(504,757 |
) |
|
|
|
|
|
|
|
|
|
| Total Net Assets |
|
$ |
215,013 |
|
|
$ |
232,123 |
|
|
|
|
|
|
|
|
|
|
| Total Liabilities and Net Assets |
|
$ |
557,244 |
|
|
$ |
619,486 |
|
|
|
|
|
|
|
|
|
|
| Net Asset Value Per Common Share |
|
$ |
22.54 |
|
|
$ |
24.23 |
|
PORTMAN RIDGE FINANCE CORPORATION
CONSOLIDATED STATEMENTS OF OPERATIONS
(in thousands, except share and per share amounts)
|
|
|
|
|
|
|
|
|
|
|
|
|
|
|
|
|
| |
|
For the Three Months
Ended June 30, |
|
|
For the Six Months Ended
June 30, |
|
| |
|
2023 |
|
|
2022 |
|
|
2023 |
|
|
2022 |
|
| INVESTMENT INCOME |
|
|
|
|
|
|
|
|
|
|
|
|
|
|
|
|
| Interest income: |
|
|
|
|
|
|
|
|
|
|
|
|
|
|
|
|
|
Non-controlled/non-affiliated
investments |
|
$ |
14,786 |
|
|
$ |
10,649 |
|
|
$ |
29,632 |
|
|
$ |
23,316 |
|
| Non-controlled affiliated investments |
|
|
626 |
|
|
|
857 |
|
|
|
1,475 |
|
|
|
1,448 |
|
|
|
|
|
|
|
|
|
|
|
|
|
|
|
|
|
|
| Total interest income |
|
$ |
15,412 |
|
|
$ |
11,506 |
|
|
$ |
31,107 |
|
|
$ |
24,764 |
|
| Payment-in-kind
income: |
|
|
|
|
|
|
|
|
|
|
|
|
|
|
|
|
|
Non-controlled/non-affiliated
investments(1) |
|
$ |
859 |
|
|
$ |
1,199 |
|
|
$ |
2,386 |
|
|
$ |
2,325 |
|
| Non-controlled affiliated investments |
|
|
107 |
|
|
|
73 |
|
|
|
180 |
|
|
|
329 |
|
| Controlled affiliated investments |
|
|
— |
|
|
|
20 |
|
|
|
— |
|
|
|
20 |
|
|
|
|
|
|
|
|
|
|
|
|
|
|
|
|
|
|
| Total
payment-in-kind income |
|
$ |
966 |
|
|
$ |
1,292 |
|
|
$ |
2,566 |
|
|
$ |
2,674 |
|
| Dividend income: |
|
|
|
|
|
|
|
|
|
|
|
|
|
|
|
|
| Non-controlled affiliated investments |
|
$ |
1,864 |
|
|
$ |
1,005 |
|
|
$ |
3,248 |
|
|
$ |
1,950 |
|
| Controlled affiliated investments |
|
|
465 |
|
|
|
1,066 |
|
|
|
1,540 |
|
|
|
2,229 |
|
|
|
|
|
|
|
|
|
|
|
|
|
|
|
|
|
|
| Total dividend income |
|
$ |
2,329 |
|
|
$ |
2,071 |
|
|
$ |
4,788 |
|
|
$ |
4,179 |
|
| Fees and other income: |
|
|
|
|
|
|
|
|
|
|
|
|
|
|
|
|
|
Non-controlled/non-affiliated
investments |
|
$ |
905 |
|
|
$ |
175 |
|
|
$ |
1,478 |
|
|
$ |
371 |
|
| Non-controlled affiliated investments |
|
|
14 |
|
|
|
— |
|
|
|
14 |
|
|
|
— |
|
|
|
|
|
|
|
|
|
|
|
|
|
|
|
|
|
|
| Total fees and other income |
|
$ |
919 |
|
|
$ |
175 |
|
|
$ |
1,492 |
|
|
$ |
371 |
|
|
|
|
|
|
|
|
|
|
|
|
|
|
|
|
|
|
| Total investment income |
|
$ |
19,626 |
|
|
$ |
15,044 |
|
|
$ |
39,953 |
|
|
$ |
31,988 |
|
|
|
|
|
|
|
|
|
|
|
|
|
|
|
|
|
|
| EXPENSES |
|
|
|
|
|
|
|
|
|
|
|
|
|
|
|
|
| Management fees |
|
$ |
1,869 |
|
|
$ |
2,088 |
|
|
$ |
3,822 |
|
|
$ |
4,223 |
|
| Performance-based incentive fees |
|
|
1,680 |
|
|
|
1,169 |
|
|
|
3,488 |
|
|
|
2,847 |
|
| Interest and amortization of debt issuance costs |
|
|
6,372 |
|
|
|
3,889 |
|
|
|
12,704 |
|
|
|
7,233 |
|
| Professional fees |
|
|
699 |
|
|
|
879 |
|
|
|
1,302 |
|
|
|
1,724 |
|
| Administrative services expense |
|
|
659 |
|
|
|
822 |
|
|
|
1,330 |
|
|
|
1,669 |
|
| Other general and administrative expenses |
|
|
432 |
|
|
|
675 |
|
|
|
863 |
|
|
|
862 |
|
|
|
|
|
|
|
|
|
|
|
|
|
|
|
|
|
|
| Total expenses |
|
$ |
11,711 |
|
|
$ |
9,522 |
|
|
$ |
23,509 |
|
|
$ |
18,558 |
|
|
|
|
|
|
|
|
|
|
|
|
|
|
|
|
|
|
| NET INVESTMENT INCOME |
|
$ |
7,915 |
|
|
$ |
5,522 |
|
|
$ |
16,444 |
|
|
$ |
13,430 |
|
|
|
|
|
|
|
|
|
|
|
|
|
|
|
|
|
|
| REALIZED AND UNREALIZED GAINS (LOSSES) ON INVESTMENTS |
|
|
|
|
|
|
|
|
|
|
|
|
|
|
|
|
| Net realized gains (losses) from investment transactions: |
|
|
|
|
|
|
|
|
|
|
|
|
|
|
|
|
|
Non-controlled/non-affiliated
investments |
|
$ |
(5,267 |
) |
|
$ |
(14,109 |
) |
|
$ |
(8,352 |
) |
|
$ |
(17,779 |
) |
| Non-controlled affiliated investments |
|
|
(1,124 |
) |
|
|
118 |
|
|
|
(1,124 |
) |
|
|
330 |
|
| Controlled affiliated investments |
|
|
(80 |
) |
|
|
— |
|
|
|
(80 |
) |
|
|
— |
|
| Derivatives |
|
|
— |
|
|
|
— |
|
|
|
— |
|
|
|
(2,095 |
) |
|
|
|
|
|
|
|
|
|
|
|
|
|
|
|
|
|
| Net realized gain (loss) on investments |
|
$ |
(6,471 |
) |
|
$ |
(13,991 |
) |
|
$ |
(9,556 |
) |
|
$ |
(19,544 |
) |
| Net change in unrealized appreciation (depreciation) on: |
|
|
|
|
|
|
|
|
|
|
|
|
|
|
|
|
|
Non-controlled/non-affiliated
investments |
|
$ |
(5,478 |
) |
|
$ |
4,870 |
|
|
$ |
(8,535 |
) |
|
$ |
5,699 |
|
| Non-controlled affiliated investments |
|
|
766 |
|
|
|
(1,329 |
) |
|
|
455 |
|
|
|
(1,212 |
) |
| Controlled affiliated investments |
|
|
536 |
|
|
|
(3,428 |
) |
|
|
(2,056 |
) |
|
|
(4,673 |
) |
| Derivatives |
|
|
— |
|
|
|
— |
|
|
|
— |
|
|
|
2,442 |
|
|
|
|
|
|
|
|
|
|
|
|
|
|
|
|
|
|
| Net unrealized gain (loss) on investments |
|
$ |
(4,176 |
) |
|
$ |
113 |
|
|
$ |
(10,136 |
) |
|
$ |
2,256 |
|
|
|
|
|
|
|
|
|
|
|
|
|
|
|
|
|
|
| Tax (provision) benefit on realized and unrealized gains (losses) on investments |
|
$ |
(164 |
) |
|
$ |
(77 |
) |
|
$ |
407 |
|
|
$ |
(517 |
) |
|
|
|
|
|
|
|
|
|
|
|
|
|
|
|
|
|
| Net realized and unrealized appreciation (depreciation) on investments, net of taxes |
|
$ |
(10,811 |
) |
|
$ |
(13,955 |
) |
|
$ |
(19,285 |
) |
|
$ |
(17,805 |
) |
|
|
|
|
|
|
|
|
|
|
|
|
|
|
|
|
|
| Realized gains (losses) on extinguishments of debt |
|
$ |
(218 |
) |
|
$ |
— |
|
|
$ |
(218 |
) |
|
$ |
— |
|
|
|
|
|
|
|
|
|
|
|
|
|
|
|
|
|
|
| NET INCREASE (DECREASE) IN NET ASSETS RESULTING FROM OPERATIONS |
|
$ |
(3,114 |
) |
|
$ |
(8,433 |
) |
|
$ |
(3,059 |
) |
|
$ |
(4,375 |
) |
|
|
|
|
|
|
|
|
|
|
|
|
|
|
|
|
|
| Net Increase (Decrease) In Net Assets Resulting from Operations per Common Share: |
|
|
|
|
|
|
|
|
|
|
|
|
|
|
|
|
| Basic and Diluted: |
|
$ |
(0.33 |
) |
|
$ |
(0.88 |
) |
|
$ |
(0.32 |
) |
|
$ |
(0.45 |
) |
| Net Investment Income Per Common Share: |
|
|
|
|
|
|
|
|
|
|
|
|
|
|
|
|
| Basic and Diluted: |
|
$ |
0.83 |
|
|
$ |
0.57 |
|
|
$ |
1.72 |
|
|
$ |
1.39 |
|
| Weighted Average Shares of Common Stock Outstanding—Basic and Diluted |
|
|
9,541,722 |
|
|
|
9,634,870 |
|
|
|
9,548,424 |
|
|
|
9,666,298 |
|
| (1) |
During the three and six months ended June 30, 2023, the Company received $191.2 thousand and $492.4 thousand,
respectively of non-recurring fee income that was paid in-kind and included in this financial statement line item. |

Source: Portman Ridge Finance Corporation
Exhibit 99.2 2023 Q2 Earnings Presentation August 10, 2023
Important Information Cautionary Statement Regarding Forward-Looking
Statements This presentation contains forward-looking statements. The matters discussed in this presentation, as well as in future oral and written statements by management of Portman Ridge Finance Corporation (“PTMN”, “Portman
Ridge” or the “Company”), that are forward-looking statements are based on current management expectations that involve substantial risks and uncertainties which could cause actual results to differ materially from the results
expressed in, or implied by, these forward-looking statements. Forward-looking statements relate to future events or our future financial performance and include, but are not limited to, projected financial performance, expected development of the
business, plans and expectations about future investments, our contractual arrangements and relationships with third parties, the ability of our portfolio companies to achieve their objectives, the ability of the Company’s investment adviser
to attract and retain highly talented professionals, our ability to maintain our qualification as a regulated investment company and as a business development company, our compliance with covenants under our borrowing arrangements, and the future
liquidity of the Company. We generally identify forward-looking statements by terminology such as may, will, should, expects, plans, anticipates, could, intends, target, projects, “outlook”, contemplates, believes, estimates, predicts,
potential or continue or the negative of these terms or other similar words. Forward-looking statements are based upon current plans, estimates and expectations that are subject to risks, uncertainties and assumptions. Should one or more of these
risks or uncertainties materialize, or should underlying assumptions prove to be incorrect, actual results may vary materially from those indicated or anticipated by such forward-looking statements. Forward-looking statements are subject to change
at any time based upon economic, market or other conditions, including with respect to the impact of the COVID-19 pandemic and its effects on the Company and its portfolio companies’ results of operations and financial condition. More
information on these risks and other potential factors that could affect the Company’s financial results, including important factors that could cause actual results to differ materially from plans, estimates or expectations included herein,
is included in the Company’s filings with the Securities and Exchange Commission (the “SEC”), including in the “Risk Factors” and “Management's Discussion and Analysis of Financial Condition and Results of
Operations” sections of the Company’s most recently filed quarterly report on Form 10-Q and annual report on Form 10-K, as well as in subsequent filings. In light of these and other uncertainties, the inclusion of a projection or
forward-looking statement in this presentation should not be regarded as a representation by us that our plans and objectives will be achieved. We do not undertake to publicly update or revise any forward-looking statements, whether as a result of
new information, future events or otherwise, except as required to be reported under the rules and regulations of the SEC. 2

Q2’23 Highlights Second Quarter 2023 Highlights ▪ Total
investment income for the second quarter of 2023 was $19.6 million, an increase of $4.6 million as compared to $15.0 million for the second quarter of 2022 and a decrease of $0.7 million as compared to $20.3 million for the first quarter of 2023.
(1) ▪ Core total investment income , excluding the impact of purchase price accounting, for the second quarter of 2023 was $19.2 million, an increase of $5.5 million as compared to $13.7 million for the second quarter of 2022 and a decrease of
$0.1 million as compared to $19.3 million for the first quarter of 2023. ▪ Net investment income (“NII”) for the second quarter of 2023 was $7.9 million ($0.83 per share), an increase of $2.4 million as compared to $5.5 million
($0.57 per share) for the second quarter of 2022 and a decrease of $0.6 million as compared to $8.5 million ($0.89 per share) for the first quarter of 2023. (2) ▪ Core net investment income for the second quarter of 2023 was $7.6 million
($0.79 per share), an increase of $2.7 million as compared to $4.9 million ($0.51 per share) for the second quarter of 2022 and a decrease of $0.1 million as compared to $7.7 million ($0.80 per share) for the first quarter of 2023. ▪ Total
shares repurchased in open market transactions under the Renewed Stock Repurchase Program during the quarter ended June 30, 2023 were 27,081 at an aggregate cost of approximately $552 thousand. ▪ Total investments at fair value as of June 30,
2023 was $510.1 million; when excluding CLO funds, Joint Ventures, and short-term investments, these investments are spread across 27 different industries and 104 different entities with an average par balance per entity of approximately $3.2
million. ▪ Weighted average contractual interest rate on our interest earning Debt Securities Portfolio as of June 30, 2023 was approximately 12.2%. ▪ Non-accruals on debt investments, as of June 30, 2023, were seven debt investments
representing 0.8% and 2.6% of the Company’s investment portfolio at fair value and amortized cost, respectively. ▪ Net asset value (“NAV”) for the second quarter of 2023 was $215.0 million ($22.54 per share), a decrease of
$10.1 million ($1.02 per share) as compared to $225.1 million ($23.56 per share) for the first quarter of 2023. The decrease in NAV was predominately driven by $6.6 million ($0.69 per share) of realized and unrealized losses on the CLO portfolio.
▪ Par value of outstanding borrowings, as of June 30, 2023, was $333.7 million with an asset coverage ratio of total assets to total borrowings of 163%. On a net basis, leverage as of (3) (3) June 30, 2023 was 1.39x compared to net leverage of
1.39x as of March 31, 2023. ▪ Increased Stockholder distribution from $0.63 in the third quarter of 2022 to $0.69 in the third quarter of 2023. Including the distribution subsequent to the announcement of full year 2022 earnings results, total
stockholder distributions for 2023 amount to $2.06 per share. (1) Core investment income represents reported total investment income as determined in accordance with U.S. generally accepted accounting principles, or U.S. GAAP, less the impact of
purchase price discount accounting in connection with the Garrison Capital Inc. (“GARS”) and Harvest Capital Credit Corporation (“HCAP”) mergers. Portman Ridge believes presenting core investment income and the related per
share amount is useful and appropriate supplemental disclosure for analyzing its financial performance due to the unique circumstance giving rise to the purchase accounting adjustment. However, core investment income is a non-U.S. GAAP measure and
should not be considered as a replacement for total investment income and other earnings measures presented in accordance with U.S. GAAP. Instead, core investment income should be reviewed only in connection with such U.S. GAAP measures in analyzing
Portman Ridge’s financial performance. (2) Core net investment income represents reported total net investment income as determined in accordance with U.S. generally accepted accounting principles, or U.S. GAAP, less the impact of purchase
price discount accounting in connection with the GARS and HCAP mergers, while also considering the impact of accretion from these mergers on expenses, such as incentive fees. Portman Ridge believes presenting core net investment income and the
related per share amount is useful and appropriate supplemental disclosure for analyzing its financial performance due to the unique circumstance giving rise to the purchase accounting adjustment. However, core net investment income is a non-U.S.
GAAP measure and should not be considered as a replacement for total net investment income and other earnings measures presented in accordance with U.S. GAAP. Instead, core net investment income should be reviewed only in connection with such U.S.
GAAP measures in analyzing Portman Ridge’s financial performance. See slide 8 for a presentation of Reported net investment income in comparison to Core net investment income and a reconciliation thereof. 3 (3) Net leverage is calculated as
the ratio between (A) debt, excluding unamortized debt issuance costs, less available cash and cash equivalents, and restricted cash and (B) NAV. Portman Ridge believes presenting a net leverage ratio is useful and appropriate supplemental
disclosure because it reflects the Company’s financial condition net of $35.4 million and $46.1 million of cash and cash equivalents and restricted cash for the quarters ended June 30, 2023 and March 31, 2023, respectively. However, the net
leverage ratio is a non-U.S. GAAP measure and should not be considered as a replacement for the regulatory asset coverage ratio and other similar information presented in accordance with U.S. GAAP. Instead, the net leverage ratio should be reviewed
only in connection with such U.S. GAAP measures in analyzing Portman Ridge’s financial condition.

Financial Highlights ($ in thousands Q1 2023 Q2 2023 Interest from
investments in debt excluding accretion $14,105 $14,156 Purchase discount accounting 1,042 427 PIK Investment Income 1,600 966 CLO Income 548 829 JV Income 2,459 2 ,329 Service Fees 573 919 Investment Income $20,327 $19,626 Less: Purchase discount
accounting (1,042) (427) (1) Core investment income $19,285 $19,199 Expenses: Management fees 1,953 1,869 Performance-based incentive fees 1 ,808 1 ,680 Interest and amortization of debt issuance costs 6,332 6 ,372 Professional fees 603 699
Administrative services expense 671 659 Other general and administrative expenses 431 432 Total expenses $11,798 $11,711 (2) Core net investment income $7,669 $7,563 Net realized gain (loss) on investments (3,085) (6,471) Net unrealized gain (loss)
on investments (5,960) (4,176) Tax (provision) benefit on realized and unrealized gains (losses) on investments 571 (164) Realized gains (losses) on extinguishments of debt - (218) Net increase/(decrease) in Core net assets resulting from operations
($805) ($3,466) Per Share Q1 2023 Q2 2023 Core Net Investment Income $0.80 $0.79 Net Realized and Unrealized Gain / (Loss) ($0.95) ($1.12) Net Core Earnings ($0.08) ($0.36) Distributions declared $0.69 $0.69 Net Asset Value $23.56 $22.54 (1) Core
investment income represents reported total investment income as determined in accordance with U.S. generally accepted accounting principles, or U.S. GAAP, less the impact of purchase price discount accounting in connection with the GARS and HCAP
mergers. Portman Ridge believes presenting core investment income and the related per share amount is useful and appropriate supplemental disclosure for analyzing its financial performance due to the unique circumstance giving rise to the purchase
accounting adjustment. However, core investment income is a non-U.S. GAAP measure and should not be considered as a replacement for total investment income and other earnings measures presented in accordance with U.S. GAAP. Instead, core investment
income should be reviewed only in connection with such U.S. GAAP measures in analyzing Portman Ridge’s financial performance. (2) Core net investment income represents reported total net investment income as determined in accordance with U.S.
generally accepted accounting principles, or U.S. GAAP, less the impact of purchase price discount accounting in connection with the GARS and HCAP mergers, while also considering the impact of accretion from these mergers on expenses, such as
incentive fees. Portman Ridge believes presenting core net investment income and the related per share amount is useful and 4 appropriate supplemental disclosure for analyzing its financial performance due to the unique circumstance giving rise to
the purchase accounting adjustment. However, core net investment income is a non-U.S. GAAP measure and should not be considered as a replacement for total net investment income and other earnings measures presented in accordance with U.S. GAAP.
Instead, core net investment income should be reviewed only in connection with such U.S. GAAP measures in analyzing Portman Ridge’s financial performance. See slide 8 for a presentation of Reported net investment income in comparison to Core
net investment income and a reconciliation thereof.
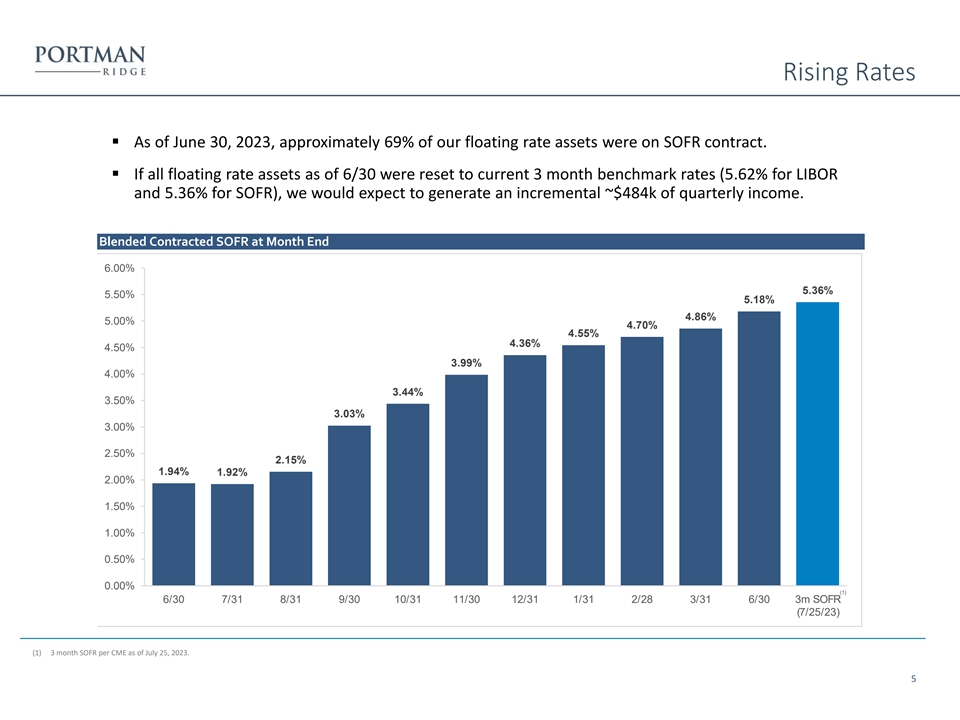
Rising Rates ▪ As of June 30, 2023, approximately 69% of our
floating rate assets were on SOFR contract. ▪ If all floating rate assets as of 6/30 were reset to current 3 month benchmark rates (5.62% for LIBOR and 5.36% for SOFR), we would expect to generate an incremental ~$484k of quarterly income.
Blended Contracted SOFR at Month End 6.00% 5.36% 5.50% 5.18% 4.86% 5.00% 4.70% 4.55% 4.36% 4.50% 3.99% 4.00% 3.44% 3.50% 3.03% 3.00% 2.50% 2.15% 1.94% 1.92% 2.00% 1.50% 1.00% 0.50% 0.00% (1) 6/30 7/31 8/31 9/30 10/31 11/30 12/31 1/31 2/28 3/31 6/30
3m SOFR (7/25/23) (1) 3 month SOFR per CME as of July 25, 2023. 5

Limited Repayment Activity ▪ Over the last three years, Portman
has experienced an average of $1.4 million in income related to repayment / prepayment activity as compared to the current quarter of $0.4 million. 6
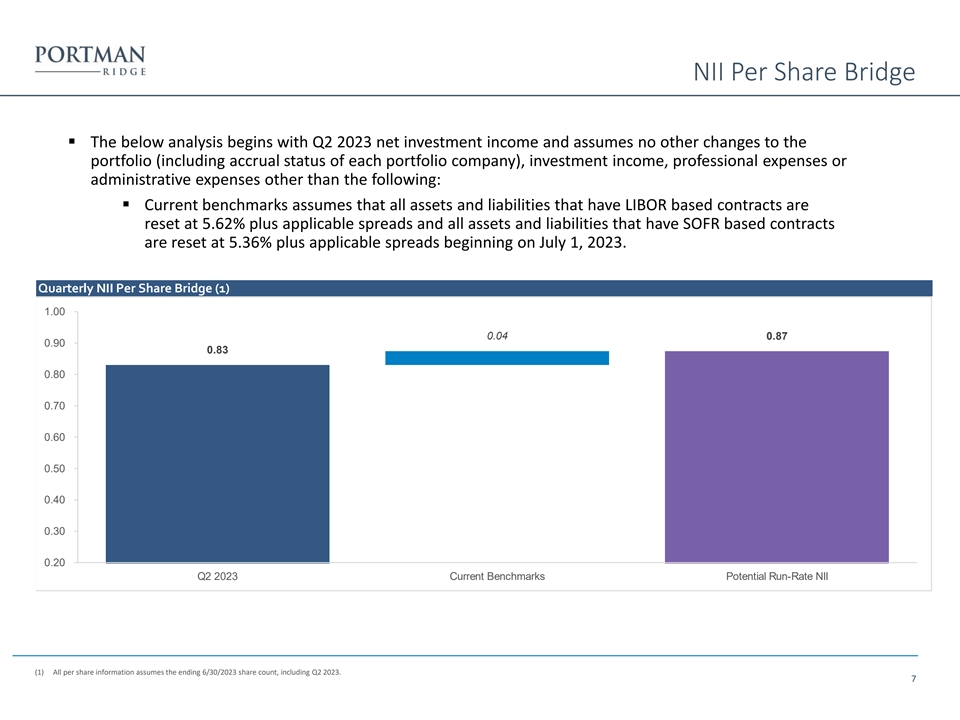
NII Per Share Bridge ▪ The below analysis begins with Q2 2023 net
investment income and assumes no other changes to the portfolio (including accrual status of each portfolio company), investment income, professional expenses or administrative expenses other than the following: ▪ Current benchmarks assumes
that all assets and liabilities that have LIBOR based contracts are reset at 5.62% plus applicable spreads and all assets and liabilities that have SOFR based contracts are reset at 5.36% plus applicable spreads beginning on July 1, 2023. Quarterly
NII Per Share Bridge (1) 1.00 0.04 0.87 0.90 0.83 0.80 0.70 0.60 0.50 0.40 0.30 0.20 Q2 2023 Current Benchmarks Potential Run-Rate NII (1) All per share information assumes the ending 6/30/2023 share count, including Q2 2023. 7
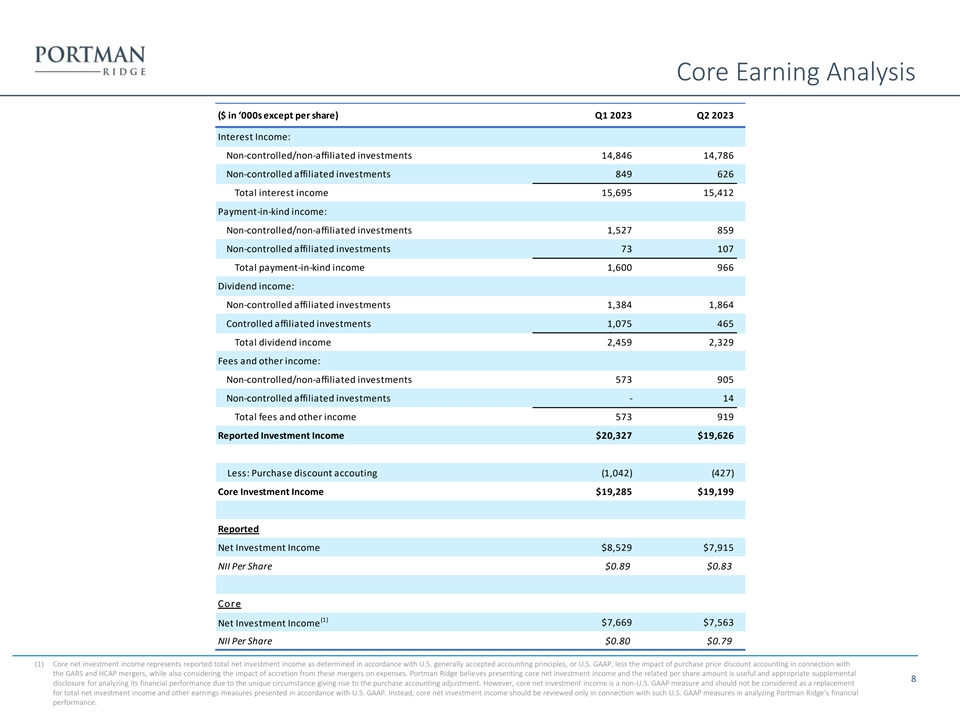
Core Earning Analysis ($ in ‘000s except per share) Q1 2023 Q2
2023 Interest Income: Non-controlled/non-affiliated investments 14,846 14,786 Non-controlled affiliated investments 849 626 Total interest income 15,695 15,412 Payment-in-kind income: Non-controlled/non-affiliated investments 1,527 859
Non-controlled affiliated investments 73 107 Total payment-in-kind income 1,600 966 Dividend income: Non-controlled affiliated investments 1,384 1,864 Controlled affiliated investments 1,075 465 Total dividend income 2,459 2,329 Fees and other
income: Non-controlled/non-affiliated investments 573 905 Non-controlled affiliated investments - 14 Total fees and other income 573 919 Reported Investment Income $20,327 $19,626 Less: Purchase discount accouting (1,042) (427) Core Investment
Income $19,285 $19,199 Reported Net Investment Income $8,529 $7,915 NII Per Share $0.89 $0.83 Core (1) $7,669 $7,563 Net Investment Income NII Per Share $0.80 $0.79 (1) Core net investment income represents reported total net investment income as
determined in accordance with U.S. generally accepted accounting principles, or U.S. GAAP, less the impact of purchase price discount accounting in connection with the GARS and HCAP mergers, while also considering the impact of accretion from these
mergers on expenses. Portman Ridge believes presenting core net investment income and the related per share amount is useful and appropriate supplemental 8 disclosure for analyzing its financial performance due to the unique circumstance giving rise
to the purchase accounting adjustment. However, core net investment income is a non-U.S. GAAP measure and should not be considered as a replacement for total net investment income and other earnings measures presented in accordance with U.S. GAAP.
Instead, core net investment income should be reviewed only in connection with such U.S. GAAP measures in analyzing Portman Ridge’s financial performance.
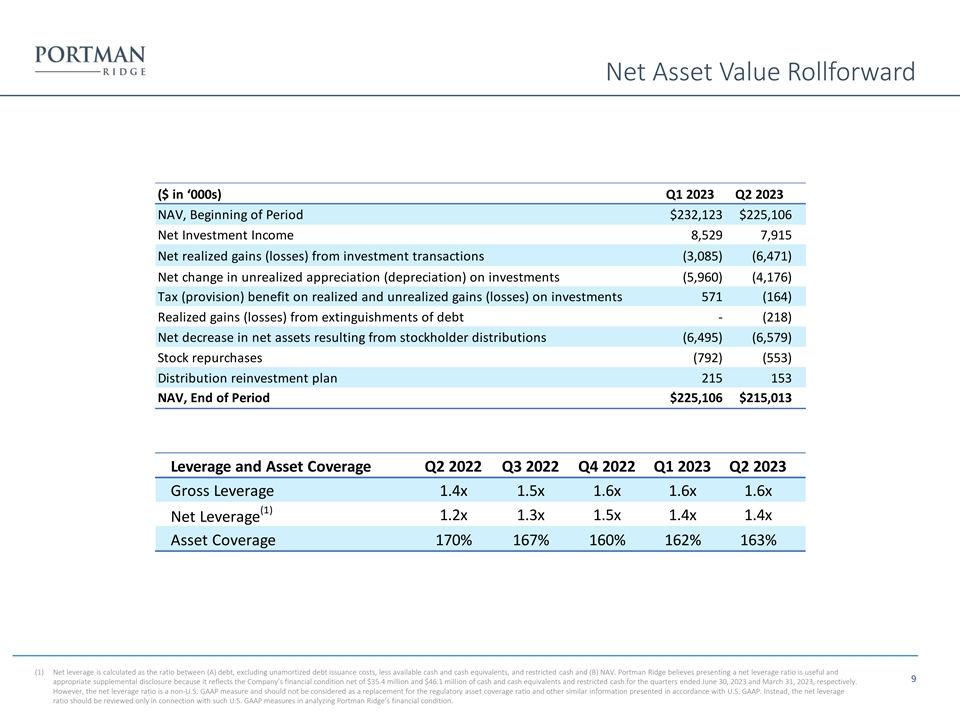
Net Asset Value Rollforward ($ in ‘000s) Q1 2023 Q2 2023 NAV,
Beginning of Period $232,123 $225,106 Net Investment Income 8,529 7,915 Net realized gains (losses) from investment transactions (3,085) (6,471) Net change in unrealized appreciation (depreciation) on investments (5,960) (4,176) Tax (provision)
benefit on realized and unrealized gains (losses) on investments 571 (164) Realized gains (losses) from extinguishments of debt - (218) Net decrease in net assets resulting from stockholder distributions (6,495) (6,579) Stock repurchases (792) (553)
Distribution reinvestment plan 215 153 NAV, End of Period $225,106 $215,013 Leverage and Asset Coverage Q2 2022 Q3 2022 Q4 2022 Q1 2023 Q2 2023 Gross Leverage 1.4x 1.5x 1.6x 1.6x 1.6x (1) 1.2x 1.3x 1.5x 1.4x 1.4x Net Leverage Asset Coverage 170%
167% 160% 162% 163% (1) Net leverage is calculated as the ratio between (A) debt, excluding unamortized debt issuance costs, less available cash and cash equivalents, and restricted cash and (B) NAV. Portman Ridge believes presenting a net leverage
ratio is useful and 9 appropriate supplemental disclosure because it reflects the Company’s financial condition net of $35.4 million and $46.1 million of cash and cash equivalents and restricted cash for the quarters ended June 30, 2023 and
March 31, 2023, respectively. However, the net leverage ratio is a non-U.S. GAAP measure and should not be considered as a replacement for the regulatory asset coverage ratio and other similar information presented in accordance with U.S. GAAP.
Instead, the net leverage ratio should be reviewed only in connection with such U.S. GAAP measures in analyzing Portman Ridge’s financial condition.

(1) Current Portfolio Profile (2) Diversified Portfolio of Assets
Diversification by Borrower 4.6% Top 5 Borrowers, 4.1% 17.7% 104 Debt + Equity Portfolio Investee Companies 3.3% 2.9% $3.2mm / 1% Average Debt Position Size 2.8% Remainder 43.3% U.S Centric Investments: Nearly 100% US-Based Companies Next 5-10
Investments 12.2% Focus on Non-Cyclical Industries with High FCF Generation Credit quality has been stable to improving during the Next 11-25 rotation period Investments 26.8% (2) (2) Industry Diversification Asset Mix Telecommunications 2.4%
Electronics Other 2.5% 21.1% High Tech Industries Transportation: Cargo 17.5% Junior Secured Loan 2.6% Senior Secured Loan 8.7% Beverage, Food and Tobacco 86.7% 2.8% Equity Security 4.6% Consumer goods: Durable Senior Unsecured Bond 3.0% 0.0%
Services: Business Media: Broadcasting & Subscription 15.2% 3.3% Finance Banking, Finance, Insurance 4.4% & Real Estate Healthcare & Pharmaceuticals 14.0% 11.2% (1) As of June 30, 2023. Figures shown do not include short term
investments, CLO holdings, F3C JV or Series A-Great Lakes Funding II LLC, and derivatives. 10 (2) Shown as % of debt and equity investments at fair market value.
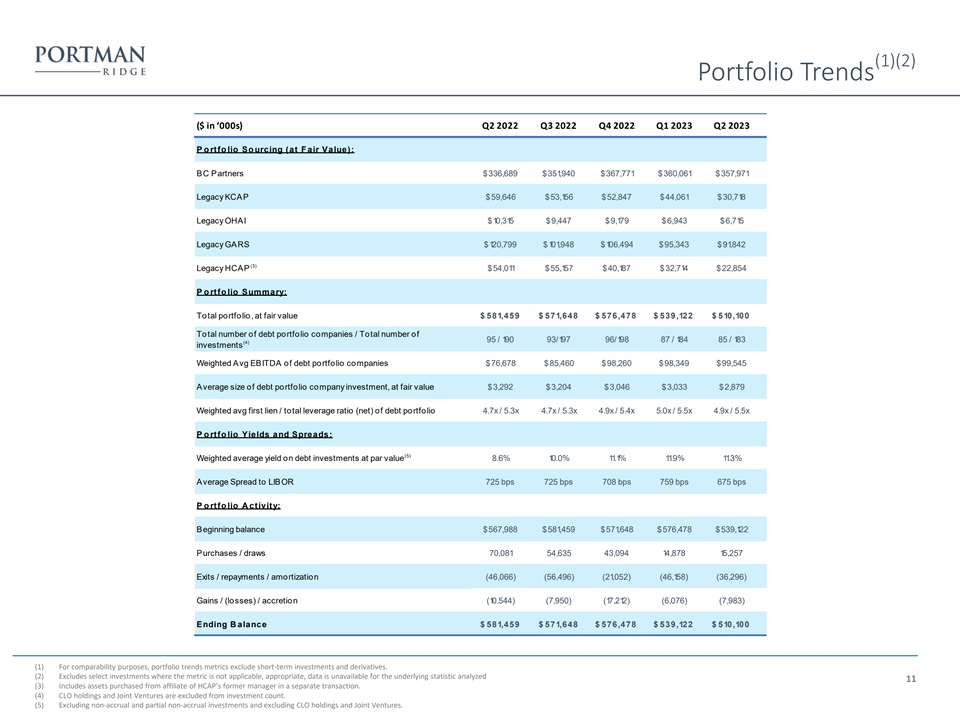
(1)(2) Portfolio Trends ($ in ‘000s) Q2 2022 Q3 2022 Q4 2022 Q1
2023 Q2 2023 P o rtfo lio So urcing (at F air Value): BC Partners $336,689 $351,940 $367,771 $360,061 $357,971 Legacy KCAP $59,646 $53,156 $52,847 $44,061 $30,718 Legacy OHAI $10,315 $9,447 $9,179 $6,943 $6,715 Legacy GARS $120,799 $101,948 $106,494
$95,343 $91,842 (3) Legacy HCAP $54,011 $55,157 $40,187 $32,714 $22,854 P o rtfo lio Summary: Total portfolio, at fair value $ 581,459 $ 571,648 $ 576,478 $ 539,122 $ 510,100 Total number of debt portfolio companies / Total number of 95 / 190 93/197
96/198 87 / 184 85 / 183 (4) investments Weighted Avg EBITDA of debt portfolio companies $76,678 $85,460 $98,260 $98,349 $99,545 Average size of debt portfolio company investment, at fair value $3,292 $3,204 $3,046 $3,033 $2,879 Weighted avg first
lien / total leverage ratio (net) of debt portfolio 4.7x / 5.3x 4.7x / 5.3x 4.9x / 5.4x 5.0x / 5.5x 4.9x / 5.5x P o rtfo lio Yields and Spreads: (5) Weighted average yield on debt investments at par value 8.6% 10.0% 11.1% 11.9% 11.3% Average Spread
to LIBOR 725 bps 725 bps 708 bps 759 bps 675 bps P o rtfo lio A ctivity: Beginning balance $567,988 $581,459 $571,648 $576,478 $539,122 Purchases / draws 70,081 54,635 43,094 14,878 15,257 Exits / repayments / amortization (46,066) (56,496) (21,052)
(46,158) (36,296) Gains / (losses) / accretion (10,544) (7,950) (17,212) (6,076) (7,983) Ending B alance $ 581,459 $ 571,648 $ 576,478 $ 539,122 $ 510,100 (1) For comparability purposes, portfolio trends metrics exclude short-term investments and
derivatives. (2) Excludes select investments where the metric is not applicable, appropriate, data is unavailable for the underlying statistic analyzed 11 (3) Includes assets purchased from affiliate of HCAP’s former manager in a separate
transaction. (4) CLO holdings and Joint Ventures are excluded from investment count. (5) Excluding non-accrual and partial non-accrual investments and excluding CLO holdings and Joint Ventures.
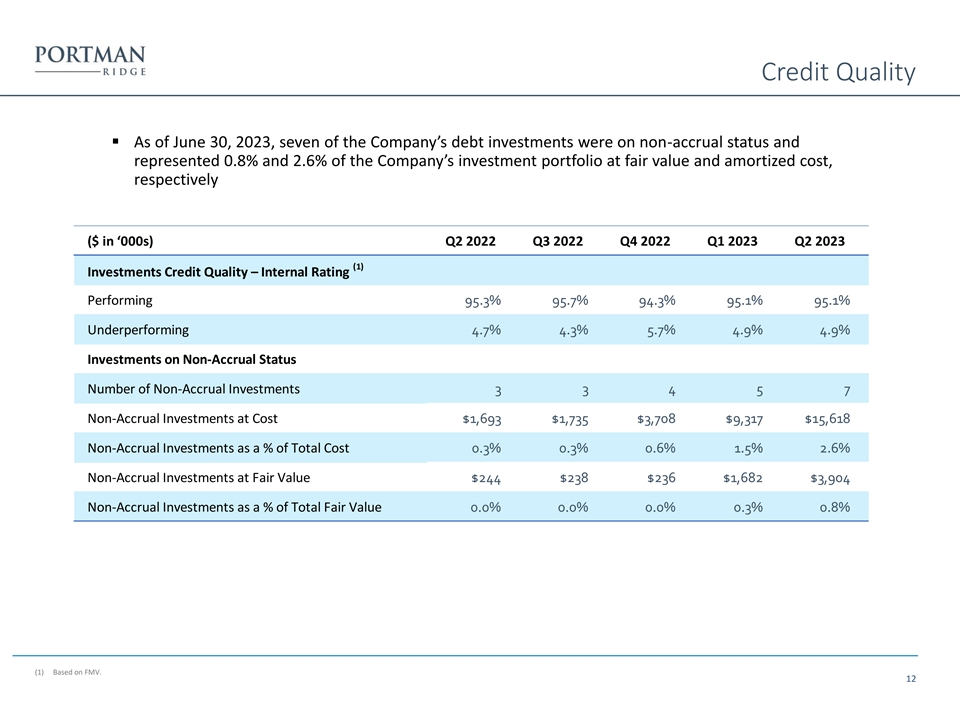
Credit Quality ▪ As of June 30, 2023, seven of the
Company’s debt investments were on non-accrual status and represented 0.8% and 2.6% of the Company’s investment portfolio at fair value and amortized cost, respectively ($ in ‘000s) Q2 2022 Q3 2022 Q4 2022 Q1 2023 Q2 2023 (1)
Investments Credit Quality – Internal Rating Performing 95.3% 95.7% 94.3% 95.1% 95.1% Underperforming 4.7% 4.3% 5.7% 4.9% 4.9% Investments on Non-Accrual Status Number of Non-Accrual Investments 3 3 4 5 7 Non-Accrual Investments at Cost $1,693
$1,735 $3,708 $9,317 $15,618 Non-Accrual Investments as a % of Total Cost 0.3% 0.3% 0.6% 1.5% 2.6% Non-Accrual Investments at Fair Value $244 $238 $236 $1,682 $3,904 Non-Accrual Investments as a % of Total Fair Value 0.0% 0.0% 0.0% 0.3% 0.8% (1)
Based on FMV. 12
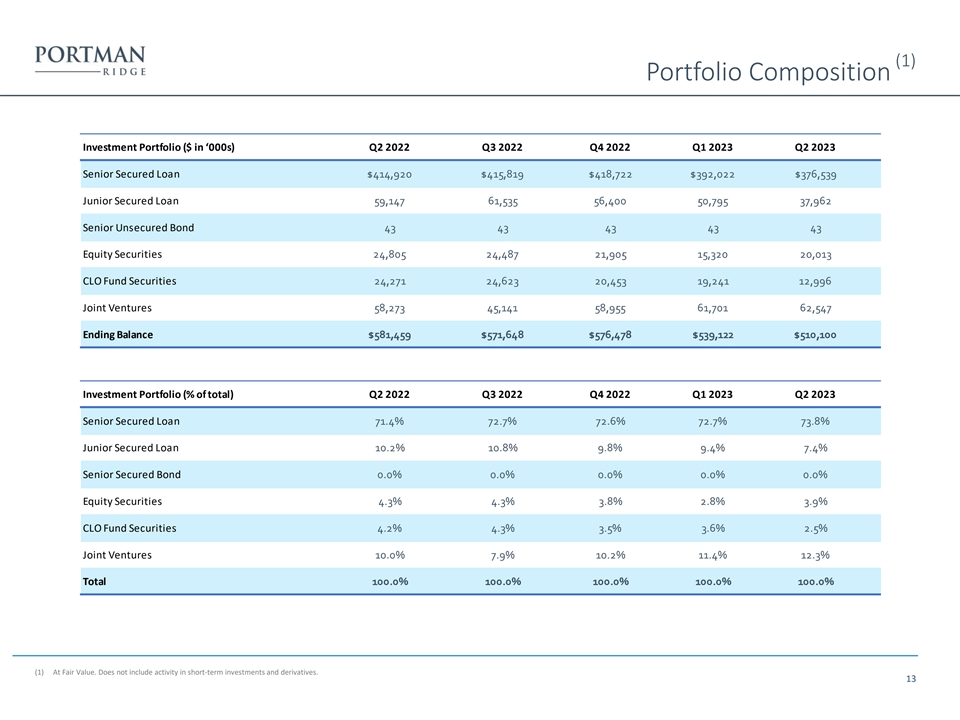
(1) Portfolio Composition Investment Portfolio ($ in ‘000s) Q2
2022 Q3 2022 Q4 2022 Q1 2023 Q2 2023 Senior Secured Loan $414,920 $415,819 $418,722 $392,022 $376,539 Junior Secured Loan 59,147 61,535 56,400 50,795 37,962 Senior Unsecured Bond 43 43 43 43 43 Equity Securities 24,805 24,487 21,905 15,320 20,013
CLO Fund Securities 24,271 24,623 20,453 19,241 12,996 Joint Ventures 58,273 45,141 58,955 61,701 62,547 Ending Balance $581,459 $571,648 $576,478 $539,122 $510,100 Investment Portfolio (% of total) Q2 2022 Q3 2022 Q4 2022 Q1 2023 Q2 2023 Senior
Secured Loan 71.4% 72.7% 72.6% 72.7% 73.8% Junior Secured Loan 10.2% 10.8% 9.8% 9.4% 7.4% Senior Secured Bond 0.0% 0.0% 0.0% 0.0% 0.0% Equity Securities 4.3% 4.3% 3.8% 2.8% 3.9% CLO Fund Securities 4.2% 4.3% 3.5% 3.6% 2.5% Joint Ventures 10.0% 7.9%
10.2% 11.4% 12.3% Total 100.0% 100.0% 100.0% 100.0% 100.0% (1) At Fair Value. Does not include activity in short-term investments and derivatives. 13
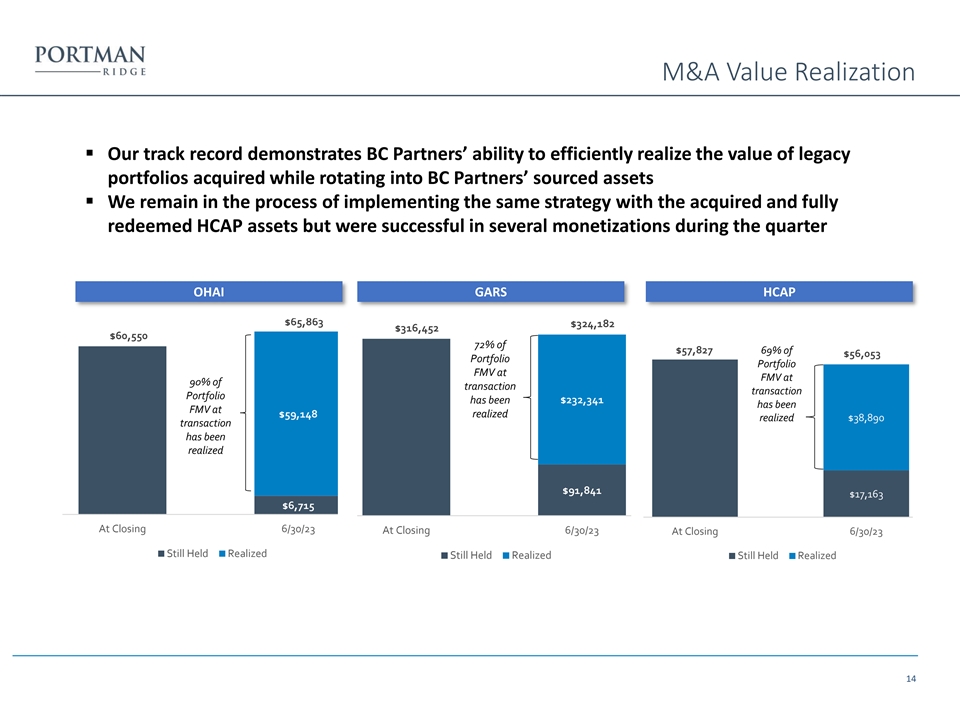
M&A Value Realization ▪ Our track record demonstrates BC
Partners’ ability to efficiently realize the value of legacy portfolios acquired while rotating into BC Partners’ sourced assets ▪ We remain in the process of implementing the same strategy with the acquired and fully redeemed HCAP
assets but were successful in several monetizations during the quarter OHAI GARS HCAP $65,863 $324,182 $316,452 $60,550 72% of $57,827 69% of $56,053 Portfolio Portfolio FMV at FMV at 90% of transaction transaction Portfolio has been $232,341 has
been FMV at $59,148 realized realized $38,890 transaction has been realized $91,841 $17,163 $6,715 At Closing 6/30/23 At Closing 6/30/23 At Closing 6/30/23 Still Held Realized Still Held Realized Still Held Realized 14

Appendix
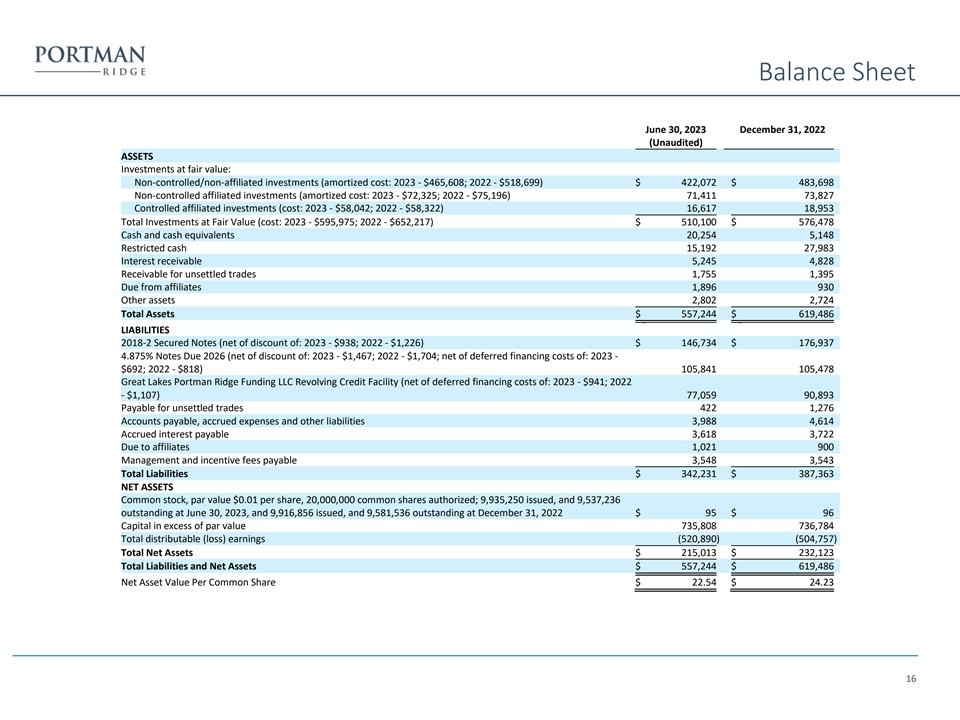
Balance Sheet June 30, 2023 December 31, 2022 (Unaudited) ASSETS
Investments at fair value: Non-controlled/non-affiliated investments (amortized cost: 2023 - $465,608; 2022 - $518,699) $ 422,072 $ 483,698 Non-controlled affiliated investments (amortized cost: 2023 - $72,325; 2022 - $75,196) 71,411 73,827
Controlled affiliated investments (cost: 2023 - $58,042; 2022 - $58,322) 16,617 18,953 Total Investments at Fair Value (cost: 2023 - $595,975; 2022 - $652,217) $ 510,100 $ 576,478 Cash and cash equivalents 20,254 5,148 Restricted cash 15,192 27,983
Interest receivable 5,245 4,828 Receivable for unsettled trades 1,755 1,395 Due from affiliates 1,896 930 Other assets 2,802 2,724 Total Assets $ 557,244 $ 619,486 LIABILITIES 2018-2 Secured Notes (net of discount of: 2023 - $938; 2022 - $1,226) $
146,734 $ 176,937 4.875% Notes Due 2026 (net of discount of: 2023 - $1,467; 2022 - $1,704; net of deferred financing costs of: 2023 - $692; 2022 - $818) 105,841 105,478 Great Lakes Portman Ridge Funding LLC Revolving Credit Facility (net of deferred
financing costs of: 2023 - $941; 2022 - $1,107) 77,059 90,893 Payable for unsettled trades 422 1,276 Accounts payable, accrued expenses and other liabilities 3,988 4,614 Accrued interest payable 3,618 3,722 Due to affiliates 1,021 900 Management and
incentive fees payable 3,548 3,543 Total Liabilities $ 342,231 $ 387,363 NET ASSETS Common stock, par value $0.01 per share, 20,000,000 common shares authorized; 9,935,250 issued, and 9,537,236 outstanding at June 30, 2023, and 9,916,856 issued, and
9,581,536 outstanding at December 31, 2022 $ 95 $ 96 Capital in excess of par value 735,808 736,784 Total distributable (loss) earnings (520,890 ) (504,757) Total Net Assets $ 215,013 $ 232,123 Total Liabilities and Net Assets $ 557,244 $ 619,486
Net Asset Value Per Common Share $ 22.54 $ 24.23 16
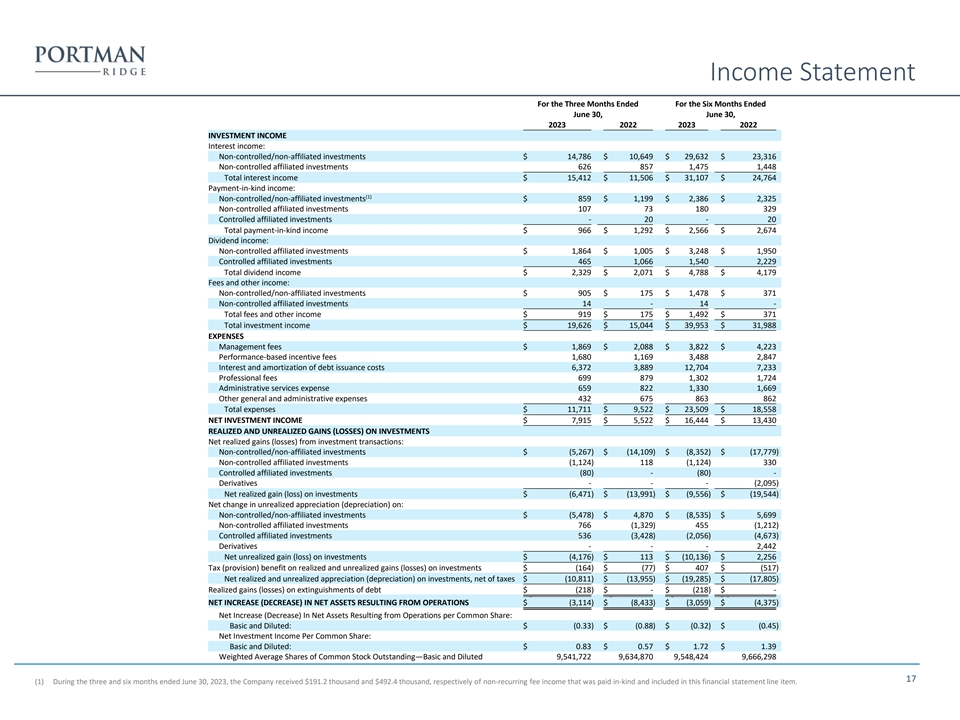
Income Statement For the Three Months Ended For the Six Months Ended
June 30, June 30, 2023 2022 2023 2022 INVESTMENT INCOME Interest income: Non-controlled/non-affiliated investments $ 14,786 $ 10,649 $ 29,632 $ 23,316 Non-controlled affiliated investments 626 857 1,475 1,448 Total interest income $ 15,412 $ 11,506
$ 31,107 $ 24,764 Payment-in-kind income: (1) Non-controlled/non-affiliated investments $ 859 $ 1,199 $ 2,386 $ 2,325 Non-controlled affiliated investments 107 73 180 329 Controlled affiliated investments - 20 - 20 Total payment-in-kind income $ 966
$ 1,292 $ 2,566 $ 2,674 Dividend income: Non-controlled affiliated investments $ 1,864 $ 1,005 $ 3,248 $ 1,950 Controlled affiliated investments 465 1,066 1,540 2,229 Total dividend income $ 2,329 $ 2,071 $ 4,788 $ 4,179 Fees and other income:
Non-controlled/non-affiliated investments $ 905 $ 175 $ 1,478 $ 371 Non-controlled affiliated investments 14 - 14 - Total fees and other income $ 919 $ 175 $ 1,492 $ 371 Total investment income $ 19,626 $ 15,044 $ 39,953 $ 31,988 EXPENSES Management
fees $ 1,869 $ 2,088 $ 3,822 $ 4,223 Performance-based incentive fees 1,680 1,169 3,488 2,847 Interest and amortization of debt issuance costs 6,372 3,889 12,704 7,233 Professional fees 699 879 1,302 1,724 Administrative services expense 659 822
1,330 1,669 Other general and administrative expenses 432 675 863 862 Total expenses $ 11,711 $ 9,522 $ 23,509 $ 18,558 NET INVESTMENT INCOME $ 7,915 $ 5,522 $ 16,444 $ 13,430 REALIZED AND UNREALIZED GAINS (LOSSES) ON INVESTMENTS Net realized gains
(losses) from investment transactions: Non-controlled/non-affiliated investments $ (5,267 ) $ (14,109) $ (8,352) $ (17,779) Non-controlled affiliated investments (1,124 ) 118 (1,124) 330 Controlled affiliated investments (80 ) - (80 ) - Derivatives
- - - (2,095) Net realized gain (loss) on investments $ (6,471 ) $ (13,991) $ (9,556) $ (19,544) Net change in unrealized appreciation (depreciation) on: Non-controlled/non-affiliated investments $ (5,478 ) $ 4,870 $ (8,535) $ 5,699 Non-controlled
affiliated investments 766 (1,329) 455 (1,212) Controlled affiliated investments 536 (3,428) (2,056 ) (4,673 ) Derivatives - - - 2,442 Net unrealized gain (loss) on investments $ (4,176 ) $ 113 $ (10,136 ) $ 2,256 Tax (provision) benefit on realized
and unrealized gains (losses) on investments $ (164 ) $ (77) $ 407 $ (517) Net realized and unrealized appreciation (depreciation) on investments, net of taxes $ (10,811 ) $ (13,955) $ (19,285) $ (17,805 ) Realized gains (losses) on extinguishments
of debt $ (218 ) $ - $ (218) $ - NET INCREASE (DECREASE) IN NET ASSETS RESULTING FROM OPERATIONS $ (3,114 ) $ (8,433) $ (3,059) $ (4,375) Net Increase (Decrease) In Net Assets Resulting from Operations per Common Share: Basic and Diluted: $ (0.33 )
$ (0.88) $ (0.32) $ (0.45) Net Investment Income Per Common Share: Basic and Diluted: $ 0.83 $ 0.57 $ 1.72 $ 1.39 Weighted Average Shares of Common Stock Outstanding—Basic and Diluted 9,541,722 9,634,870 9,548,424 9,666,298 17 (1) During the
three and six months ended June 30, 2023, the Company received $191.2 thousand and $492.4 thousand, respectively of non-recurring fee income that was paid in-kind and included in this financial statement line item.

Corporate Leverage & Liquidity Cash and Cash Equivalents ▪
Unrestricted cash and cash equivalents totaled $20.3 million as of June 30, 2023 ▪ Restricted cash of $15.2 million as of June 30, 2023 Debt Summary ▪ As of June 30, 2023, par value of outstanding borrowings was $333.7 million; there was
$37.0 million of available borrowing capacity under the Senior Secured Revolving Credit Facility and no available borrowing capacity under the 2018-2 Secured Notes. 18

(1) Regular Distribution Information Date Declared Record Date Payment
Date Distribution per Share 8/9/2023 8/22/2023 8/31/2023 $0.69 5/10/2023 5/22/2023 5/31/2023 $0.69 3/9/2023 3/20/2023 3/31/2023 $0.68 11/8/2022 11/24/2022 12/13/2022 $0.67 8/9/2022 8/16/2022 9/2/2022 $0.63 5/10/2022 5/24/2022 6/7/2022 $0.63
3/10/2022 3/21/2022 3/30/2022 $0.63 11/3/2021 11/15/2021 11/30/2021 $0.62 8/4/2021 1 for 10 Reverse Stock Split effective 8/26/21 8/4/2021 8/17/2021 8/31/2021 $0.60 5/6/2021 5/19/2021 6/1/2021 $0.60 2/12/2021 2/22/2021 3/2/2021 $0.60 10/16/2020
10/26/2020 11/27/2020 $0.60 8/5/2020 8/17/2020 8/28/2020 $0.60 3/17/2020 5/7/2020 5/27/2020 $0.60 2/5/2020 2/18/2020 2/28/2020 $0.60 11/5/2019 11/15/2019 11/29/2019 $0.60 8/5/2019 8/12/2019 8/29/2019 $0.60 (1) The Company completed a Reverse Stock
Split of 10 to 1 effective August 26, 2021, the distribution per share amounts have been adjusted retroactively to reflect the split for all periods presented. 19
v3.23.2
| X |
- DefinitionBoolean flag that is true when the XBRL content amends previously-filed or accepted submission.
| Name: |
dei_AmendmentFlag |
| Namespace Prefix: |
dei_ |
| Data Type: |
xbrli:booleanItemType |
| Balance Type: |
na |
| Period Type: |
duration |
|
| X |
- DefinitionFor the EDGAR submission types of Form 8-K: the date of the report, the date of the earliest event reported; for the EDGAR submission types of Form N-1A: the filing date; for all other submission types: the end of the reporting or transition period. The format of the date is YYYY-MM-DD.
| Name: |
dei_DocumentPeriodEndDate |
| Namespace Prefix: |
dei_ |
| Data Type: |
xbrli:dateItemType |
| Balance Type: |
na |
| Period Type: |
duration |
|
| X |
- DefinitionThe type of document being provided (such as 10-K, 10-Q, 485BPOS, etc). The document type is limited to the same value as the supporting SEC submission type, or the word 'Other'.
| Name: |
dei_DocumentType |
| Namespace Prefix: |
dei_ |
| Data Type: |
dei:submissionTypeItemType |
| Balance Type: |
na |
| Period Type: |
duration |
|
| X |
- DefinitionAddress Line 1 such as Attn, Building Name, Street Name
| Name: |
dei_EntityAddressAddressLine1 |
| Namespace Prefix: |
dei_ |
| Data Type: |
xbrli:normalizedStringItemType |
| Balance Type: |
na |
| Period Type: |
duration |
|
| X |
- DefinitionAddress Line 2 such as Street or Suite number
| Name: |
dei_EntityAddressAddressLine2 |
| Namespace Prefix: |
dei_ |
| Data Type: |
xbrli:normalizedStringItemType |
| Balance Type: |
na |
| Period Type: |
duration |
|
| X |
- Definition
+ References
+ Details
| Name: |
dei_EntityAddressCityOrTown |
| Namespace Prefix: |
dei_ |
| Data Type: |
xbrli:normalizedStringItemType |
| Balance Type: |
na |
| Period Type: |
duration |
|
| X |
- DefinitionCode for the postal or zip code
| Name: |
dei_EntityAddressPostalZipCode |
| Namespace Prefix: |
dei_ |
| Data Type: |
xbrli:normalizedStringItemType |
| Balance Type: |
na |
| Period Type: |
duration |
|
| X |
- DefinitionName of the state or province.
| Name: |
dei_EntityAddressStateOrProvince |
| Namespace Prefix: |
dei_ |
| Data Type: |
dei:stateOrProvinceItemType |
| Balance Type: |
na |
| Period Type: |
duration |
|
| X |
- DefinitionA unique 10-digit SEC-issued value to identify entities that have filed disclosures with the SEC. It is commonly abbreviated as CIK. Reference 1: http://www.xbrl.org/2003/role/presentationRef
-Publisher SEC
-Name Exchange Act
-Number 240
-Section 12
-Subsection b-2
| Name: |
dei_EntityCentralIndexKey |
| Namespace Prefix: |
dei_ |
| Data Type: |
dei:centralIndexKeyItemType |
| Balance Type: |
na |
| Period Type: |
duration |
|
| X |
- DefinitionIndicate if registrant meets the emerging growth company criteria. Reference 1: http://www.xbrl.org/2003/role/presentationRef
-Publisher SEC
-Name Exchange Act
-Number 240
-Section 12
-Subsection b-2
| Name: |
dei_EntityEmergingGrowthCompany |
| Namespace Prefix: |
dei_ |
| Data Type: |
xbrli:booleanItemType |
| Balance Type: |
na |
| Period Type: |
duration |
|
| X |
- DefinitionCommission file number. The field allows up to 17 characters. The prefix may contain 1-3 digits, the sequence number may contain 1-8 digits, the optional suffix may contain 1-4 characters, and the fields are separated with a hyphen.
| Name: |
dei_EntityFileNumber |
| Namespace Prefix: |
dei_ |
| Data Type: |
dei:fileNumberItemType |
| Balance Type: |
na |
| Period Type: |
duration |
|
| X |
- DefinitionTwo-character EDGAR code representing the state or country of incorporation.
| Name: |
dei_EntityIncorporationStateCountryCode |
| Namespace Prefix: |
dei_ |
| Data Type: |
dei:edgarStateCountryItemType |
| Balance Type: |
na |
| Period Type: |
duration |
|
| X |
- DefinitionThe exact name of the entity filing the report as specified in its charter, which is required by forms filed with the SEC. Reference 1: http://www.xbrl.org/2003/role/presentationRef
-Publisher SEC
-Name Exchange Act
-Number 240
-Section 12
-Subsection b-2
| Name: |
dei_EntityRegistrantName |
| Namespace Prefix: |
dei_ |
| Data Type: |
xbrli:normalizedStringItemType |
| Balance Type: |
na |
| Period Type: |
duration |
|
| X |
- DefinitionThe Tax Identification Number (TIN), also known as an Employer Identification Number (EIN), is a unique 9-digit value assigned by the IRS. Reference 1: http://www.xbrl.org/2003/role/presentationRef
-Publisher SEC
-Name Exchange Act
-Number 240
-Section 12
-Subsection b-2
| Name: |
dei_EntityTaxIdentificationNumber |
| Namespace Prefix: |
dei_ |
| Data Type: |
dei:employerIdItemType |
| Balance Type: |
na |
| Period Type: |
duration |
|
| X |
- DefinitionLocal phone number for entity.
| Name: |
dei_LocalPhoneNumber |
| Namespace Prefix: |
dei_ |
| Data Type: |
xbrli:normalizedStringItemType |
| Balance Type: |
na |
| Period Type: |
duration |
|
| X |
- DefinitionBoolean flag that is true when the Form 8-K filing is intended to satisfy the filing obligation of the registrant as pre-commencement communications pursuant to Rule 13e-4(c) under the Exchange Act. Reference 1: http://www.xbrl.org/2003/role/presentationRef
-Publisher SEC
-Name Exchange Act
-Number 240
-Section 13e
-Subsection 4c
| Name: |
dei_PreCommencementIssuerTenderOffer |
| Namespace Prefix: |
dei_ |
| Data Type: |
xbrli:booleanItemType |
| Balance Type: |
na |
| Period Type: |
duration |
|
| X |
- DefinitionBoolean flag that is true when the Form 8-K filing is intended to satisfy the filing obligation of the registrant as pre-commencement communications pursuant to Rule 14d-2(b) under the Exchange Act. Reference 1: http://www.xbrl.org/2003/role/presentationRef
-Publisher SEC
-Name Exchange Act
-Number 240
-Section 14d
-Subsection 2b
| Name: |
dei_PreCommencementTenderOffer |
| Namespace Prefix: |
dei_ |
| Data Type: |
xbrli:booleanItemType |
| Balance Type: |
na |
| Period Type: |
duration |
|
| X |
- DefinitionTitle of a 12(b) registered security. Reference 1: http://www.xbrl.org/2003/role/presentationRef
-Publisher SEC
-Name Exchange Act
-Number 240
-Section 12
-Subsection b
| Name: |
dei_Security12bTitle |
| Namespace Prefix: |
dei_ |
| Data Type: |
dei:securityTitleItemType |
| Balance Type: |
na |
| Period Type: |
duration |
|
| X |
- DefinitionName of the Exchange on which a security is registered. Reference 1: http://www.xbrl.org/2003/role/presentationRef
-Publisher SEC
-Name Exchange Act
-Number 240
-Section 12
-Subsection d1-1
| Name: |
dei_SecurityExchangeName |
| Namespace Prefix: |
dei_ |
| Data Type: |
dei:edgarExchangeCodeItemType |
| Balance Type: |
na |
| Period Type: |
duration |
|
| X |
- DefinitionBoolean flag that is true when the Form 8-K filing is intended to satisfy the filing obligation of the registrant as soliciting material pursuant to Rule 14a-12 under the Exchange Act. Reference 1: http://www.xbrl.org/2003/role/presentationRef
-Publisher SEC
-Name Exchange Act
-Section 14a
-Number 240
-Subsection 12
| Name: |
dei_SolicitingMaterial |
| Namespace Prefix: |
dei_ |
| Data Type: |
xbrli:booleanItemType |
| Balance Type: |
na |
| Period Type: |
duration |
|
| X |
- DefinitionTrading symbol of an instrument as listed on an exchange.
| Name: |
dei_TradingSymbol |
| Namespace Prefix: |
dei_ |
| Data Type: |
dei:tradingSymbolItemType |
| Balance Type: |
na |
| Period Type: |
duration |
|
| X |
- DefinitionBoolean flag that is true when the Form 8-K filing is intended to satisfy the filing obligation of the registrant as written communications pursuant to Rule 425 under the Securities Act. Reference 1: http://www.xbrl.org/2003/role/presentationRef
-Publisher SEC
-Name Securities Act
-Number 230
-Section 425
| Name: |
dei_WrittenCommunications |
| Namespace Prefix: |
dei_ |
| Data Type: |
xbrli:booleanItemType |
| Balance Type: |
na |
| Period Type: |
duration |
|
Portman Ridge Finance (NASDAQ:PTMN)
Historical Stock Chart
From May 2024 to Jun 2024

Portman Ridge Finance (NASDAQ:PTMN)
Historical Stock Chart
From Jun 2023 to Jun 2024
