--Net Loans Exceed $2.5 Billion for the
First Time--
--Total Assets Achieve Record High of $5.4
Billion--
Farmers & Merchants Bank of Long Beach (OTCQB: FMBL) today
reported financial results for the first quarter ended March 31,
2014.
“Interest income was up 9 percent in the first quarter,
demonstrating the solid traction that the Bank’s recently expanded
lending and retail teams continue to achieve,” said Henry Walker,
president of Farmers & Merchants Bank of Long Beach. “As we
grow our topline, we maintain a long-term view that investing in
the Bank’s people and infrastructure will help us achieve new
heights and provide superior service to new and existing
clients.”
Income Statement
For the three months ended March 31, 2014, interest income
advanced to $43.3 million from $39.6 million in the first quarter
of 2013. Interest expense for the 2014 first quarter was $1.6
million, compared with $1.5 million last year.
Net interest income for the 2014 first quarter rose to $41.7
million from $38.1 million for the first quarter of 2013. Farmers
& Merchants’ net interest margin was 3.40% for the 2014 first
quarter, compared with 3.28% a year ago.
The Bank did not have a provision for loan losses in the first
quarter of 2014, nor in the same period a year ago, reflecting the
continued strength of the loan portfolio. The Bank’s allowance for
loan losses as a percentage of loans outstanding was 1.98% at March
31, 2014, compared with 2.50% at March 31, 2013; the decrease being
indicative of loan growth, coupled with strong loan quality.
Non-interest income was $6.6 million for the 2014 first quarter,
compared with $10.2 million for the first quarter a year ago.
Non-interest income for the 2013 first quarter included a $3.6
million gain on the sale of a branch building.
Non-interest expense for the 2014 first quarter was $28. 2
million, compared with $23.8 million for the same period last year.
The increase in the 2014 first quarter is reflective of investments
in talent and human capital, new awareness and customer-generation
marketing campaigns and other real estate owned expenses.
Net income for the 2014 first quarter totaled $14.1 million, or
$107.38 per diluted share, compared with net income of $16.7
million, or $127.77 per diluted share, for the 2013 first
quarter.
Balance Sheet
At March 31, 2014, net loans increased to $2.53 billion from
$2.40 billion at December 31, 2013. The Bank’s deposits totaled
$3.98 billion at the end of the 2014 first quarter, compared with
$3.83 billion at December 31, 2013. Non-interest bearing deposits
represented 39.1% of total deposits at March 31, 2014, versus 38.5%
of total deposits at December 31, 2013. Total assets increased to
$5.36 billion at the close of the 2014 first quarter from $5.21
billion at December 31, 2013.
Additional paid-in capital was $112.04 million at March 31,
2014, versus $12.04 million at the end of 2013, reflecting a
transfer of $100 million from retained earnings to additional
paid-in capital for regulatory purposes regarding investments in
bank premises.
At March 31, 2014, Farmers & Merchants Bank remained
“well-capitalized” under all regulatory categories, with a total
risk-based capital ratio of 25.36%, a Tier 1 risk-based capital
ratio of 24.10%, and a Tier 1 leverage ratio of 14.60%. The minimum
ratios for capital adequacy for a well-capitalized bank are 10.00%,
6.00% and 5.00%, respectively.
“F&M’s solid loan growth and the sound and stable
characteristics of its balance sheet are indicative of the
strategic initiatives and core fundamentals that ultimately enhance
the Bank’s position of strength,” said Daniel Walker, chief
executive officer and chairman of the board. “Now in F&M’s
107th year of service, we continue to maintain the Bank’s bedrock
values, while expanding our presence and preparing for future
growth. We are very proud of our continued standing as one of
California's strongest banks.”
About Farmers & Merchants Bank of Long Beach
Founded in Long Beach in 1907 by C.J. Walker, Farmers &
Merchants Bank has 23 branches in Los Angeles and Orange Counties.
The Bank specializes in commercial and small business banking along
with business loan programs. Farmers & Merchants Bank of Long
Beach is a California state chartered bank with deposits insured by
the Federal Deposit Insurance Corporation (Member FDIC) and an
Equal Housing Lender. For more information about F&M, please
visit www.fmb.com.
FARMERS & MERCHANTS BANK OF LONG BEACH Income
Statements (Unaudited) (In thousands except per share
data) Three Months Ended March 31,
2014 2013 Interest
income: Loans $ 28,870 $ 25,559 Securities
available-for-sale 1,530 2,240 Securities held-to-maturity 12,853
11,629 Deposits with banks 53 207 Total
interest income 43,306 39,635
Interest expense: Deposits 1,348 1,261 Federal funds
purchased 4 - Securities sold under repurchase agreements
274 273 Total interest expense 1,626
1,534 Net interest income 41,680 38,101
Provision for loan losses - -
Net interest income after provision for loan losses 41,680
38,101
Non-interest income:
Service charges on deposit accounts 1,133 1,154 Gains on sale of
securities 425 536 Other real estate owned income 165 310 Merchant
bankcard income 2,274 2,174 Other income 2,591 6,066
Total non-interest income 6,588 10,240
Non-interest expense: Salaries and
employee benefits 15,679 13,340 FDIC and other insurance expense
752 1,692 Occupancy expense 1,772 1,598 Equipment expense 1,481
1,435 Other real estate owned expense 621 (817 ) Amortization of
public welfare investments 2,117 2,020 Merchant bankcard expense
1,787 1,721 Legal and professional services 944 748 Marketing
expense 1,488 589 Other expense 1,553 1,447
Total non-interest expense 28,194 23,773
Income before income tax expense 20,074 24,568
Income tax expense 6,015 7,839
Net income $ 14,059 $ 16,729
Basic and diluted earnings per common share $ 107.38
$ 127.77
FARMERS & MERCHANTS BANK OF
LONG BEACH Balance Sheets (Unaudited) (In thousands
except share and per share data) Mar.
31, 2014 Dec. 31, 2013
Assets Cash and due from banks: Noninterest-bearing
balances $ 75,319 $ 65,261 Interest-bearing balances 146,860 20,755
Securities available-for-sale 336,639 427,942 Securities
held-to-maturity 2,070,679 2,145,289 Loan held for sale 263 465
Gross loans 2,584,961 2,454,302 Less allowance for loan losses
(51,280 ) (51,251 ) Less unamortized deferred loan fees, net
(1,663 ) (1,704 ) Net loans 2,532,018
2,401,347 Other real estate owned,net 13,237 14,502 Public
welfare investments 53,016 27,722 Bank premises and equipment, net
65,429 66,212 Net deferred tax assets 23,664 23,512 Other assets
39,684 21,579
Total
assets $ 5,356,808 $
5,214,586 Liabilities and
Stockholders' Equity Liabilities:
Deposits: Demand, non-interest bearing $ 1,556,932 $ 1,475,888
Demand, interest bearing 416,942 413,291 Savings and money market
savings 1,145,556 1,080,774 Time deposits 860,018
861,489 Total deposits 3,979,448 3,831,442
Securities sold under repurchase agreements 564,923 595,991
Other liabilities 41,867 27,986
Total liabilities 4,586,238
4,455,419 Stockholders' Equity:
Common Stock, par value $20; authorized
250,000 shares; issued and outstanding 130,928 shares
2,619 2,619 Additional paid-in capital 112,044 12,044 Retained
earnings 653,587 742,408 Accumulated other comprehensive income
2,320 2,096
Total
stockholders' equity 770,570
759,167 Total liabilities and stockholders'
equity $ 5,356,808 $
5,214,586
Farmers & Merchants Bank of Long BeachJohn Hinrichs,
562-437-0011, ext. 5035Executive Vice PresidentorPondelWilkinson
Inc.Evan Pondel, 310-279-5980Corporate and Investor
Relationsinvestor@pondel.com
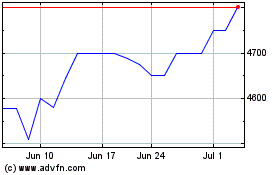
Farmers and Merchants Bank (QX) (USOTC:FMBL)
Historical Stock Chart
From Feb 2025 to Mar 2025

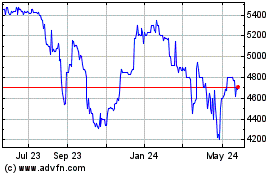
Farmers and Merchants Bank (QX) (USOTC:FMBL)
Historical Stock Chart
From Mar 2024 to Mar 2025
