With the sequester deadline for the US Federal Government
looming large over the economy, it was not expected that stocks
would be able to rally. However, this has not been the case, as
equities have taken the proposed cuts in stride, allowing equities
to push higher.
This is despite the fact that the sequester is due to begin in
short order and that it could have a modest impact on the economy.
Some are predicting job losses and reduced growth, while others
aren’t betting on this pessimistic scenario (With Sequester Ahead,
Are Defense ETFs in Trouble?).
It appears as if this optimism is winning out for now, as the
market has rewarded investors will solid gains in the Wednesday
session. Index ETFs rallied more than 1% to provide investors with
a handful of gains before the sequester hits the economy.
The SPDR S&P 500 (SPY) rose 1.26%, the
SPDR Dow Jones Industrial Average ETF (DIA)
climbed 1.31%, the PowerShares QQQ Trust ETF (QQQ)
posted a gain of 1.02%, and the iShares Russell 2000 Index ETF
(IWM) closed the session rising 1.05%.
Beyond the sequester, it also didn’t hurt that Ben Bernanke’s
testimony to Congress was very dovish. It seemed to suggest that
low rates would be here to stay and that aggressive bond buying
campaigns wouldn’t be going anywhere soon.
Another factor which could have possibly led the market to
positive territory is the upbeat Pending Home Sales Data. The
National Association of Realtors reported that its Pending Home
Sales Index rose 4.5% to 105.9 in January from the downwardly
revised 101.3 in December. This further provides evidence of
recovery of the once grievous sector.
The housing sector should turn out to be the primary driver of
economic growth in 2013. For seven straight quarters spending on
home construction and home improvement activity had a positive
contribution to overall economic growth (Housing ETFs Rally on
Solid Data).
Given that the sequester hasn’t been much of an issue in terms
of growth predictions, and some of the solid housing data as of
late, investors may want to consider looking at real estate and
homebuilder ETFs at this time. These segments have been beaten
down, and now could be a great time to consider these ETFs for more
gains heading into March:
SPDR S&P Homebuilders ETF (XHB)
XHB appears to be very popular, as it has an asset base of $2.36
billion and offers liquidity as revealed by its trading volume of
more than 8 million shares a day. The fund charges a fee of 35
basis points a year (Top Ranked Homebuilder ETF in Focus: XHB).
The fund’s asset base is spread across 36 securities. Among
sectors, XHB has 28.7% of its asset base in homebuilding and 26.79%
in building products, while the rest is spread across home
furnishing retail, home improvement retail and household
appliances.
The fund does well to minimize company-specific risk thanks to
its equal weighting. It invests 36.49% of its asset base in the top
ten holdings. Among individual holdings, Mohawk Industries, Tempur
Pedic and Standard Pacific form the top line of the fund with
respective shares of 3.95%, 3.87%, and 3.78%.
In the previous trading session, the fund climbed 2.16% to close
at $28.37.
Vanguard REIT ETF (VNQ)
VNQ is the largest real estate ETF in the space with an AUM of
$32.3 billion. With holdings of 117 securities, the product puts
44.5% of its assets in the top 10 companies, suggesting a greater
concentration across individual firms (Is ROOF a Better Real Estate
ETF?).
Looking at real estate market exposure, the fund is well
diversified between retail REITs (27.40%), specialized REITs
(28.70%), residential REITs (17.1%), office REITs (13.9%),
diversified REITs (7.6%) and industrial REITs (5.30%).
Large caps account for about 45% of the assets while mid and
small caps make up the remaining portion of the basket. The fund is
liquid as it trades in higher volumes of more than 1 million shares
per day, signifying that no extra cost of investment is involved or
the bid/ask spread is minimal.
The product is one of the low-cost choices in the space,
charging only 10 bps in annual fees from investors.
Dow Jones U.S. Real Estate Index Fund (IYR)
IYR is another popular ETF in the real estate space. This ETF
provides liquidity to investors trading with a volume level of more
than seven million shares a day and an asset base of $5.4 billion
(The Introductory Guide to Real Estate ETF Investing).
The fund manages a basket of 89 real estate companies with 40.5%
of the asset base invested in the top 10 holdings. Among individual
companies, Simon Property Group takes the top spot with a share of
8.72%. Beyond SPG, American Tower Corp and HCP Inc occupy the
second and third positions with an asset investment of 5.34% and
3.91%, respectively.
Among sector holdings, Specialty REIT, Retail REIT and
Industrial REIT take the major chunk of the asset base,
collectively having a share of roughly half the portfolio
For this exposure the fund charges an expense ratio of 47 basis
points, putting it in a decent position in terms of total
costs.
Want the latest recommendations from Zacks Investment Research?
Today, you can download 7 Best Stocks for the Next 30
Days. Click to get this free report >>
ISHARS-DJ REAL (IYR): ETF Research Reports
SIMON PROPERTY (SPG): Free Stock Analysis Report
VIPERS-REIT (VNQ): ETF Research Reports
SPDR-SP HOMEBLD (XHB): ETF Research Reports
To read this article on Zacks.com click here.
Zacks Investment Research
Want the latest recommendations from Zacks Investment Research?
Today, you can download 7 Best Stocks for the Next 30 Days. Click
to get this free report
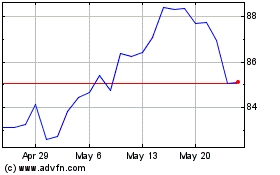
iShares US Real Estate (AMEX:IYR)
Historical Stock Chart
From Oct 2024 to Nov 2024

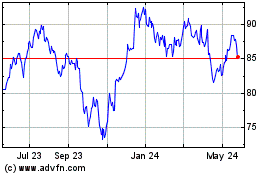
iShares US Real Estate (AMEX:IYR)
Historical Stock Chart
From Nov 2023 to Nov 2024


