How Will the S&P 500 Index Start Q4 of 2022
03 October 2022 - 4:31AM
Finscreener.org
The month of September has been
the worst-performing month for stock market investors
historically, and this trend continued in 2022 as well. In
September 2022, the
S&P 500 index fell
9.3%, while the Nasdaq Composite Index declined 10.5%, and the
Dow Jones index was down
8.8%.
The equity markets ended the last
trading session of September in the red soon after the Commerce
Department’s PCE Price Index report indicated inflation accelerated
more than expected in August. Each of the three indices fell more
than 1.5% on Friday.
The Vice Chairman of the Federal
Reserve, Lael Brainard, emphasized the regulatory body will
continue to tighten monetary policy to offset inflation and
confirmed it wouldnU+02019t pull back on these efforts
prematurely.
In the upcoming week, the labor
market of the United States will be under the spotlight, as the
nonfarm payrolls report will be released for September on Tuesday
by the Labor Department. Further, the JOLTS or Job Opening and
Labor Turnover Survey report for August and ADP’s private-sector
report will also be released this week.
These reports will provide us
with insights into the labor market of the United States and how it
has held up against the Fed’s hawkish monetary policy strategies.
The purchasing manager index (PMI) survey reading and the Institute
for Supply Management will offer updates on recent performance of
the U.S. manufacturing sector.
Job market data
According to experts, the JOLTS
report might indicate a scale back of job openings to 11.1 million
in August from 11.2 million in July. Job openings stood at an
all-time high of 11.9 million in March 2022. The JOLTS report will
also showcase the total number of hires, separations, and
quits.
ADP, which is a payroll provider,
will release the National Employment Report tracks growth in
private-sector payrolls for September on Wednesday. It will offer a
preview of what to expect from the Labor Department’s detailed jobs
report on Friday.
Economists expect the nonfarm
payrolls report to show 250,000 job additions in September, down
from 315,000 additions in August. While the hiring pace slows, the
unemployment rate is expected to remain unchanged at 3.7% amid a
tight labor market.
The U.S. jobs market has
demonstrated resilience in 2022 despite rising interest rates which
could very well topple the economy into a recession. In fact, the
labor market recovered all job losses at the onset of COVID-19 as
of July 2022.
PMI Survey data
The S&P Global will
publish the Manufacturing PMI survey on Friday for the month of
September. This tracks business activity and executive confidence
within goods-producing sectors.
The PMI index rose marginally to
51.8 last month, from 51.5 in August, compared to a pandemic-era
high of 63.4 in August 2021. A PMI reading of below 50 is an
indicator of deteriorating business conditions.
In 2022, supply chain
disruptions, falling customer demand, and higher commodity prices
have all contributed to a slowdown in the manufacturing sector this
year.
In addition to the macroeconomic
data, the equity markets will be impacted by corporate earnings for
Q3 later this month. A strong U.S. dollar might act as a massive
headwind for companies in the next year.
The USD is trading at a
two-decade high and might be a major headwind for several
companies. The DXY, also known as the U.S. dollar index, is up 21%
year over year. For every 1% change in the DXY, the S&P 500
earnings will fall by 0.5%. So, in Q4, the S&P 500 earnings
might fall by at least 10%.
Why is a strong USD bad news for
S&P
500? A strong dollar generally results in lower exports. So,
companies with a higher percentage of international sales will be
hit hard. The wild swings in currencies further pressurized the
global economy, which is already wrestling with interest rate hikes
and red-hot inflation.
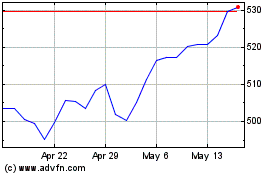
SPDR S&P 500 (AMEX:SPY)
Historical Stock Chart
From Oct 2024 to Nov 2024

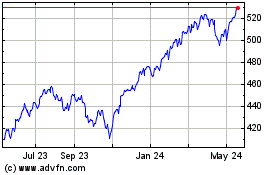
SPDR S&P 500 (AMEX:SPY)
Historical Stock Chart
From Nov 2023 to Nov 2024


