Dogecoin Could Target $0.20 Soon, Analyst Predicts – Is DOGE Primed For A Rally?
28 September 2024 - 11:00PM
NEWSBTC
Dogecoin is trading above $0.12 after a 20% pump over the past two
days, reigniting investor enthusiasm. The meme coin had been
struggling to break past the $0.11 mark, leaving investors
frustrated as other cryptocurrencies surged. The recent
breakout has lifted sentiment, with Dogecoin now eyeing higher
targets. Analysts believe that this momentum could lead to further
gains as DOGE successfully clears key resistance levels. Related
Reading: XRP Struggles Below $0.60 – Metrics Reveal Growing Selling
Pressure One prominent analyst has even set a bullish target of
$0.20 in the coming weeks, suggesting that Dogecoin could see
another significant rally if the broader market remains
strong. The recent breakout could signal the beginning of a
more extended uptrend, especially if DOGE can maintain support
above $0.12 and continue attracting buying interest. Investors will
be keeping a close eye on how Dogecoin performs in the days ahead.
Dogecoin Price Rising Fast Dogecoin is now testing crucial
supply levels around $0.125, a price point not seen since late
July. As the entire crypto market surged, sentiment shifted rapidly
from fear to hope. Investors are now eyeing Dogecoin with renewed
optimism, anticipating further gains in the coming weeks. Prominent
analyst TraderNJ recently shared a detailed technical analysis on
X, highlighting key resistance levels for DOGE at $0.149, $0.178,
and $0.208. TraderNJ expressed strong confidence in the meme coin’s
performance, predicting that Dogecoin could hit the $0.20 mark “in
no time at all.” This bullish outlook reflects the high
expectations surrounding Dogecoin, as historical patterns show that
when meme coins start to rally, they often experience rapid price
acceleration. Dogecoin’s current price action suggests that a
breakthrough past $0.125 could open the door for significant upward
momentum. The crypto market has shown resilience and a tendency to
surprise skeptics, and Dogecoin is no exception. If DOGE manages to
break above its immediate resistance levels, it could potentially
trigger a fast-paced rally, similar to its historical price
movements. Related Reading: Cardano (ADA) Eyes 20% Price Surge –
Funding Rate Suggests Increasing Demand Traders and investors are
closely monitoring Dogecoin’s performance as it tests these crucial
levels. A sustained push above $0.125 would be a positive signal,
reinforcing the bullish sentiment and potentially attracting more
buying interest. However, the meme coin’s notorious volatility
means that sharp fluctuations could accompany any breakout. As
optimism builds, the next few weeks will be critical for
determining whether Dogecoin can maintain its momentum and achieve
the price targets set by analysts like TraderNJ. DOGE Price Action:
Key Levels To Watch Dogecoin (DOGE) is currently trading at $0.124
after two days of impressive gains and renewed market excitement.
The meme coin recently closed above the daily 200 exponential
moving average (EMA) at $0.117, a critical indicator that it had
not surpassed since late July. Reclaiming this level suggests a
potential shift in momentum, indicating long-term strength and a
more positive outlook for the weeks ahead. However, sustaining this
upward trend will require DOGE to maintain its position above the
1D 200 EMA and continue to challenge higher supply levels around
$0.14. If the price manages to break through this resistance, it
could pave the way for further gains and solidify its bullish
trend. Related Reading: Crypto Analyst Predicts Dogecoin Will Surge
1,000% Past ATH – Price Targets Revealed On the flip side, if
Dogecoin fails to hold above the 1D 200 EMA, the bullish scenario
could quickly reverse. A retracement to lower demand levels around
$0.105 would then be expected, potentially signaling a pause in the
recent rally. Investors are watching closely to see if Dogecoin can
maintain its momentum or if it will face another pullback, as it
has in previous months. The next few days will be crucial for
determining the meme coin’s short-term direction. Featured image
from Dall-E, chart from TradingView
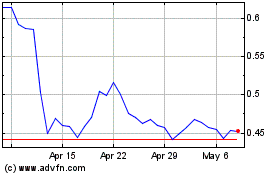
Cardano (COIN:ADAUSD)
Historical Stock Chart
From Oct 2024 to Nov 2024

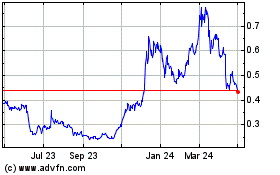
Cardano (COIN:ADAUSD)
Historical Stock Chart
From Nov 2023 to Nov 2024
