Cardano (ADA) NVT Ratio Now Highest Since June: What Does It Mean?
30 October 2024 - 8:00PM
NEWSBTC
On-chain data shows that Cardano’s Network Value to Transactions
(NVT) Ratio has surged recently. Here’s what this could imply for
ADA’s price. Cardano NVT Ratio Has Surged To Its Highest Level
Since June In a new post on X, the market intelligence platform
IntoTheBlock discusses the latest trend in Cardano’s NVT Ratio. The
“NVT Ratio” here refers to an on-chain indicator that keeps track
of the ratio between the ADA market cap and transaction volume.
When the value of this metric is high, it means the value of the
network is high compared to its ability to transact coins.
Generally, this can signal that the coin’s price is overvalued.
Related Reading: Ethereum Bullish Signal: Whales Withdraw $750
Million In ETH From Exchanges On the other hand, the low indicator
implies the market cap may be undervalued compared to the
blockchain’s volume, so ADA’s price could be due to a rebound. Now,
here is a chart that shows the trend in the Cardano NVT Ratio over
the last few months: As is visible in the above graph, the Cardano
NVT Ratio has witnessed a notable surge recently, even though the
coin’s price has been following an overall bearish trajectory. This
would suggest that the transaction volume has tanked on the
network. Following this latest increase, the indicator has spiked
to the highest level since June, implying that the cryptocurrency
hasn’t been this overvalued in six months. The reason behind this
trend is likely to be the lackluster price action the coin has
witnessed for a while now. Other assets, such as Bitcoin, have
started to pop off recently. At the same time, ADA has remained a
sideways movement, so ADA investors may be fed up and leave to
explore greener pastures. Related Reading: “Time To Get Ready For
Another Bull Run,” Bitcoin Analyst Says— Here’s Why “Historically,
elevated NVT ratios often precede price pullbacks,” notes the
analytics firm. Thus, the recent spike in the indicator could spell
further trouble for the already struggling coin. The Cardano NVT
Ratio could now be to keep an eye on in the coming days, as any
more jumps in the metric may confirm a bearish outcome. However,
there is also the possibility that the trend will see a reversal,
with enough activity returning on the network to justify its
current market cap. ADA Price The cryptocurrency sector as a whole
has been rising during the past day, and Cardano has followed suit.
Although the coin’s surge has been smaller than Bitcoin’s, the
asset has climbed above the $0.348 level. The chart below shows the
coin’s recent trajectory. Featured image from Shutterstock.com,
IntoTheBlock.com, chart from TradingView.com
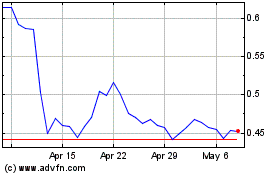
Cardano (COIN:ADAUSD)
Historical Stock Chart
From Oct 2024 to Nov 2024

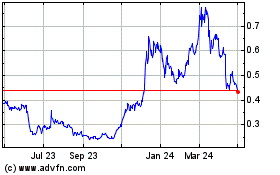
Cardano (COIN:ADAUSD)
Historical Stock Chart
From Nov 2023 to Nov 2024
