0000714562false00007145622024-09-032024-09-03

UNITED STATES

SECURITIES AND EXCHANGE COMMISSION

Washington, DC 20549

FORM 8-K

CURRENT REPORT

Pursuant to Section 13 OR 15(d) of the Securities Exchange Act of 1934

Date of Report (Date of earliest event reported) September 3, 2024

FIRST FINANCIAL CORPORATION

(Exact name of registrant as specified in its charter)

Commission File Number: 0-16759

Indiana

35-1546989

(State or other jurisdiction

(I.R.S. Employer

incorporation or organization)

Identification No.)

One First Financial Plaza, Terre Haute, IN

47807

(Address of principal executive office)

(Zip Code)

(812)  238-6000

(Registrant's telephone number, including area code)

Check the appropriate box below if the Form 8-K filing is intended to simultaneously satisfy the filing obligation of the registrant under any of the following provisions:

Written communication pursuant to Rule 425 under the Securities Act (17 CFR 230.425)

Soliciting material pursuant to Rule 14a-12 under the Exchange Act (17 CFR 240.14a-12)

Pre-commencement communication pursuant to Rule 14d-2(b) under the Exchange Act (17 CFR 240.14d-2(b))

Pre-commencement communication pursuant to Rule 13e-4(c) under the Exchange Act (17 CFR 240.13e-4(c))

Securities registered pursuant to Section 12(b) of the Act:

Title of each class

Trading Symbol

Name of each exchange on which registered

Common Stock, par value $0.125 per share

THFF

The NASDAQ Stock Market LLC

Indicate by check mark whether the registrant is an emerging growth company as defined in Rule 405 of the Securities Act of 1933 (17 CFR §230.405) or Rule 12b-2 of the Securities Exchange Act of 1934 (17 CFR §240.12b-2).

Emerging growth company

If an emerging growth company, indicate by check mark if the registrant has elected not to use the extended transition period for complying with any new or revised financial accounting standards provided pursuant to Section 13(a) of the Exchange Act.

Item 7.01. Regulation FD Disclosure.

Norman D. Lowery, President and Chief Executive Officer, Rodger A. McHargue, Senior Vice President and Chief Financial Officer, and Steve Panagouleas, Senior Vice President and Chief Credit Officer, of First Financial Corporation, Inc. will participate in the Raymond James US Bank and Banking on Tech Conferences being held September 3 – September 4, 2024, by hosting a series of meetings with investors on September 4, 2024.

Attached as Exhibit 99.1 is the information that will be provided to meeting participants. Such information is incorporated herein by reference.

The foregoing information is being furnished pursuant to this Item 7.01 and shall not be deemed to be “filed” for purposes of section 18 of the Securities Exchange Act of 1934, as amended, or otherwise subject to the liabilities of that Section or Sections 11 and 12(a)(2) of the Securities Act of 1933, as amended. In addition, this information shall not be deemed to be incorporated by reference into any of the Registrant’s filings with the Securities and Exchange Commission, except as shall be expressly set forth by specific reference in any such filing.

Item 9.01. Financial Statements and Exhibits

The exhibit to this report is as follows:

Exhibit Number


99.1

First Financial Corporation, Inc. Presentation dated September 3, 2024.

104

Cover Page Interactive Data File (formatted in Inline XBRL and contained in Exhibit 101)

SIGNATURES

Pursuant to the requirements of the Securities Exchange Act of 1934, as amended, the Registrant has duly caused this report to be signed on its behalf by the undersigned hereunto duly authorized.

First Financial Corporation

Dated September 3, 2024

/s/ Rodger A. McHargue

Rodger A. McHargue

Secretary/Treasurer and Chief Financial Officer

Exhibit 99.1

GRAPHIC

: THFF

GRAPHIC

Forward-looking Information This presentation contains future oral and written statements of the Company and its management, forward-looking statements within the meaning of the Private Securities Litigation Reform Act of 1995 with respect to the financial condition, results of operations, plans, objectives, future performance and business of the Company. Forward-looking statements are generally identifiable by the use of words such as “believe”, “expect”, “anticipate”, “estimate”, “could”, and other similar expressions. All statements in this presentation, including forward-looking statements, speak only as of today’s date, and the Company undertakes no obligation to update any statement in light of new information or future events. A number of factors, many of which are beyond the ability of the Company to control or predict, could cause actual results to differ materially from those in its forward-looking statements. Additional information is included in the Company’s filings with the Securities and Exchange Commission. Factors that could have a material adverse effect on the Company’s financial condition, results of operations and future prospects can be found in the “Risk Factors” section in the Company’s Annual Report on Form 10-K for the year ended December 31, 2023 and elsewhere in the Company’s periodic and current reports filed with the Securities and Exchange Commission. These factors include, but are not limited to, the effects of future economic, business and market conditions and changes, domestic and foreign, including competition, governmental policies and seasonality; legislative and regulatory changes, including changes in banking, securities and tax laws and regulations and their application by Company regulators, and changes in the scope and cost of FDIC insurance and other coverages; the risks of changes in interest rates on the levels, composition and costs of deposits, loan demand and other interest sensitive assets and liabilities; the failure of assumptions and estimates underlying the establishment of reserves for possible loan losses, analysis of capital needs and other estimates; changes in borrowers’ credit risks and payment behaviors; and changes in the availability and cost of credit and capital. 2

GRAPHIC

Norman D. Lowery President & Chief Executive Officer Rodger A. McHargue Chief Financial Officer, SVP Stephen P. Panagouleas Chief Credit Officer, SVP 3

GRAPHIC

Illinois 26 Banking Centers Indiana 22 Banking Centers 4 Loan Offices Kentucky 16 Banking Centers Tennessee 16 Banking Centers 3 Loan Offices First Financial Corporation Indiana’s first multi-bank holding company Established 1984 90 Locations 83 full-service banking centers 7 loan production offices $5.4 Billion in Assets $1.9 Billion Trust and Assets Under Management First Financial Bank Primary subsidiary founded in 1834 Oldest national bank in Indiana 5th oldest national bank in the U.S. Terre Haute, Indiana Headquarters 4 Georgia 3 Banking Centers

GRAPHIC

Best Bank Tribune-Star Readers’ Choice Top 50 Best U.S. Bank Bank Director Magazine Our Vision To enhance our clients’ abilities to spend, save, borrow and invest. Our Mission To deliver financial solutions that are simple, fast and easy. Our Values We build strong relationships and treat each other with dignity and respect. We embrace the diversity of our customers and co-workers. We apply the highest standards of excellence to everything we do. We work as a team to deliver world-class customer service. We get involved in our communities. We recognize profitability is essential to our future success. 5 5-Star Rating BauerFinancial Best Ag Lender Pennyrile's Best Magazine

GRAPHIC

TBV $0.00 $10.00 $20.00 $30.00 $40.00 $50.00 2000 2002 2004 2006 2008 2010 2012 2014 2016 2018 2020 2022 2Q24 10 YR CAGR 4.37% Strong Capital Key Capital Ratios and Per Share Data As of June 30, 2024 0.00% 3.50% 7.00% 10.50% 14.00% 17.50% 2000 2002 2004 2006 2008 2010 2012 2014 2016 2018 2020 2022 2Q24 TCE Total Risk Based 15.81% Tier 1 Risk Based 14.82% Tier 1 Leverage 12.14% Book Value $44.92 Tangible Book Value $37.12 6

GRAPHIC

2.37 2.55 2.35 3.12 2.38 3.80 3.80 3.93 4.02 5.82 5.08 1.89 '- 1.50 3.00 4.50 6.00 7.50 2013 2014 2015 2016 2017 2018 2019 2020 2021 2022 2023 YTD 2024 Earnings and Dividends Per Share EPS Dividends Paid 10 YR CAGR 2013 - 2023 EPS 11.43% Dividends 3.33% History of Earnings and Dividend Growth 7

GRAPHIC

Announced Repurchase Amount Shares Amount Completed April 21, 2022 10% 1,243,531 In Progress ** July 21, 2021 5% 652,411 $28,335,713 3/4/22 October 29, 2020 5% 685,726 $29,300,476 6/25/21 February 3, 2016 5% 637,500 $21,677,750 11/30/20 August 25, 2014 5% 667,700 $21,627,262 8/19/15 **As of 06/30/2024 purchased 724,671 for $29,132,283. 518,860 shares remain. History of Shares Repurchases 8

GRAPHIC

FFIEC BHC UBPR Data • Centralized committee structure • We are an in-market lender to clients • Disciplined underwriting Net Charge-offs 0.05% 0.07% 0.06% 0.05% 0.15% 0.00% 0.04% 0.08% 0.11% 0.15% '- 800 1,600 2,400 3,200 4,000 4,800 5,600 2Q23 3Q23 4Q23 1Q24 2Q24 Dollar ($000) % Total Loans 1.29% 1.28% 1.26% 1.25% 1.20% 1.13% 1.25% 1.38% 38,250 38,500 38,750 39,000 39,250 39,500 39,750 40,000 2Q23 3Q23 4Q23 1Q24 2Q24 Amount ($000) % Total Loans Reserves / Loans Non-Performing Assets NPA ($000) Total NPAS/ Loans 2Q23 16,302 0.52% 3Q23 15,671 0.40% 4Q23 24,556 0.78% 1Q24 24,252 0.76% 2Q24 15,916 0.50% Strong Asset Quality 9

GRAPHIC

FFIEC BHC UBPR Data Return on Assets 1.61 1.22 1.32 1.12 1.00 0.88 0.93 0.91 0.84 0.91 0.93 0.9 0.9 0.98 0.94 0.79 0.71 0.72 '- 2016 2017 2018 2019 2020 2021 2022 2023 2Q24 FFC Peer Non-interest Income % Avg Assets FFIEC BHC UBPR Data 1.30 0.98 1.56 1.42 1.25 1.10 1.41 1.22 0.93 0.92 0.95 1.22 1.19 0.97 1.25 1.17 1.06 1.01 '- 2016 2017 2018 2019 2020 2021 2022 2023 2Q24 FFC Peer Better than Peer Performance 10

GRAPHIC

Net Interest Income Loan Growth Driving Growth in Income 107,857 116,579 131,652 146,346 143,401 165,042 167,262 78,214 4.11 4.32 4.25 4.05 3.2 3.55 3.78 3.55 2.00 3.00 4.00 5.00 6.00 '- 42,500 85,000 127,500 170,000 212,500 2017 2018 2019 2020 2021 2022 2023 2Q24 12.37% CAGR NII NIM $’s in (000’s) 11

GRAPHIC

Balance ($000) Commercial Loans By State Total $3,703,385 Diversified Loan Portfolio As of 7/31/24 12 Loan Portfolio Commercial 70.05% Consumer 21.89% Residential 8.06% Commercial $2,594,151 Consumer $810,741 Residential $298,493 IN 41.55% IL 9.83% KY 11.36% TN 27.28% GA 1.88% Other 8.10%

GRAPHIC

Total Loans $810,741,317 97.14% Secured Consumer Loans 66.9% ≥ 700 FICO 19.0% ≥ 650 to 699 10.2% ≥ 600 to 650 3.9% < 600 (Includes No Score) 68.85% Indirect Auto ($558,197,844) 13.1% New ($73,181,673) 86.9% Used ($485,016,171) Asset Quality 30 – 89 day YTD Average Past Due 1.395% Consumer Loan Portfolio As of 7/31/24 13 $135,639,652 HELOC 16.73% $93,752,704 Direct Auto 11.56% $558,197,844 Indirect Auto 68.85% $17,817,398 Other 2.20% $5,333,719 Credit Card 0.66%

GRAPHIC

$165,765,278 $95,019,127 14 Mortgage Loan Portfolio As of 7/31/24 Total Loans $264,393,582 58% YTD Production Sold • Average New Production LTV 77.2% • Average New Production FICO 728 • Primarily in-market lender Portfolio • Underwritten to FHLMC Guidelines • Average credit score 738 • Average DTI 32% • Average Amortized LTV 67.8% • Updated LTV 51.5% Asset Quality • YTD average past due 1.36% Fixed 35.96% Adjustable $95,019,127 64.04% $165,765,278

GRAPHIC

Residential/Multi- Family 40.93% Commercial Income Property 21.36% NOO Retail/Restaurants 11.42% Hotels and Motels 5.75% Owner Occupied CRE 8.42% Residential & Non-Residential Property Managers 3.51% Lessors of Other Real Estate Property 6.62% Mini-warehouses/Self Storage 1.27% Single Family Housing/Subdivisions 0.54% Land Development 0.18% Commercial Real Estate Loan Mix As a % of CRE(Period Ended 6/30/24) 15 Residential/Multi-family $474,552,650 Commercial Income Property $247,702,683 NOO Retail $132,455,294 Owner Occupied CRE $97,614,216 Lessors of Other Real Estate Property $76,734,379 Hotel/Motel $66,696,916 Residential & Non-Residential Property Management $40,642,500 Mini-warehouse/Self-Storage $14,740,114 Single Family Housing $6,265,965 Land Development $2,107,370 Total $1,159,512,087 Total Commercial Real Estate Loans

GRAPHIC

Residential/Multi- Family 41.86% Commercial Income Property 12.31% NOO Retail/Restaurants 12.86% Hotels and Motels 7.45% Owner Occupied CRE 12.03% Residential & Non-Residential Property Managers 3.20% Lessors of Other Real Estate Property 6.25% Mini-warehouses/Self Storage 1.31% Single Family Housing/Subdivisions 0.52% Land Development 2.19% Commercial Real Estate Loan Mix As a % of CRE(Period Ended 7/31/24) 16 Total Commercial Real Estate Loans Residential/Multi-family $593,337,102 NOO Retail $182,264,167 Commercial Income Property $174,497,539 Owner Occupied CRE $170,564,064 Hotel/Motel $105,621,517 Lessors of Other Real Estate Property $88,573,198 Residential & Non-Residential Property Management $45,334,481 Land Development $31,061,657 Mini-warehouse/Self-Storage $18,635,703 Single Family Housing $7,390,364 Total $1,417,279,792

GRAPHIC

Agriculture 26.428% Construction 6.886% Health Services 6.950% Banking & Financial Services 4.447% Floor Plan & Auto Industry 4.215% Retail Eating Establishments 1.709% Other Retail+Convenience 4.732% Transportation & Utilities 3.993% Manufacturing 3.178% Personal Services 9.788% Government Entities 8.309% Schools 2.013% Forestry, Oil/Gas & Energy 5.290% Religious Organizations 1.250% Amusement & Recreation 1.684% Wholesale Distribution 2.637% All All Other 6.492% 17 Commercial & Industrial Loan Mix As a % of Total C & I Loans (Period Ended 6/30/24) Agriculture 26.428% $257,806,625 Personal Services 9.788% $95,485,350 Government Entities 8.309% $81,055,623 Health Services 6.950% $67,796,521 Construction 6.886% $67,175,327 Other Retail + Convenience 4.732% $46,161,664 Transportation & Utilities 3.993% $38,951,102 Floor Plans & Auto Industry 4.215% $41,122,442 Banking & Financial Services 4.447% $43,379,720 Forestry, Oil, Gas & Energy 5.290% $51,605,541 Manufacturing 3.178% $31,000,834 Wholesale Distribution 2.637% $25,725,773 Schools 2.013% $19,637,168 Amusement & Recreation 1.684% $16,428,871 Religious Organizations 1.250% $12,190,733 Retail Eating Establishments 1.709% $16,670,188 All Other 6.492% $63,327,725 Total 100.000% $975,521,206

GRAPHIC

Agriculture 22.037% Construction 9.760% Health Services 6.571% Banking & Financial Services 3.738% Floor Plan & Auto Industry 3.603% Retail Eating Establishments 2.691% Other Retail+Convenience 4.838% Transportation & Utilities 4.571% Manufacturing 4.190% Personal Services 12.675% Government Entities 6.784% Schools 1.606% Forestry, Oil/Gas & Energy 4.137% Religious Organizations 1.297% Amusement & Recreation 2.171% Wholesale Distribution 2.367% All All Other 6.963% 18 Commercial & Industrial Loan Mix As a % of Total C & I Loans (Period Ended 7/31/24) Agriculture 22.037% $259,352,880 Personal Services 12.675% $149,166,239 Construction 9.760% $114,862,116 Government Entities 6.784% $79,839,522 Health Services 6.571% $77,326,505 Other Retail + Convenience 4.838% $56,932,511 Transportation & Utilities 4.571% $53,800,248 Manufacturing 4.190% $49,312,032 Forestry, Oil, Gas & Energy 4.137% $48,903,641 Banking & Financial Services 3.738% $43,995,875 Floor Plans & Auto Industry 3.603% $42,405,866 Retail Eating Establishments 2.691% $31,668,532 Wholesale Distribution 2.367% $27,859,481 Amusement & Recreation 2.171% $25,555,241 Schools 1.606% $18,903,641 Religious Organizations 1.297% $15,264,854 All Other 6.963% $81,941,189 Total 100.000% $1,176,871,207

GRAPHIC

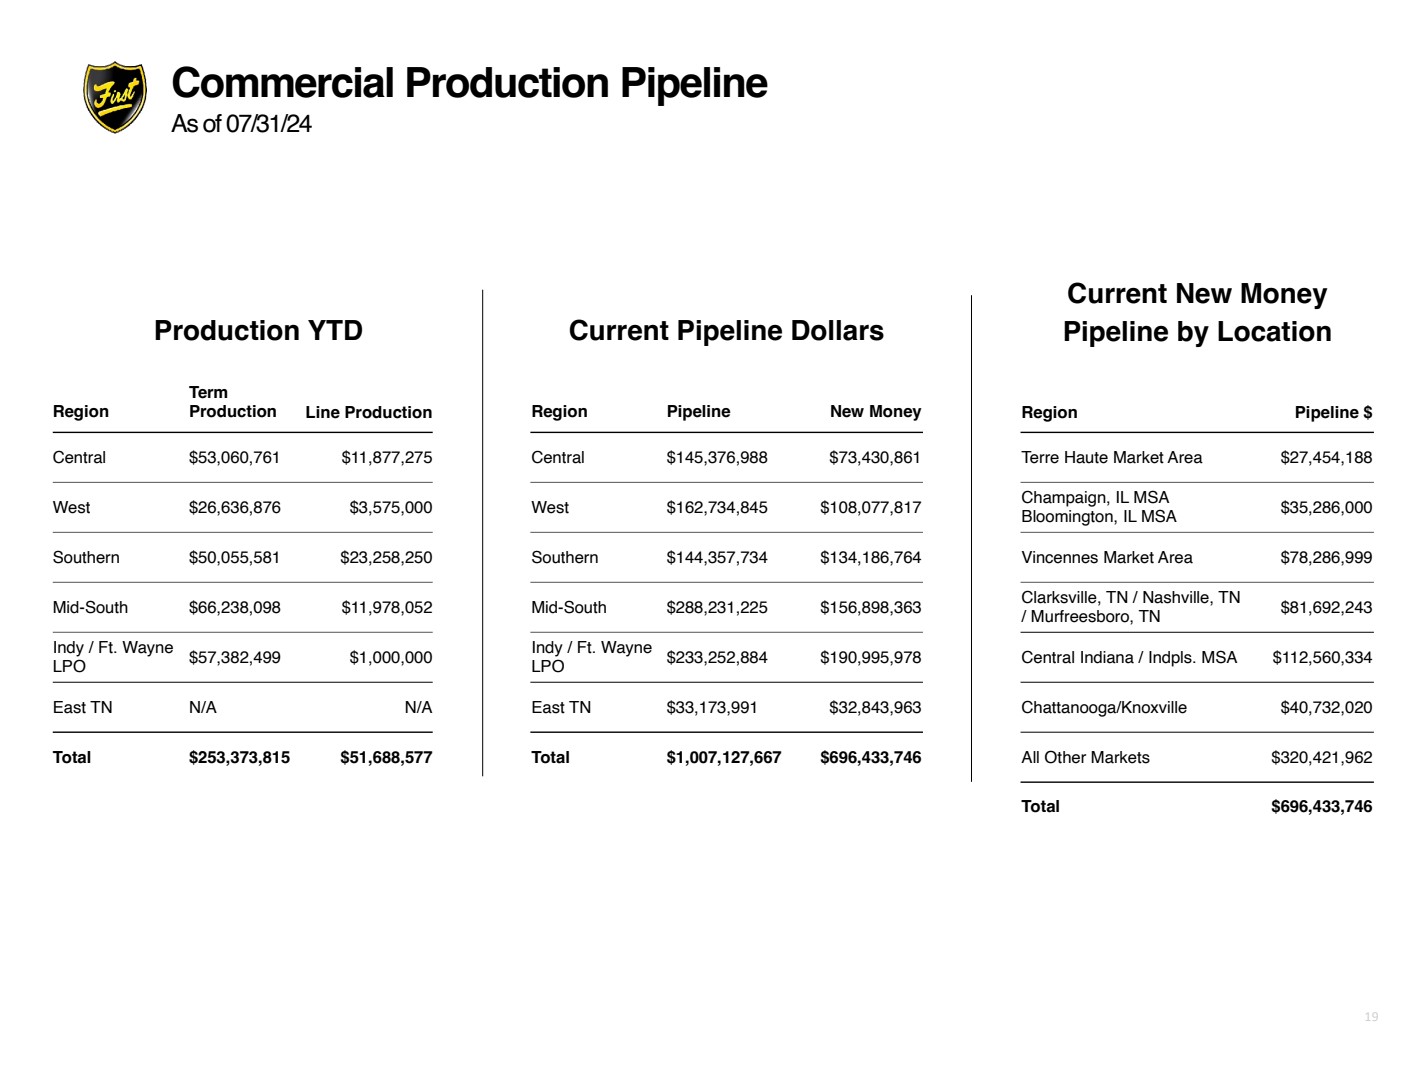
Commercial Production Pipeline As of 07/31/24 19 Region Pipeline New Money Central $145,376,988 $73,430,861 West $162,734,845 $108,077,817 Southern $144,357,734 $134,186,764 Mid-South $288,231,225 $156,898,363 Indy / Ft. Wayne LPO $233,252,884 $190,995,978 East TN $33,173,991 $32,843,963 Total $1,007,127,667 $696,433,746 Production YTD Current Pipeline Dollars Region Term Production Line Production Central $53,060,761 $11,877,275 West $26,636,876 $3,575,000 Southern $50,055,581 $23,258,250 Mid-South $66,238,098 $11,978,052 Indy / Ft. Wayne LPO $57,382,499 $1,000,000 East TN N/A N/A Total $253,373,815 $51,688,577 Region Pipeline $ Terre Haute Market Area $27,454,188 Champaign, IL MSA Bloomington, IL MSA $35,286,000 Vincennes Market Area $78,286,999 Clarksville, TN / Nashville, TN / Murfreesboro, TN $81,692,243 Central Indiana / Indpls. MSA $112,560,334 Chattanooga/Knoxville $40,732,020 All Other Markets $320,421,962 Total $696,433,746 Current New Money Pipeline by Location

GRAPHIC

Strong Core Deposit Franchise Deposit Mix 0.63% 0.38% 0.25%0.19%0.16%0.17%0.25% 0.37% 0.56% 0.36% 0.20% 0.38% 1.26% 1.83% 0.00% 0.45% 0.90% 1.35% 1.80% 2.25% 2011 2012 2013 2014 2015 2016 2017 2018 2019 2020 2021 2022 2023 YTD 2024 Cost of Deposits 0.16 0.23 0.32 0.50 0.32 0.18 0.36 1.23 1.69 0.45 0.54 0.75 0.95 0.54 0.20 0.44 1.74 2.06 '- 0.40 0.80 1.20 1.60 2.00 2.40 2016 2017 2018 2019 2020 2021 2022 2023 2Q24 YTD BHC UBPR Interest Expense FFC Peer FFIEC BHC UBPR Data Non-interest bearing Demand & Savings Time 69.1% 18.1% 12.8 Brokered CDs, 0.0% Average account tenure 13.5 years Estimated uninsured deposits as 38.0% of total deposits Estimated uninsured less collateralized as 20.3% total deposits Cycle to date deposit beta 33.87% 20

GRAPHIC

$90,308 $88,747 $91,289 $104,348 $112,758$117,406 $126,023$130,176 $66,072 0 32500 65000 97500 130000 162500 2016 2017 2018 2019 2020 2021 2022 2023 2Q24 59.4 61.62 58.43 61.23 59.87 63.33 59.51 65.26 68.42 62.21 61.22 61.65 61.22 60.88 59.84 62.03 45.0 51.0 57.0 63.0 69.0 75.0 2016 2017 2018 2019 2020 2021 2022 2Q24 FFC Peer FFIEC BHC UBPR Data Non-interest Expense Efficiency Acquired HopFed Bancorp on 7/27/2019 Acquired Hancock Bancorp on 11/5/2021 Disciplined Expense Management 21

GRAPHIC

$1.9 Billion Trust Assets Under Management Trust & Asset Management 2022 2023 Revenue ($000) 5,155 5,155 Income before Tax 1,586 1,258 Trust and Asset Management 22 Trust Services include: • Professional Farm Management • Trust Administration • Estate Administration • Retirement Services • Corporate Trust Services

GRAPHIC

Well-positioned for sustainable and profitable growth • Diversified business model with strong risk management • High-caliber team members focused on customer service and technology optimization • Expanding presence in larger growth markets • Commercial banking focus with quality core deposits • Demonstrated ability to successfully complete mergers and acquisitions • Unblemished track record of delivering shareholder value • Over 30 consecutive years of increased shareholder dividends Key Investment Points 23

GRAPHIC

2020 2021 2022 2023 2Q24 Net Interest Income 146,346 143,401 165,042 167,262 78,213 Provision 10,528 2,466 <2,025> 7,295 4,766 Non-interest Income 42,476 42,084 46,716 42,702 19,336 Non-interest Expense 112,758 117,406 126,023 130,176 66,072 Net Income 53,844 52,987 71,109 60,672 22,293 Earnings Per Share (diluted) 3.93 4.02 5.82 5.08 1.89 Total Assets 4,557,544 5,175,099 4,989,281 4,851,614 4,891,068 Net Interest Margin 4.05 3.20 3.54 3.78 3.55 Return on Average Assets 1.25 1.10 1.41 1.26 0.93 Return on Average Equity 9.07 8.87 14.37 12.47 8.57 Dollars in millions except per share data 4-Year Financial Highlights 24

GRAPHIC

Norman D. Lowery President and CEO lowerynd@first-online.com 812.238.6185 Rodger A. McHargue Chief Financial Officer, SVP rmchargue@first-online.com 812.238.6334 Stephen P. Panagouleas Chief Credit Officer, SVP spanagouleas@first-online.com 812.238.6431 Thank You! : THFF

v3.24.2.u1
Document and Entity Information
Sep. 03, 2024
Document and Entity Information [Abstract]  
Document Type 8-K
Document Period End Date Sep. 03, 2024
Entity File Number 0-16759
Entity Registrant Name FIRST FINANCIAL CORPORATION
Entity Incorporation, State or Country Code IN
Entity Tax Identification Number 35-1546989
Entity Address State Or Province IN
Entity Address, Address Line One One First Financial Plaza
Entity Address, City or Town Terre Haute
Entity Address, Postal Zip Code 47807
City Area Code 812
Local Phone Number 238-6000
Title of 12(b) Security Common Stock, par value $0.125 per share
Trading Symbol THFF
Security Exchange Name NASDAQ
Entity Emerging Growth Company false
Entity Central Index Key 0000714562
Amendment Flag false
Written Communications false
Soliciting Material false
Pre-commencement Tender Offer false
Pre-commencement Issuer Tender Offer false

First Financial (NASDAQ:THFF)
Historical Stock Chart
From Sep 2024 to Oct 2024 Click Here for more First Financial Charts.
First Financial (NASDAQ:THFF)
Historical Stock Chart
From Oct 2023 to Oct 2024 Click Here for more First Financial Charts.