Highs for Net Income, Assets, Loans and Capital as Bank
Expands Footprint
Freedom Bank of Virginia (Bank) (OTC.QB:FDVA) achieved
several objectives during the first half of 2014 setting all-time
highs for net income, total assets, total loans and capital. The
Bank earned record net income of $828,592 for the first half of
2014. Total assets exceeded $300 million at June 30, 2014,
increasing 17.95% to $300,555,167 from $254,805,078 at June
30, 2013. Loans receivable at June 30, 2014 passed the $250
million mark, increasing to $253,070,371 from
$193,071,420 at June 30, 2013. The Bank's capital
increased $1,437,794 since June 30,
2013, exceeding $27 million for the first time. In
addition to passing these milestones, the Bank opened its
third location in Reston, Virginia.
According to the Chief Lending Officer, C. Kevin Curtis, “The
Bank’s investment in additional lending staff over the past two
years greatly accelerated loan growth over previous years. The 2013
rate was 22.95% and additional staff enhanced the growth rate to
31.08% at June 30, 2014.” CEO Craig S. Underhill added, “We remain
committed to consistent growth in both assets and profits which are
now at record levels.”
Freedom Bank emphasizes relationship banking so deposits
increased proportionally with loans. Demand deposits improved
$11,011,425 (29.12%) to $48,823,404 at June 30, 2014. Money market
account deposits grew $9,571,190 (23.59%) to $50,145,053. Increased
business deposits reduced the Bank’s reliance on higher cost
certificates of deposit, which expanded $23,835,600 (16.25%) to
$170,554,825 at June 30, 2014. Total liabilities increased
$44,312,295 (19.34%) to $273,418,801 in 2014.
Capital continues to be strong expanding $1,437,794 (5.59%) to
$27,136,366 at June 30, 2014. Book value per share was $7.11 at
June 30, 2014, up from $6.78 the prior year. Regulatory Capital
minimums for Tier 1 Leverage Ratio, Risk Based Capital Tier 1, and
Risk Based Capital Tier 2 were 5.0%, 6.0% and 10.0% respectively,
to be considered well capitalized. At June 30, 2014 the ratios for
the Bank were 9.37%, 11.16% and 12.25% respectively, all in the
well capitalized category.
Freedom Bank earned net income of $828,592 for the first half of
2014 compared to net income of $826,309 for the first half of 2013.
Loan growth fueled a 17.77% rise in total interest income. While
deposits grew 20.3% in 2014, interest expense increased only 12.05%
due to large increases in non interest bearing deposits. Additional
loans generated in the first half of 2014 required $76,500 more in
provision expense for 2014. Operating expenses increased $563,051
(13.78%). More compensation for additional lenders, support
personnel and staff for the third branch was the main factor. Also
professional fees rose $144,846 (44.36%), required by escalating
banking regulations and support for the Bank’s M&A subsidiary,
FBV Capital Advisors, Inc. Net income for the second quarter of
2014 represented the Bank's twenty-first consecutive quarterly
profit.
Freedom Bank is a community-oriented, locally-owned bank with
locations in Fairfax, Vienna, and Reston, Virginia. For information
about Freedom Bank’s deposit and loan services, visit the Bank’s
website at www.freedombankva.com.
This release contains forward-looking statements, including our
expectations with respect to future events that are subject to
various risks and uncertainties. Factors that could cause actual
results to differ materially from management's projections,
forecasts, estimates and expectations include: fluctuation in
market rates of interest and loan and deposit pricing, adverse
changes in the overall national economy as well as adverse economic
conditions in our specific market areas, maintenance and
development of well-established and valued client relationships and
referral source relationships, and acquisition or loss of key
production personnel. Other risks that can affect the Bank are
detailed from time to time in our quarterly and annual reports
filed with the Board of Governors of the Federal Reserve System. We
caution readers that the list of factors above is not exclusive.
The forward-looking statements are made as of the date of this
release, and we may not undertake steps to update the
forward-looking statements to reflect the impact of any
circumstances or events that arise after the date the
forward-looking statements are made. In addition, our past results
of operations are not necessarily indicative of future
performance.
The Freedom Bank of Virginia Statements of
Financial Condition UNAUDITED June 30,
2014 June 30, 2013 ASSETS Cash and
due from banks $ 7,260,790 $ 10,091,976 Federal funds sold
15,828,000 14,798,000 Interest Bearing Balances with Banks
1,022,092 1,018,023 Investment securities available for sale, at
fair value 18,823,922 29,398,108 Investment securities held to
maturity 23,780 77,740 Federal Reserve Bank stock 797,400 766,650
Loans held for sale 459,000 3,060,090 Loans receivable 253,070,371
193,071,420 Allowance for possible loan losses (2,695,357 )
(2,456,325 ) Net Loans 250,375,014 190,615,095 Premises and
equipment, net 251,582 237,632 Accrued interest and other
receivables 743,942 875,489 Other assets 1,844,427 1,100,550 Bank
Owned Life Insurance 2,129,218 2,072,864 Deferred Tax Asset
996,000 692,861
Total Assets $
300,555,167 $ 254,805,078
LIABILITIES AND
STOCKHOLDERS' EQUITY Liabilities: Demand deposits: Non-interest
bearing deposits $ 48,823,404 $ 37,811,979 Interest Checking
50,145,053 40,573,863 Savings deposits 2,870,723 1,321,531 Time
deposits 170,554,825 146,719,225
Total Deposits
272,394,005 226,426,598 Other accrued expenses 938,191
2,595,661 Accrued interest payable 86,605
84,247
Total Liabilities
273,418,801 229,106,506
Stockholders' Equity: Common stock, $3.16 par value. (5,000,000
shares authorized: 3,815,029 shares issued and outstanding June 30,
2014 3,791,196 shares issued and outstanding June 30, 2013)
12,042,431 11,967,248 Additional paid-in capital 16,372,319
16,303,442 Accumulated other comprehensive income (230,493 )
(150,171 ) Retained earnings (deficit) (1,047,891 )
(2,421,947 )
Total Stockholders' Equity
27,136,366 25,698,572
Total
Liabilities and Stockholders' Equity $ 300,555,167 $
254,805,078
The
Freedom Bank of Virginia Statements of Operations
UNAUDITED For the three months ended For
the six months ended June 30, June 30,
2014 2013 2014 2013
Interest Income Interest and fees on loans $
3,255,751 $ 2,841,769 $ 6,274,996 $ 5,306,144 Interest on
investment securities 120,280 136,644 256,160 238,005 Interest on
Federal funds sold 5,152 4,350 12,713
12,105 Total Interest Income 3,381,183 2,982,763 6,543,869
5,556,254
Interest Expense Interest on deposits
546,780 477,355 1,075,866 960,197
Net Interest Income 2,834,403 2,505,408 5,468,003 4,596,057
Provision for Possible Loan Losses 135,000
88,500 235,000 158,500 Net Interest
Income after Provision for Possible Loan Losses 2,699,403 2,416,908
5,233,003 4,437,557
Other Income Service charges and
other income 143,695 212,266 215,766 443,804 Increase in cash
surrender value of bank-owned life insurance 13,911
14,442 27,615 29,689 Total Other Income 157,606
226,708 243,381 473,493
Operating Expenses Officers
and employee compensation and benefits 1,469,177 1,309,644
2,850,847 2,514,065 Occupancy expense 149,402 134,797 285,957
259,792 Equipment and depreciation expense 77,551 54,638 154,960
107,342 Insurance expense 54,143 52,907 109,612 104,436
Professional fees 191,533 136,655 421,038 276,192 Data and item
processing 188,888 176,231 371,804 352,872 Business development
40,601 38,832 91,026 86,878 Franchise tax 64,470 61,023 128,218
120,684 Other operating expenses 140,867 153,176
234,330 262,480 Total Operating Expenses
2,376,632 2,117,903 4,647,792 4,084,741
Income before Income Taxes 480,377 525,713 828,592 826,309
Provision for Income Taxes - - -
-
Net Income $ 480,377 $ 525,713 $ 828,592 $ 826,309
Net Income Per Common Share $ 0.13 $ 0.14 $ 0.22 $
0.22
Net Income Per Diluted Share $ 0.13 $ 0.14 $
0.22 $ 0.22
Freedom Bank of VirginiaCraig S. Underhill, President &
CEO703-242-5300
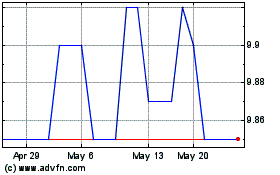
Freedom Financial (QX) (USOTC:FDVA)
Historical Stock Chart
From Dec 2024 to Jan 2025

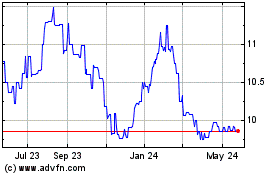
Freedom Financial (QX) (USOTC:FDVA)
Historical Stock Chart
From Jan 2024 to Jan 2025
