Golden Minerals Company (“Golden Minerals,” “Golden” or the
“Company”) (NYSE-A: AUMN and TSX: AUMN) announced today that an
updated Technical Report (“TR”) has been completed as a Preliminary
Economic Assessment (“PEA”) for its Velardeña Properties (Durango
State, Mexico). The TR is prepared as an update of a previous PEA
dated March 1, 2022. The updated TR incorporates additional
information developed by the Company since the 2022 report,
including updated pricing and concentrate sales terms, and the
exclusion of a bio-oxidation plant that was formerly contemplated.
The updated PEA estimates an after-tax net present value (“NPV”) of
$87.6 million, using a discount rate of 8%.
The TR has been completed in accordance with Canadian National
Instrument 43-101 - Standards of Disclosure of Mineral Projects
(“NI 43-101”). The Mineral Resources used for each report were
developed by the independent engineering firm of Tetra Tech and
comply with the requirements of NI 43-101. Preliminary results of
each economic analysis are shown in pre-tax U.S. Dollars. The
Company also plans to file a technical report summary pursuant to
Subpart 1300 of Regulation S-K for the Velardeña Properties.
The TR assumes prices of $1,826/ounce (“oz”) gold, $22.71/oz
silver, $1.02/pound (“lb”) lead (“Pb”) and $1.31/lb zinc (“Zn”).
Mineral Resources were calculated having an effective date of June
1, 2023, as diluted to a minimum of 0.7 meters and are reported at
a $195 net smelter return (“NSR”) cutoff.
Economic Analysis - Highlights
An economic model was prepared for the Velardeña Properties
using Measured, Indicated and Inferred Mineral Resources. Mineral
Resources are not Mineral Reserves and do not have demonstrated
economic viability. This PEA also considers Inferred Mineral
Resources that are too speculative for use in defining Mineral
Reserves. Results of the economic analysis are:
- Mine Life: 10.5 years
- Pre-tax NPV8%: $136.7M, IRR: 1,320.2%
- After-tax NPV8%: $87.6M, IRR: 860.7%
- Payback: Less than one year
Estimated Sulfide Resources
Classification
Mineral
Type
Tonnes
Grade Ag
g/t
Grade Au
g/t
Grade Pb%
Grade Zn%
Ag oz
Au oz
Pb lb.
Zn lb.
Measured
Sulfide
203,200
402
6.02
1.71
2.08
2,625,900
39,300
7,680,000
9,306,300
Indicated
Sulfide
462,700
402
5.32
1.68
2.08
5,983,000
79,200
17,090,700
21,173,100
Measured +
Indicated
Sulfide
665,900
402
5.54
1.69
2.08
8,608,900
118,500
24,770,700
30,479,400
Inferred
Sulfide
1,059,900
413
5.1
1.81
2.26
14,067,200
173,700
42,294,600
52,697,800
Notes:
- Resources are reported as diluted tonnes and grade to 0.7 m
fixed width.
- Metal prices for NSR cutoff are: $22.71/oz-Ag, $1,826/oz-Au,
$1.02/lb Pb and $1.31/lb Zn.
- Columns may not total due to rounding.
- Sulfide estimated resources taken from Table 1-1: Velardeña
Project Mineral Resources.
Economic Analysis - Details
Economic model results are summarized below. The model includes
Measured, Indicated and Inferred Mineral Resources. Closure and
reclamation costs of $1.5 million are assumed to be offset by
salvage value and are therefore not included. The life of mine
(“LOM”) is 10.5 years, with an NPV of $87.6 million using a
discount rate of 8%.
Production Summary Total - LOM Financial
Summary Total ($M) Material Mined and Processed (kt)
1,216
Gross Payable
$ 601.70
Grade Au (g/t)
5.44
TCs, RCs and Freight
$ (84.80)
Grade Ag (g/t)
359
Penalties
$ (3.50)
Grade Pb (%)
2.21
NSR
$ 513.40
Grade Zn (%)
1.88
Operating Costs Lead Concentrate Mining
$ (154.40)
Au Recovered (koz)
15.85
Processing
$ (33.90)
Ag Recovered (koz)
10,651
G&A
$ (49.40)
Pb Recovered (klbs)
37,351
Contingency
$ (35.70)
Au Grade in Concentrate (g/t)
9.3
Total Operating Cost
$ (273.40)
Ag Grade in Concentrate (g/t)
6,250
Federal Mining Royalty
$ (2.70)
Pb Grade in Concentrate (%)
31.96
EBITDA
$ 237.40
Zinc Concentrate
Capital Costs Zn Recovered (klbs)
26,724
Mine Equipment
$ (0.80)
Ag Recovered (koz)
426
Processing Plant
$ (0.10)
Zn Grade in Concentrate (%)
50.26
Sustaining Capital
$ (3.60)
Ag Grade in Concentrate (g/t)
548.88
Surface Infrastructure and Other
$ (0.30)
Pyrite Concentrate Contingency
$ (0.70)
Au Recovered (koz)
171.81
Total Capital Costs
$ (5.50)
Ag Recovered (koz)
1,886
Change in Working Capital
$ (1.40)
Au Grade in Concentrate (g/t)
19.66
Pre-tax Cash Flow
$ 230.40
Ag Grade in Concentrate (g/t)
216
NPV8%
$ 136.70
IRR
1320%
Smelter Payable
Payback (years) <1 year Payable Au
(koz)
143.91
Mexico SMT
$ (17.80)
Payable Ag (koz)
12,020
Income Tax
$ (64.60)
Payable Pb (klbs)
35,484
After-tax Cash Flow
$ 148.00
Payable Zn (klbs)
22,715
NPV8%
$ 87.60
IRR
861%
NSR/tonne
$ 422.24
Operating Cost Estimates
Item Total Unit Cost ($000s) ($/t-milled)
Mining Costs
$154,407
$126.99
Processing Costs
$33,921
$27.90
G&A and Overhead
$49,375
$40.61
Contingency
$35,655
$29.32
Total1
$273,358
$224.82
Mexico Precious Metals Royalty
$2,679
$2.20
1 Columns may not total due to
rounding.
Run of Mine Production Summary
Conceptual stope shapes for the PEA production plan utilize the
weighted average vein width of 0.7 meters. An additional dilution
factor of 10% has been applied to the recoverable tonnes to align
with current reconciliation data from the test mining operations at
Velardeña.
Description Value Units ROM Mined
1,216
kt ROM Grades: Grade Au
5.44
g/t Grade Ag
359.31
g/t Grade Pb
2.21
%
Grade Zn
1.88
%
Contained Metal: Gold (Au)
213
koz Silver (Ag)
14,046
koz Lead (Pb)
59,278
klb Zinc (Zn)
50,308
klb
Process Summary
Description Units Total Conc. Pb Conc.
Zn Conc. Fe Conc. Products
348,940
53,007
24,118
271,816
Recoveries: Au %
88.2
7.5
-
80.8
Ag %
92.3
75.8
3.0
13.4
Pb %
63.0
63.0
-
-
Zn %
53.1
-
53.1
-
Recovered Metals: Gold (Au) koz
187.7
15.8
-
171.8
Silver (Ag) koz
12,963
10,651
426
1,886
Lead (Pb) klb
37,351
37,351
-
-
Zinc (Zn) klb
26,724
-
26,724
-
Sensitivity Analysis
Results of the sensitivity analyses show the project is most
sensitive to precious metal prices, precious metal recoveries and
operating costs. A 10% change in operating costs resulted in a 12%
change in project NPV. Because of the sensitivity to operating
costs, efforts to control or reduce operating costs are key to the
economic success of the project.
Liquidity Update
At July 31, 2023, the Company had current assets of
approximately $9.7 million, including cash and cash equivalents of
approximately $2.9 million. On the same date, it had accounts
payable and other current liabilities of approximately $6.6
million. While the Company continues to explore various financing
alternatives and asset sales, the Company has not yet obtained a
source of capital that would permit it to restart production at the
Velardeña Properties or fund general and administrative expenses.
The Company has announced a letter of intent for the sale of the
Santa Maria property for initial cash proceeds of $1.5 million;
however, if that transaction is consummated the funds would likely
not be received until the end of September 2023 or later. If the
Company is unable to arrange near term capital inflows from
financing, asset sales or otherwise, its cash balance may be
depleted during the third quarter of 2023 and the Company may be
forced to liquidate or wind-up its business operations.
Cautionary Note Regarding Inferred Resources
The discounted cash flows shown above are prepared in compliance
with NI 43-101. There is no certainty that the economic results
described above will be realized. If the Company is able to obtain
sufficient capital and restart production at the Velardeña
Properties, the Company would do so without completing customary
feasibility studies demonstrating the economic viability of the
project. A mine production decision that is made without a
feasibility study carries additional potential risks which include,
but are not limited to, (i) increased uncertainty as to projected
initial and sustaining capital costs and operating costs, rates of
production and average grades, and (ii) the inclusion of Inferred
Mineral Resources, as defined by NI 43-101 that are considered too
geologically speculative to have the economic considerations
applied to them that would enable them to be converted to a Mineral
Reserve, as defined by NI 43-101. Mine design and mining schedules,
metallurgical flow sheets and process plant designs may require
additional detailed work and economic analysis and internal studies
to ensure satisfactory operational conditions and decisions
regarding future targeted production.
No Mineral Reserves have been estimated for the Velardeña
Properties. Mineral Resources that are not Mineral Reserves do not
have demonstrated economic viability. The economic model for the
Velardeña Properties is preliminary in nature and includes inferred
Mineral Resources that are too geologically speculative to have
economic considerations applied to them that would enable the
Inferred Mineral Resources to be classified as Mineral Reserves,
and there is no certainty that the preliminary economic model for
the Velardeña Properties will be realized.
About Golden Minerals
Golden Minerals is a gold and silver producer based in Golden,
Colorado. The Company is primarily focused on initiating production
at its Velardeña Properties (Mexico), advancing its Yoquivo
gold-silver property (Mexico), advancing its El Quevar silver
property (Argentina) through partner-funded exploration and on
acquiring and advancing selected mining properties in Mexico,
Nevada and Argentina.
Forward-Looking Statements
This press release contains forward-looking statements within
the meaning of Section 27A of the Securities Act of 1933, as
amended and Section 21E of the Securities Exchange Act of 1934, as
amended, and applicable Canadian securities legislation, including
statements regarding estimated resources, estimated mine life,
projected economic analyses associated with the Velardeña
Properties; cash proceeds from the potential sale of the Santa
Maria property and the possibility of the Company being forced to
liquidate and wind up its business operations in the event that the
Company is unable to arrange near term capital inflows. These
statements are subject to risks and uncertainties, including the
Company’s ability to obtain a source of capital sufficient to allow
it to restart operations at the Velardeña Properties and continue
to pay general and administrative expenses; changes in
interpretations of geological, geostatistical, metallurgical,
mining or processing information and interpretations of the
information resulting from exploration, analysis or mining and
processing experience; and the Company’s ability to successfully
mine the Velardeña Properties as contemplated in the PEA. Golden
Minerals assumes no obligation to update this information.
Additional risks relating to Golden Minerals may be found in the
periodic and current reports filed with the Securities and Exchange
Commission by Golden Minerals, including the Company’s Annual
Report on Form 10-K for the year ended December 31, 2022.
Qualified Person
The following Qualified Persons from Tetra Tech will co‐author
the technical report that will be filed on SEDAR within 45 days of
this news release: Dr. Guillermo Dante Ramírez Rodríguez, Mr.
Randolph P. Schneider and Ms. Kira Lyn Johnson. Each of these
Qualified Persons has reviewed and approved the information
presented in this news release that was derived from the sections
of the PEA study for which they were responsible. Each of the named
Qualified Persons is independent of Golden Minerals.
Follow us at www.linkedin.com/company/golden-minerals-company/
and https://twitter.com/Golden_Minerals.
SOURCE: Golden Minerals Company
View source
version on businesswire.com: https://www.businesswire.com/news/home/20230822187637/en/
For additional information please visit
http://www.goldenminerals.com/ or contact: Golden Minerals Company
Karen Winkler, Director of Investor Relations (303) 839-5060
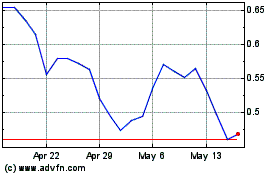
Golden Minerals (AMEX:AUMN)
Historical Stock Chart
From Dec 2024 to Jan 2025

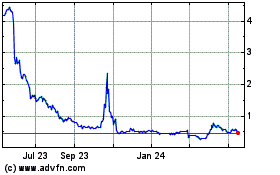
Golden Minerals (AMEX:AUMN)
Historical Stock Chart
From Jan 2024 to Jan 2025
