SofTech, Inc. (OTCQB: SOFT), a proven
provider of Product Lifecycle Management (PLM) solutions today
announced its third quarter fiscal year 2014 operating results.
Revenue for the three months ended February 28, 2014 was
approximately $1.34 million as compared to approximately $1.46
million for the same period in the prior fiscal year. The net loss
for the current quarter was about ($275,000) or ($.31) per share
compared to $(14,000) or $(.01) per share for the same period in
the prior fiscal year. EBITDA for current quarter was about
$(93,000) as compared to about $183,000 for the same period in
fiscal year 2013.
Gross margins declined to 57.8% in the current
quarter as compared to 77.3% in the comparative quarter in fiscal
2013. In connection with the sale of the CADRA product line in Q2
of fiscal 2014, the Company retained the right to distribute CADRA
throughout Europe (except Germany) and to the largest U.S. customer
for that technology at margins ranging from 30% to 40%. This
reselling activity is responsible for the decline in gross margin
in the current quarter. Approximately 39% of the revenue for the
current quarter was derived from the CADRA product line as a
reseller of that technology.
The increase in the net loss in the current
quarter as compared to the same period in fiscal 2013 is primarily
due to: 1) non-recurring expenses of approximately $116,000 of
lenders and professional services fees related to the December 2013
loan amendment, and 2) reduced profitability earned when generating
revenue from technologies of others as a reseller.
As previously announced, the Company amended
its debt agreement during the current quarter in order to adjust
for the sale of the CADRA product line. As part of that amendment,
the Company paid down $1.7 million of its debt facility bringing
the outstanding debt to its lowest level since 1997. The Company
incurred expenses of approximately $116,000 related to lender and
professional fees in connection with this amendment which were
expensed as part of SG&A.
“The liquidity provided from the sale of the
CADRA product line, as expected, has significantly improved our
balance sheet as will the deferred payments of up to an additional
$686,000 from Mentor Graphics not yet reflected as deferred
payments on our balance sheet,” said Joe Mullaney, SofTech’s CEO.
“Our challenge will be in identifying new opportunities that are
compatible with the skill set of our employee group while
protecting the value of our existing revenue streams. We are
confident we can transform this business and continue to build
shareholder value during that process,” he added.
FINANCIAL
STATEMENTS
The Statements of Operations for the three and
nine-month periods ended February 28, 2014 compared to the same
periods in the prior fiscal year are presented below. A
reconciliation of Net income (loss) to EBITDA, a non-GAAP financial
measure, is also provided.
Statements of Operations
(in thousands, except % and per share
data)
For the three months ended Feb. 28, Feb.
28, Change 2014
2013 $
% Product revenue $ 426 $ 244 $ 182
74.6 % Service revenue 916 1,215 (299 ) -24.6 % Royalties on sale
of patents - - - -
Total revenue 1,342 1,459 (117 )
-8.0 % Cost of sales 566 331
235 71.0 % Gross margin 776 1,128 (352 ) -31.2 %
Gross margin % 57.8 % 77.3 % R&D 276 231 45 19.5 %
SG&A 835 848 (13 ) -1.5 % Gain on sale of CADRA product line
(64 ) - (64 ) - Operating
income (loss) (271 ) 49 (320 ) -653.1 % Interest expense 10 63 (53
) -84.1 % Other income (6 ) - (6 ) -
Loss from operations before income taxes (275 ) (14 ) (261 )
1864.3 % Provision for income taxes - -
- - Net loss (275 ) (14 )
(261 ) 1864.3 % Weighted average shares outstanding
875 1,039 (164 ) -15.8 % Basic and
diluted net loss per share: $ (0.31 ) $ (0.01 ) $ (0.30 ) -107.1 %
Reconciliation of Net income to EBITDA: Net
loss $ (275 ) $ (14 ) $ (261 ) 1864.3 % Plus interest expense 10 63
(53 ) -84.1 % Plus tax expense - - - - Plus depreciation and
amortization 56 63 (7 ) -11.1 % Plus non-recurring professional
fees 116 71 45 63.4 %
EBITDA $ (93 ) $ 183 $ (276 ) -150.8 %
For the nine
months Feb. 28, Feb. 28,
Change 2014 2013
$ % Product revenue $ 1,042 $
936 $ 106 11.3 % Service revenue 3,089 3,574 (485 ) -13.6 %
Royalties on sale of patents - 290
(290 ) - Total revenue 4,131
4,800 (669 ) -13.9 % Cost of sales
1,199 1,012 187 18.5 % Gross
margin 2,932 3,788 (856 ) -22.6 % Gross margin % 71.0 % 78.9 %
R&D 915 799 116 14.5 % SG&A 2,582 2,391 191 8.0 %
Gain on sale of CADRA product line (155 ) -
(155 ) - Operating income (loss) (410 ) 598
(1,008 ) -168.6 % Interest expense 203 198 5 2.5 % Other income
(28 ) (11 ) (17 ) 154.5 % Income (loss) from
operations before income taxes (585 ) 411 (996 ) -242.3 % Provision
for income taxes - - - -
Net income (loss) (585 ) 411
(996 ) -242.3 % Weighted average shares outstanding
884 1,010 (126 ) -12.5 % Basic and
diluted net income (loss) per share: $ (0.66 ) $ 0.41 $
(1.07 ) -107.1 %
Reconciliation of Net income to
EBITDA Net income (loss) $ (585 ) $ 411 $ (996 ) -242.3
% Plus interest expense 203 198 5 2.5 % Plus tax expense - - - -
Plus depreciation and amortization 153 156 (3 ) -1.9 % Plus
non-cash goodwill write-off 3,261 - 3,261 - Plus non-recurring
professional fees 113 71 42
59.2 % EBITDA $ 3,145 $ 836 2,309
276.2 %
The Balance Sheets as of February 28, 2014 and
our fiscal year ended May 31, 2013 are presented below.
Balance Sheets
(in thousands)
As of Feb. 28, May 31, 2014
2013 Cash $ 1,327 $ 1,288 Accounts receivable 1,522 895
Other current assets 55 299 Total current assets
2,904 2,482 Property and equipment, net 103 61
Goodwill 992 4,249 Other non-current assets 937 922
Total assets $ 4,936 $ 7,714 Accounts payable $ 690 $ 137
Accrued expenses 425 602 Deferred maintenance revenue 1,405 2,147
Current portion of long term debt 964 - Other current liabilities
133 102 Total current liabilities 3,617
2,988 Other non-current liabilities 52 39 Long term debt
- 2,700 Total liabilities 3,669 5,727
Redeemable common stock 275 275
Stockholders' equity 992 1,712 Total liabilities,
redeemable common stock and stockholders' equity $ 4,936 $ 7,714
About
SofTech
SofTech, Inc. (OTCQB: SOFT) is a proven
provider of product lifecycle management (PLM) solutions, including
its ProductCenter® PLM solution and its Connector technology
offering.
SofTech’s solutions accelerate productivity and
profitability by fostering innovation, extended enterprise
collaboration, product quality improvements, and compressed
time-to-market cycles. SofTech excels in its sensible approach to
delivering enterprise PLM solutions, with comprehensive
out-of-the-box capabilities, to meet the needs of manufacturers of
all sizes quickly and cost-effectively.
Over 100,000 users benefit from SofTech
software solutions, including General Electric Company, Goodrich,
Honeywell, AgustaWestland, Sikorsky Aircraft and the U.S. Army.
Headquartered in Lowell, Massachusetts, SofTech (www.softech.com)
has locations and distribution partners in North America, Europe,
and Asia.
SofTech and ProductCenter are registered
trademarks of SofTech, Inc. All other products or company
references are the property of their respective holders.
Forward Looking Statements
This press release contains forward-looking
statements relating to, among other matters, our outlook for fiscal
year 2014 and beyond. In some cases, you can identify
forward-looking statements by terms such as “may,” “will,”
“should,” “could,” “would,” “expects,” “plans,” “anticipates,”
“believes,” “estimates,” “projects,” “predicts,” “potential” and
similar expressions intended to identify forward-looking
statements. These forward-looking statements are based on
estimates, projections, beliefs, and assumptions and are not
guarantees of future events or results. Actual future events and
results could differ materially from the events and results
indicated in these statements as a result of many factors,
including, among others, (1) generate sufficient cash flow from our
operations or other sources to fund our working capital needs and
growth initiatives; (2) maintain good relationships with our
lenders; (3) comply with the covenant requirements of the loan
agreement; (4) successfully introduce and attain market acceptance
of any new products and/or enhancements of existing products; (5)
attract and retain qualified personnel; (6) prevent obsolescence of
our technologies; (7) maintain agreements with our critical
software vendors; (8) secure renewals of existing software
maintenance contracts, as well as contracts with new maintenance
customers; (9) secure new business, both from existing and new
customers; and (10) complete any required restructuring of the
business subsequent to the sale of our CADRA product line.
These and other additional factors that may
cause actual future events and results to differ materially from
the events and results indicated in the forward-looking statements
above are set forth more fully under “Risk Factors” in the
Company’s Annual Report on Form 10-K for the fiscal year ended May
31, 2013 and its Quarterly Report on Form 10-Q for the fiscal
quarter ended February 28, 2014. The Company undertakes no
obligation to update these forward-looking statements to reflect
actual results, changes in assumptions or changes in other factors
that may affect such forward-looking statements.
Use of Non-GAAP
Financial Measures
In addition to financial measures prepared in
accordance with generally accepted accounting principles (GAAP),
this press release also contains non-GAAP financial measures.
Specifically, the Company has presented EBITDA, which is defined as
Net income (loss) plus interest expense, tax expense, non-cash
expenses such as depreciation, amortization, non cash loss (gain)
and stock based compensation expense. The Company believes that the
inclusion of EBITDA helps investors gain a meaningful understanding
of the Company’s core operating results and enhances comparing such
performance with prior periods, without the effect of non-operating
expenses and non-cash expenditures. Management uses EBITDA, in
addition to GAAP financial measures, as the basis for measuring our
core operating performance and comparing such performance to that
of prior periods. EBITDA is also the most important measure of
performance in measuring compliance with the Company’s debt
facility. EBITDA is not meant to be considered superior to or a
substitute for results of operations prepared in accordance with
GAAP. Reconciliations of EBITDA to the most directly comparable
GAAP financial measures are set forth in the text of, and the
accompanying tables to, this press release.
SofTech, Inc.Joseph P. Mullaney,
978-513-2700Chief Executive Officer
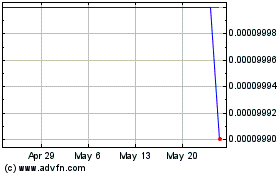
SofTech (CE) (USOTC:SOFT)
Historical Stock Chart
From Feb 2025 to Mar 2025

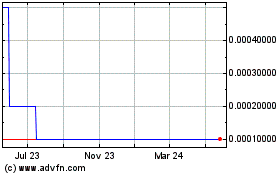
SofTech (CE) (USOTC:SOFT)
Historical Stock Chart
From Mar 2024 to Mar 2025
